Arguably the single most significant reason for Instagram’s recent stellar success has been its introduction of Instagram Stories. It may be a near-copy of Snapchat’s greatest offering, but it brought a whole new generation of fans to Instagram, and the social network’s user numbers have grown phenomenally ever since. However, if you take your Instagram Stories seriously, you are going to want to know how your Stories perform.
A Complete Guide to Instagram Stories Analytics:
The Number of IG Users
In January 2022, Instagram was surveyed to be the fourth most popular social media app with over 1.4 billion users, with Facebook, YouTube, and WhatsApp ranking first, second and third, respectively. IG has come a long way from just being a place where you can post photos of your food, your friends, and stories of your day-to-day life. With more features available for storytelling, Instagram has seen a surge in popularity for users looking to share stories in more interactive and engaging ways.
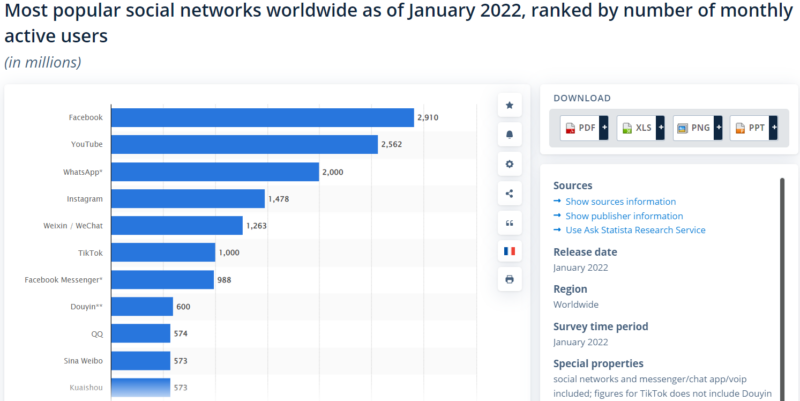
Source: statista.com
With that said, IG Stories provide Business or Creator users with useful analytics on their followers, engagement rate, total views, exit rates, and a number of other important measurements. While a lot can be said about this platform, that of Snapchat pales in comparison to the analytics Stories can provide.
Instagram Stories is a Snapchat Killer
We have looked at Instagram Stories in detail over multiple posts, including How to Use Instagram Stories Like an Expert. Instagram introduced Stories in August 2016, partly as an attempt to take on Snapchat and its young audience. It has snowballed in popularity, to the point where more than 500 million Instagrammers use Instagram Stories every day.
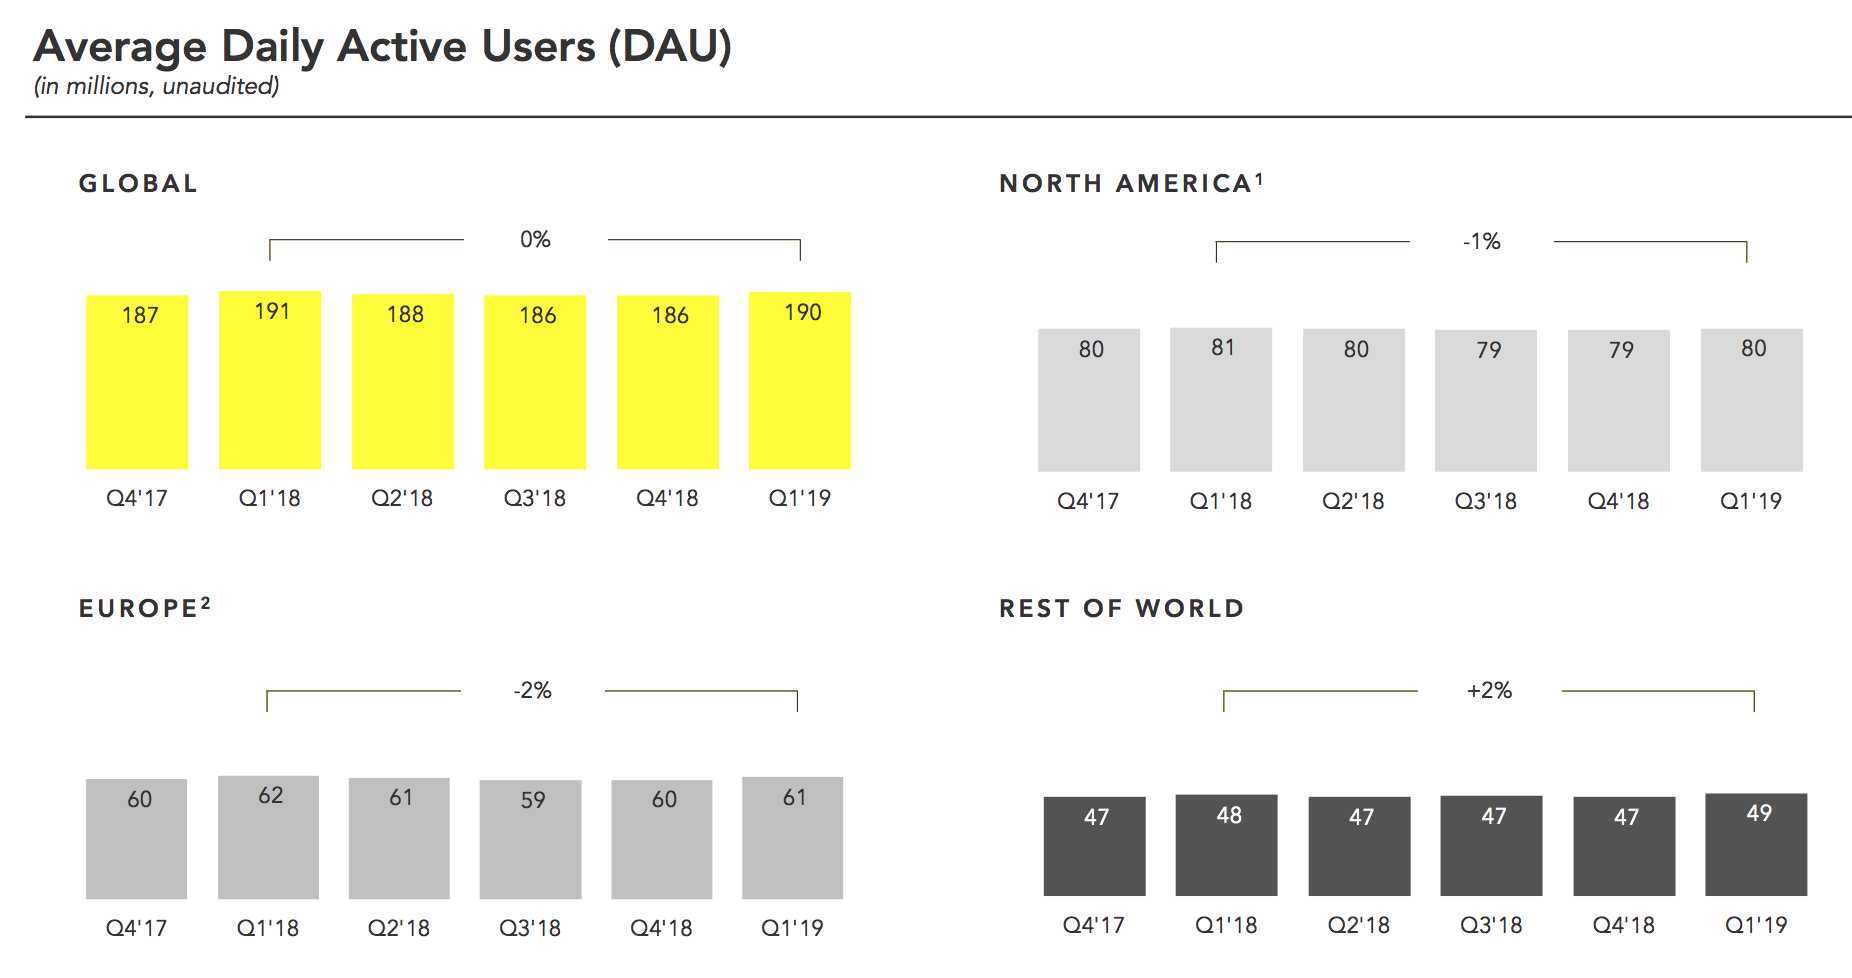
Source: techcrunch.com
Snapchat currently has over 550 million active users worldwide, with 363 million daily active users, which is still considerably fewer than those who use Instagram Stories. This means that Instagram has quickly become the most popular platform for ephemeral content, with a larger audience than Snapchat.
This is good news for businesses and brands that want to use Instagram Stories to reach their target audiences. However, it also means that there is more competition for attention on Instagram Stories. This is where Twitter and tweet-sharing come in.
Tweet Away on Your Instagram Stories
If you are an Apple user and are both on Twitter and Instagram, you can now share public tweets on Instagram Stories. This is possible as long as you have the latest version of the Twitter app installed and the Instagram app as well.
To share a tweet on Instagram Stories, log in to both apps, then open the Twitter app. When you find a tweet that you want to share on Instagram, simply tap the share button and select the Instagram icon. Expect a story draft to appear in the Instagram app with the tweet included. It will appear as an IG sticker that can be resized and moved. When you are ready to publish your story, you have the option to share it with one or more Instagram accounts or with all your IG followers.
Tracking Instagram Stories is Essential for Evaluating Your Overall Success
Instagram users who are influencers or content creators need to be more strategic in how they use Instagram Stories. This is because Instagram Stories only last for 24 hours and then they are gone forever.
This makes Instagram Stories the perfect platform for sharing content that is timely or newsworthy, but it also means that you need to be aware of how your stories are performing in order to ensure that you are getting the most out of this platform. That said, Instagram does provide some Instagram Stories analytics.
Changing your account to an Instagram Business Account is the first step in gaining access to analytics for any Instagram posts or Stories you've created. If you haven’t yet done so, we have full instructions on how to make the switch (along with four reasons why you should do so).
Once you are set up as an Instagram business profile, you can access any IG analytics by going into your Insights section. To find this, click on your profile picture in the bottom right corner of the app. This will take you to your profile page.
The app has changed in appearance recently, as Instagram adds new features, but at the time of writing, you can access your Insights page by either:
- Clicking on the “hamburger” icon in the top right corner of your profile page (which will slide a whole series of options across the page), or
- Simply drag (using one finger) from right to left on your profile page, and this will again bring up a series of options.
At the top of this vertical menu of options is Insights. Click on this button.
Your Insights come with three tabs: Activity, Content, and Audience. The critical tab here (in terms of Stories) is the middle one, Content. Click on it. This will tell you the number of posts you have made this week, comparing it with last week’s performance.
The rest of the page is split between Posts, Stories, and Promotions. Obviously, it’s the middle section, entitled Stories, that is of most interest to us.
Essential Metrics for an Instagram Story
For every IG story you create, Instagram will give you a range of metrics that you can use to analyze and understand its performance. The best part about Instagram's analytics is that they are very comprehensive, and you can learn a great deal about how your audience is interacting with your content.
Here are some of the essential metrics that Instagram provides for Instagram Stories:
Story Reach and Impressions
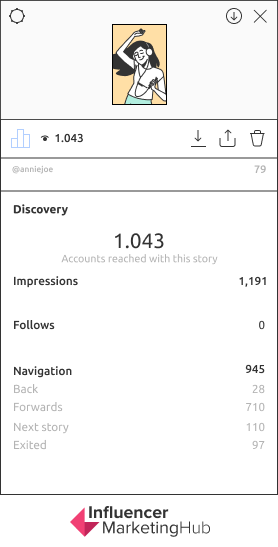
For marketers and business owners who want to increase their brand awareness, reach is a key metric. Instagram defines reach as the number of unique accounts that have seen your story. Impressions, on the other hand, are the total number of times your story has been seen, regardless of whether it was seen by the same account multiple times.
For example, if you have created an Instagram story that has been seen by 100 unique accounts, your reach would be 100. However, if those 100 unique accounts have seen your story a total of 200 times, your impressions would be 200. Essentially, reach is the number of people who have seen your story, while impressions are the number of times your story has been seen.
While both of these metrics are important, reach is often given more weight than impressions, as it is a good indicator of how many people are actually seeing your content. That's because Instagram stories only appear in a person's feed if they follow you. However, it's also worth taking impressions into account, as they can give you an idea of how often people are interacting with your story once they've seen it.
Both reach and impressions will let you know how many people have seen and interacted with your stories, and what kind of content is resonating with them the most. If you notice declining reach levels over time, you may want to review the types of content you place in your stories. Your audience may be beginning to become tired of your usual fare. To make your stories even more engaging and captivating, try incorporating creative visuals into your stories such as filters and GIFs.
Stories Completion Rate
Of course, not only do you want people to see your Instagram stories, but you also want them to actually watch them. After all, what's the point of creating a story if no one is going to watch it?
This is where Instagram's stories completion rate metric comes in. This measures the percentage of people who have seen your story and watched it until the end.
A high completion rate indicates that people are interested in your story and are actually taking the time to watch it. On the other hand, a low completion rate could mean that your stories are too long or that they're not interesting enough to hold people's attention.
To improve your Instagram stories completion rate, try to keep your stories short and sweet, and make sure they're visually engaging. You can also use Instagram's "Swipe Up" feature to direct people to your website or other external links.
Remember, IG stories only last for 24 hours, so make sure you're creating content that is timely and relevant.
To see the success of an individual story, look at the four stats shown for each slide of your Story (under Navigation): Back, Forward, Next Story, and Exit. As these names indicate, they show how the viewers moved on from this particular slide.
On a perfect story, we would have many Taps Forward (part from the last slide, where the bulk of the viewers would either Exit or move to Next Story).
The number of Taps Forward does not necessarily indicate something positive, however. There are quite a few people who speed-tap forward through Instagram Stories without paying much attention to the slides in between. As a result, Taps Forward needs to be analyzed in conjunction with other data.
Taps Backward can often be a good sign that people enjoy your content, as it means that they are willing to play your Story again (or go into one of your previous stories). So, you should consider uploading more content like the one with higher than usual Taps Backwards rates.
While Next Story and Exits (apart from the last slide) may both indicate dissatisfaction with your story, Next Story is potentially worse. This shows that the users have become bored with your Story and want to look at something else. On the other hand, an Exit may just mean that the person has run out of time, maybe to get back to work. They may even pick up the story later in the day. Another option is that you have included a clickable link in your Story, and the person has swiped up to access the link, clicked on it and exited the story to go to your link
Next Story could give you a good indication of when a story is too long. For example, if your viewers start to click on Next Story after your fifth slide, you know that they prefer stories with five or fewer slides.
Engagement
As said before, engagement is one of the most important Instagram Story metrics, as it shows you how people are interacting with your stories. The different ways mentioned above are actually the best ways to measure engagement. Actions, such as Taps Forward or Backward, show a high level of engagement, as the users are making the move to either consume more of your content or go back and view it again.
However, you should be mindful that these may not mean your stories are entirely doing good or bad. There are several factors to consider, and it is best to analyze these metrics in tandem with each other.
For example, you may have a high number of Taps Forward but also a high number of Exits (aside from the last slide). In this case, it's possible that people found your story interesting but didn't have the time to finish it. Another example is when your story has a low number of Taps Forward but a high number of Taps Backward. In this instance, people may have found your story interesting enough to go back and view it again.
In these instances, you will need to consider the context of the story and try to optimize it for your audience. If your goal is to have more Swipe Ups, why not encourage your audience by adding reminders through texts, graphics, and GIFs? People are not going to click on your link if they don’t know that it’s there.
Just like with your photos and videos, people can comment on the different slides of your Story. Unlike other comments, however, Story Replies aren’t public, and end up in your Inbox, for your eyes only. This means that you’re likely to receive fewer replies for a Story than for the items you share in your general Instagram stream.
It is a good idea to encourage replies, however, as Instagram rewards greater engagement in its algorithm (even for Stories that sit separately at the top of the page).
A more obscure form of engagement is tapping on stickers in an Instagram Story. The total number of taps to each sticker you use in a Story is included in the Interactions section of your Insights, shows you whether the sticker gelled with your audience or whether it sank without a trace.
Additionally, you could promote your brand's upcoming events or share sneak peeks of new content with a story that engages viewers through quizzes or polls. These allow you to have a more direct interaction with viewers and get feedback that you can use to improve your content strategy.
Instagram Hashtag Stories
Using hashtags has been a great way to get more eyes on your Instagram content, and that includes Stories. When Instagram first introduced adding hashtag stickers on IG stories, many brands and influencers used them to get their stories seen by more people. Instagram users could search for specific hashtags and see all the public stories that used that hashtag.
The power of a hashtag in a story in terms of analytics is two-fold. First, it allows you to see how many views your story got from being included in the hashtag search results. Secondly, you can track which hashtags generate the most engagement for you. By monitoring how many sticker taps your story got, you can see the number of times people interacted with your story.
This information is valuable because it allows you to adjust your content strategy accordingly. If you notice that a certain type of Instagram story performs well with a certain hashtag, you can make more content like that. On the other hand, if you see that a hashtag isn’t generating much engagement, you can ditch it and try something else.
Overall Statistics that May Affect Your Instagram Campaigns
You should be able to find other analytics that may help you optimize your Instagram Story posting campaigns. We recently began reviewing social media publishing platforms. Quite a few of these provide a way for you to plan and schedule your Instagram posts centrally, as well as in some cases, Stories.
The number of statistics supplied by social media management apps varies, but you should be able to pick up some useful data to improve your posting practices. Search your platform for stats relating to your best posting times (and the times you should avoid). These may also give you a guide as to how often you should create Stories, and how many slides to include in each Story.
As with most social networks, it makes sense for you to use any Instagram Stories analytics you can find. It is only by establishing your best and worst practices from the past that you can improve to create the ideal posting patterns for your Instagram Stories in the future.
Final Thoughts
As social media becomes an ever more important marketing tool, Instagram stories are an excellent way to reach many people in a short amount of time. So whether you're looking to build brand awareness or drive leads and sales, posting stories is a great way to achieve your goals.
But as with anything in social media, it's important to track your progress and ensure that you're getting the most out of your stories. That's where Instagram analytics come in. You can start by seeing our list of free Instagram analytics tools. By tracking stats and metrics, such as views, taps forward/back, exits, and replies, you can get a good idea of what's working and what's not. This enables you to fine-tune your stories strategy and ensure that your content is seen by the right people at the right time.