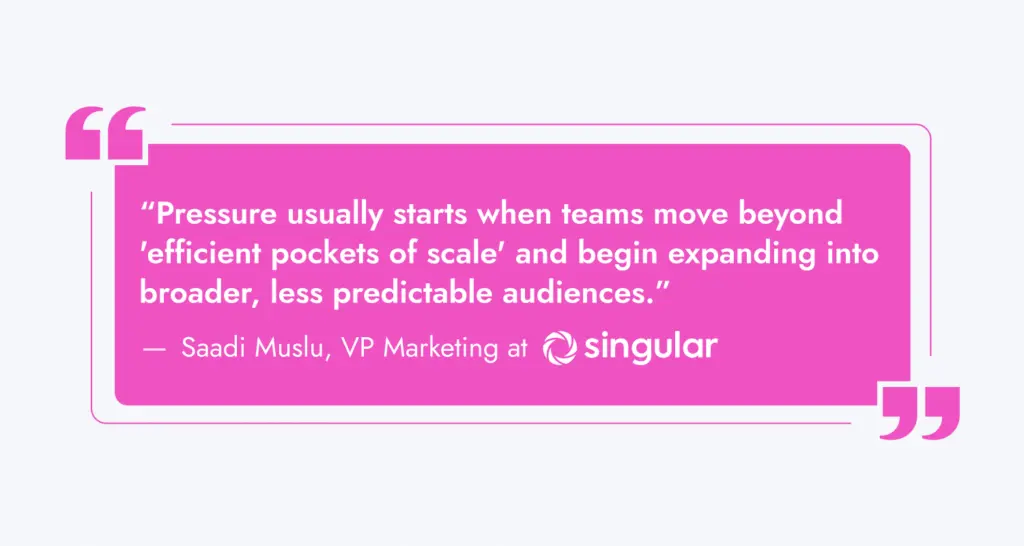
Scaling mobile acquisition is no longer just a budget question. At lower spend levels, teams can still find efficient pockets of traffic, test with more flexibility, and maintain relatively stable performance. As budgets grow, those conditions change. Auction pressure increases, audiences become harder to expand, traffic quality becomes less consistent, and performance depends more heavily on how well acquisition is controlled across channels, creatives, inventory, and optimization signals.
Developed by ROCKAPP and presented by Influencer Marketing Hub, this industry overview examines how mobile acquisition changes as budgets scale, with expert perspectives from Singular, Tenjin, Xiaomi Ads, Yango Ads, and FraudScore.
Download the Full Mobile Acquisition Report
Mobile Acquisition Under Pressure: What Changes as Budgets Grow
At lower spend levels, campaigns have more flexibility. There is room to test, adjust, and find efficient pockets of traffic. As budgets grow, that flexibility narrows.
Several things start happening at the same time:
- the same audiences are reached more frequently
- competition inside auctions intensifies
- cost per install and cost per action move up
- performance becomes less stable and more dependent on auction dynamics
This creates pressure across the entire acquisition setup.

Campaigns that delivered stable performance at lower volumes start behaving differently once budgets increase.
Scaling High-Value Users
In a high-value gambling vertical, growth cannot be evaluated through volume alone. The real challenge is acquiring users who move beyond registration and show strong deposit behavior.
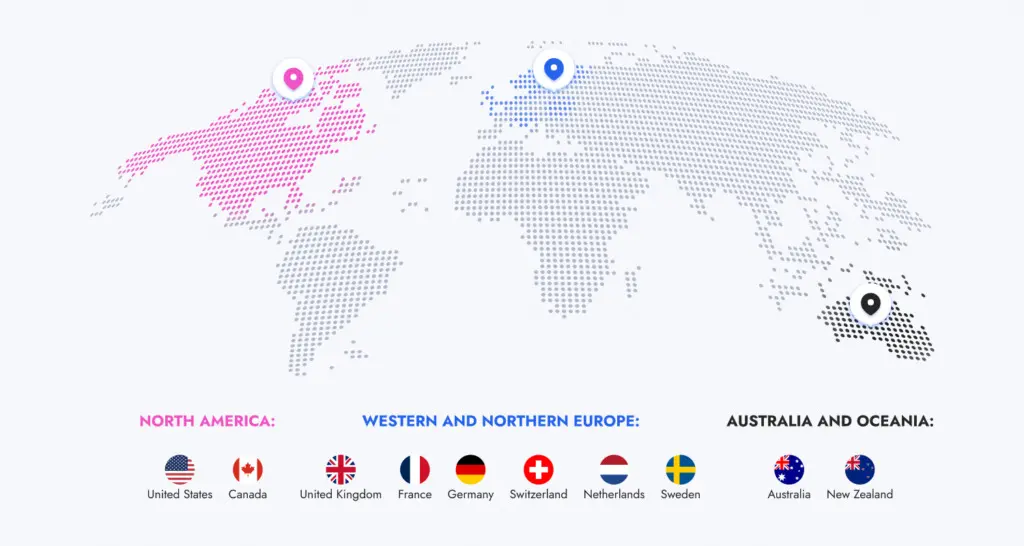
This analysis is based on social and programmatic acquisition campaigns in competitive Tier-1 GEOs, where user value is high but auction pressure is significantly stronger. The setup focused on attracting first-time depositors, maintaining deposit quality, and keeping acquisition stable as volume increased.
Acquisition was distributed across a mix of paid social and programmatic buying platforms, including Meta Ads and TikTok. Different channels played different roles inside the scaling process — some delivered stronger first-time deposit quality, while others helped expand reach and stabilize acquisition volume under higher spend.
The campaign work was built around several operational layers:
- testing multiple creative hypotheses around trust, competition, product positioning, and user motivation
- separating early volume signals from real deposit behavior
- adjusting bids based on FTD quality rather than install volume
- reallocating spend between GEOs, publishers, and traffic sources based on deposit performance
- maintaining acquisition quality while moving beyond the easiest audience segments
As spend increased, audience overlap between platforms became more visible, especially in Tier-1 GEOs. This made creative rotation, bid adjustments, and source-level optimization critical for maintaining deposit quality.
The buying process required continuous monitoring of conversion quality, aggressive creative iteration, and precise traffic control. At higher budgets, scaling depended less on adding volume and more on managing the balance between reach, competition, and user value.
The result:
- 1,400+ first-time depositors
- average deposit above €400
- stable acquisition in competitive GEOs
This shows that in high-value gambling, performance depends on the quality of acquired users, not only on acquisition volume. Strong results come from aligning traffic sources, creative positioning, bidding logic, and deposit value.
Paid Social Under Pressure
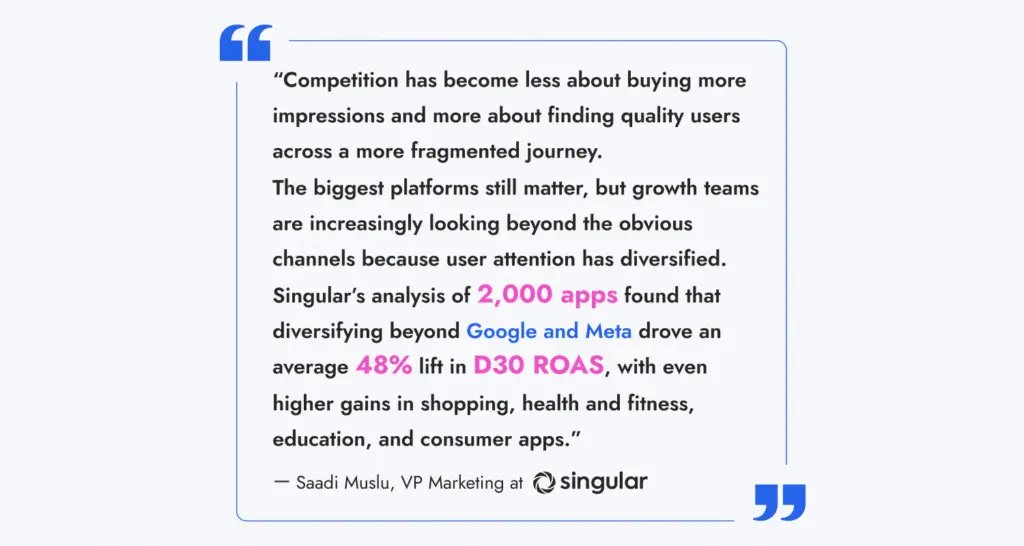
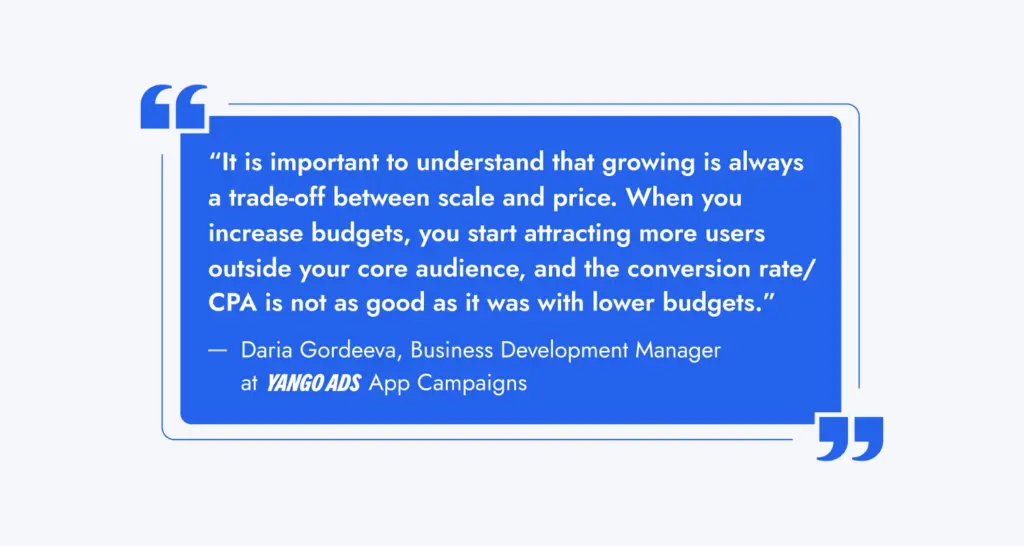
Paid social remains one of the main engines of mobile acquisition because it offers scale, mature optimization, and access to large audiences. But as budgets increase, the same strengths can turn into constraints. Larger platforms concentrate competition, especially in Tier-1 markets, and incremental spend often starts reaching users who are less responsive than the original core audience.
This is where acquisition starts shifting from channel selection to portfolio management. The goal is no longer only to increase spend on the strongest platform, but to understand where each channel fits inside the wider acquisition mix. Paid social may still provide scale and strong early signals, while programmatic and In-App inventory can help expand reach, reduce dependency on a single source, and stabilize acquisition when core channels approach capacity.
For growth teams, the practical question becomes: how much additional volume can each source deliver before cost, quality, or downstream conversion starts to weaken? That question is what connects paid social pressure to the need for In-App traffic, stronger validation, and more disciplined campaign structure.
Where Performance Starts Breaking
As campaigns grow, several pressure points become visible:
- costs increase faster than volume
- audience capacity becomes a constraint
- traffic quality becomes less consistent
- performance becomes harder to stabilize
- attribution becomes more difficult to interpret
As Tenjin puts it,
— Roman Garbar, Marketing Director at Tenjin.
Another major factor is audience overlap across channels and platforms. Users interact with multiple touchpoints throughout the funnel, which affects:
- conversion paths
- attribution accuracy
- visibility into the real contribution of each source
This makes budget allocation and performance evaluation significantly more difficult at scale.
From an operational perspective, these challenges appear across both social and In-App environments and require:
- tighter traffic control
- stronger creative iteration
- more structured optimization
- clearer validation signals
- more stable decision-making frameworks
As acquisition systems grow, performance depends less on expanding volume and more on maintaining control under increasing complexity.
To identify early signs of instability under scale, download the full report to see the Performance Shift Signals Checklist.
Get the Performance Shift Signals Checklist
In-App Traffic as a Growth Layer
Role of In-App in the Acquisition Mix
In-App traffic works as an additional inventory layer inside the acquisition mix rather than a standalone growth driver.
Its role is to:
- expand available inventory
- support volume growth
- diversify traffic sources
“In-App traffic adds incremental volume, diversifies acquisition risk, and creates additional user touchpoints at the device level.”
— Xiaomi Ads.
In practice, In-App performs best when integrated into a broader acquisition setup rather than used in isolation.
Where In-App Works Best
In-App traffic is most effective when it supports an acquisition system that already has a stable base. It works particularly well when core channels are close to capacity, the product has clear market positioning, and the team has enough event data to optimize beyond installs.
The strongest use cases are usually products with clear funnels and measurable downstream actions, such as purchases, deposits, payments, registrations, subscriptions, or retention events. In these setups, In-App can help unlock additional volume without forcing the team to rely too heavily on one paid social platform or one acquisition source.
However, In-App is not a shortcut for weak monetization or poor tracking. Results tend to be less stable when the product has unclear conversion intent, generic creatives, limited event data, or passive campaign management. Without proper optimization goals and publisher-level control, In-App can increase volume while weakening overall traffic quality.
Unlocking Scale in In-App with Strong Unit Economics
In retail-focused acquisition, scaling becomes difficult once install growth stops translating into purchases. The main objective in this setup was increasing purchase volume while maintaining strong unit economics across the funnel.
The campaign was built around In-App acquisition using Unity Ads, Mintegral, Liftoff, Moloco, Kayzen and ironSource inventory. Instead of optimizing toward installs, the setup focused on first purchase signals from the beginning, allowing the algorithms to prioritize users with stronger buying intent.
Different traffic sources were used for different scaling objectives. Some delivered stronger conversion efficiency, while others expanded available inventory and stabilized volume growth during higher spending periods.
The operational focus included:
- optimizing campaigns toward purchase events rather than install volume
- testing multiple creative concepts around product value, urgency, and shopping behavior
- separating low-cost traffic from high-conversion traffic
- controlling publisher app quality through continuous filtering and source-level adjustments
- monitoring conversion consistency between installs, purchases, and long-term ROAS
As acquisition volume increased, the main challenge shifted toward maintaining purchase efficiency under broader reach. Higher budgets expanded traffic access, but also introduced more inconsistent conversion behavior across publishers and audience segments.
To maintain stable performance, the buying process required continuous creative refreshes, bid adjustments, and publisher-level optimization. The strongest results came from aligning optimization signals with real purchase behavior rather than relying on install metrics alone.
The result:
- 10,000+ purchases per month
- install-to-purchase conversion rate above 40%
- D30 ROAS reaching 480–520%
- long-term ROAS exceeding 2000%
This shows that In-App scaling becomes significantly more efficient when optimization is aligned with downstream revenue events rather than top-of-funnel acquisition metrics.
Campaign Structure in In-App
GEO Selection
GEO selection in In-App comes down to a mix of cost, competition, and product economics.
There’s no universal “best GEO”. The same setup can perform very differently depending on how competitive the auction is and how well the product converts in a specific market.
Teams usually test several GEOs at once and look at early signals: CPI, conversion rate, and the first meaningful events.
Once spend increases, testing stops being the priority. The focus moves to managing efficiency and available volume across the GEOs that already show stable results.
In Tier-1 markets, higher costs only work if conversion and monetization are strong enough to support them. Tier-2 and emerging markets offer cheaper inventory and more room for volume, but quality tends to fluctuate more.
Publisher App Control
In-App campaigns run across a large number of publisher apps, and performance can vary significantly between them.
Managing this effectively comes down to a structured filtering process:
| Stage | What happens | Key signals |
| Launch | Campaigns start with broad inventory to gather initial data | Volume, CPI |
| Evaluation | Apps are reviewed based on early performance | Conversion rate, early events |
| Filtering | Low-performing apps are excluded | Weak CR, poor post-install behavior |
| Prioritization | Strong apps are isolated and pushed further | Stable conversions, better LTV signals |
| Refinement | Lists are continuously updated as new data comes in | Performance consistency |
| Optimization Expansion | Once enough data is accumulated, additional campaigns can be launched with optimization goals such as CPA, ROAS, or retention | Event density, signal stability |
What matters in practice:
- Performance differences between apps can be significant
- Early filtering and bid adjustments directly impact overall results
- Whitelists and blacklists evolve continuously
- Bid differentiation across publisher apps becomes a key control mechanism
- With sufficient data, optimization campaigns allow algorithms to take over part of the decision-making
- Traffic becomes more predictable over time with proper control
— Daria Gordeeva, Business Development Manager at Yango Ads App Campaigns.
Download full report to see the Audience Segmentation Checklist for the main targeting and filtering principles used in large-scale In-App acquisition setups.
Download the Audience Segmentation Checklist
Creative Strategy and Refresh Cycle
Creative performance directly shapes how In-App campaigns behave.
At launch, teams test multiple creative concepts aligned with the product and funnel. The goal is to quickly identify which angles drive engagement and early conversion signals.
Once initial results appear, the focus shifts to iteration. Top-performing concepts are expanded, elements are recombined, and new variations are introduced on a regular basis.
As campaigns grow, the lifecycle of each creative becomes shorter.
The same audience is exposed to creatives more frequently, which leads to declining engagement over time. CTR drops, conversion weakens, and acquisition costs start to increase.
— Roman Garbar, Marketing Director at Tenjin.
In this environment, creative production becomes continuous.
— Daria Gordeeva, Business Development Manager at Yango Ads App Campaigns.
Instead of isolated testing cycles, teams maintain an ongoing pipeline of new assets, replacing underperforming creatives as soon as performance starts to shift.
The required creative volume varies significantly depending on the product, vertical, and budget level.
Some high-efficiency setups operate with a limited number of creatives and stable performance, while others require a constant flow of new variations to maintain delivery and engagement.
What matters is not the absolute number of creatives, but the ability to sustain performance through consistent iteration and timely refresh.
Optimization Models
In-App campaigns rely on different optimization models depending on the stage of the campaign and the amount of available data.
At the early stage, broader models such as CPI are often used to gather initial volume. As more data becomes available, campaigns typically move toward CPA-based optimization, and then shift further toward value-based models such as ROAS, focusing on revenue-generating events.
The timing of this transition depends on signal density. Moving too early limits volume, while moving too late affects efficiency.
In practice, stable performance comes from aligning the optimization event with the product’s monetization model and ensuring enough data for the algorithm to learn.
Funnel Structure
The conversion funnel in In-App campaigns depends on the product and vertical, but the underlying logic remains consistent.
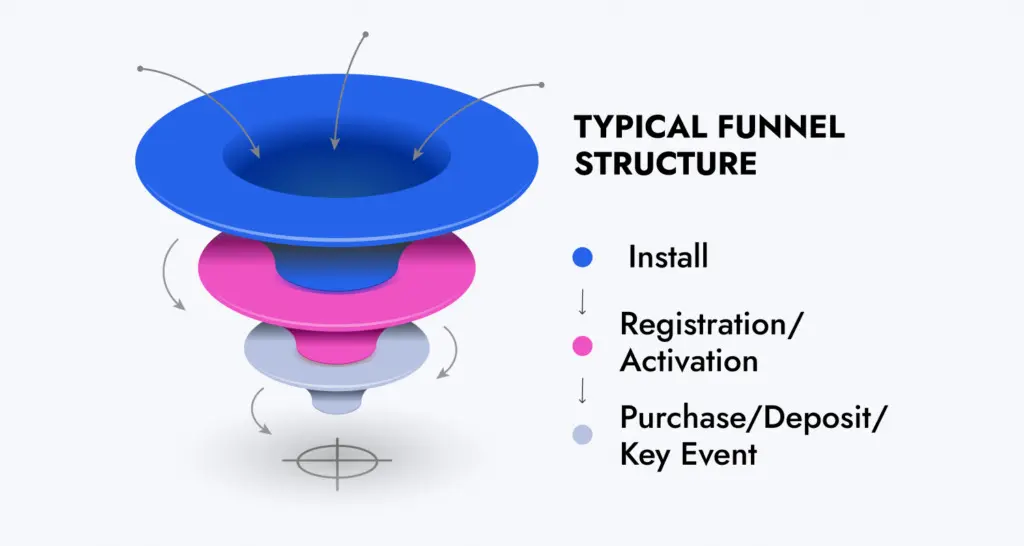
Performance is shaped by the full funnel rather than a single step. A strong CPI with weak downstream conversion leads to poor overall economics, while stable conversion across stages allows campaigns to sustain higher costs.
This is why funnel analysis plays a central role in evaluating traffic quality.
Growth Approach
Increasing volume in In-App campaigns requires coordinated changes across multiple variables.
As budgets grow, acquisition becomes more complex. Teams need to expand beyond a single channel, increase creative output, and rely on stronger data signals to maintain performance.
Growth usually comes from a combination of budget increases, bid adjustments, expansion of creative volume, and access to additional inventory.
At the same time, campaign stability becomes more sensitive to change.
Large or abrupt adjustments can disrupt algorithm performance, leading to higher costs and inconsistent delivery. Another common issue is overestimating audience capacity, which results in increased competition within the same inventory and pushes acquisition costs up.
As budgets grow, managing volume becomes less about pushing spend and more about controlling how that spend is distributed across the system.
To review the most common structural mistakes that weaken acquisition performance at scale, download the full report to see the Failure Patterns Checklist.
Get the Failure Patterns Checklist
Rapid Volume Growth Without Losing Quality
In a mobile product focused on transportation services, rapid growth creates pressure on both traffic quality and CPA stability. The objective in this setup was increasing acquisition volume quickly while maintaining consistent user quality and keeping performance under control.
The campaign was built around In-App traffic using Unity Ads, Mintegral, and ironSource inventory. Instead of relying on aggressive budget expansion alone, the buying strategy focused on controlled scaling through inventory diversification, bid adjustments, and creative iteration.
The setup included several operational layers:
- expanding reach gradually across multiple publisher segments
- separating high-volume inventory from high-quality inventory
- monitoring post-install behavior instead of relying only on CPI
- adjusting bids based on downstream conversion quality
- rotating creatives continuously to avoid rapid fatigue during growth periods
As volume increased, the main challenge shifted toward maintaining consistency across traffic sources. Some publisher groups scaled faster but produced weaker downstream behavior, while others delivered smaller volume with stronger user quality signals.
To stabilize performance, the campaigns required continuous source-level optimization, active publisher filtering, and careful traffic redistribution between inventory pools. Growth depended on maintaining balance between expansion speed and conversion stability rather than pushing budgets aggressively.
Within a short period:
- volume increased 2x within 2 days
- share of high-quality users grew by 50%
- CPA remained stable at ~$29
The campaign also ranked among the top-performing traffic sources inside the MMP quality evaluation framework, showing strong post-install user behavior despite rapid growth.
This highlights that fast acquisition growth depends on operational control, traffic quality management, and stable optimization logic rather than budget pressure alone.
Anti-Fraud and Analytics
Traffic Quality Risks
As acquisition volumes grow, differences in traffic quality become more visible.
In-App inventory includes a wide range of publisher apps and user flows, and these differences become more visible as spend increases.
As budgets grow, traffic mix inevitably expands beyond top-tier sources. This introduces a higher share of gray traffic and lower-quality inventory, which may not be immediately visible at the install level but starts affecting downstream performance over time.
Part of the traffic may generate installs and early conversions without reflecting real user intent. While mechanisms such as click injection or install hijacking are typically detected and filtered by MMPs, attribution inconsistencies can still appear in other forms, especially at scale.
This creates a gap between reported performance and real user behavior.
CPI and volume may remain stable, while retention and monetization begin to weaken.
Attribution and Traffic Quality Red Flags
FraudScore data highlights several recurring signals:
- Installs increase, but downstream events do not scale proportionally
- Extremely low CPI combined with weak retention
- Sudden spikes in installs without changes in budget, bids, or creatives
- High last-click attribution with low engagement signals
- Unnaturally short or overly consistent conversion lag
- Install spikes during unusual hours
- Data discrepancies between MMP, BI, and internal analytics
- Revenue does not match platform-reported performance
High-Intent Traffic in Fintech
In Fintech acquisition, traffic quality has a direct impact on approval rates, payment behavior, and long-term profitability. The main challenge in this setup was attracting users capable of completing meaningful financial actions rather than generating low-cost install volume.
The campaigns were built across a mix of paid social and In-App traffic sources, with optimization focused on first payment events and downstream validation signals instead of installs alone.
The acquisition process included several operational layers:
- separating high-volume traffic from high-intent traffic
- optimizing campaigns toward verified payment actions
- filtering inventory and publisher apps based on post-install quality
- monitoring discrepancies between platform metrics and CRM validation
- testing creative concepts around trust, financial utility, and user intent
As spending increased, maintaining traffic quality became significantly more difficult. Broader reach introduced more inconsistent user behavior, while low-cost inventory often generated weaker payment validation and lower long-term value.
To stabilize performance, the campaigns required continuous traffic filtering, source-level optimization, and close alignment between acquisition data and internal CRM signals. Validation became a central part of the buying process rather than a post-campaign analysis layer.
The result:
- 2,000+ first payments per month
- install-to-payment conversion rate above 7%
- stable validation through CRM data
- suspicious traffic share below 10%
This shows that in fintech acquisition, performance depends on the ability to validate real user intent across the funnel rather than optimize around top-level acquisition metrics alone.
Retargeting
Retargeting as a Performance Lever
A significant share of users drops off before completing key actions. Instead of relying only on new acquisition, retargeting focuses on users who already showed intent but did not convert.
In practice, retargeting becomes less about “bringing users back” and more about improving the efficiency of the entire acquisition system.
Retargeting as a Revenue Driver in iGaming
In iGaming products with multi-step conversion funnels, a large share of users drops off before completing the first deposit. As acquisition volume grows, this gap becomes more expensive, especially in competitive GEOs where new-user acquisition costs continue increasing.
In this setup, the focus shifted from expanding acquisition volume to improving conversion efficiency inside the existing funnel. Instead of treating retargeting as a secondary layer, it became part of the core revenue strategy.
The campaigns were built across retargeting-focused traffic sources and behavioral audience segments, with optimization centered around first-time deposit events and short conversion windows.
The operational work included:
- segmenting users based on funnel stage and behavioral signals
- separating registration drop-offs from inactive depositing users
- testing retargeting creatives around urgency, re-engagement, and offer positioning
- prioritizing high-intent audiences with stronger deposit probability
- optimizing delivery around D0–D1 conversion windows
As campaigns expanded, the main challenge became maintaining conversion efficiency without oversaturating existing audiences. Different audience pools reacted differently to retargeting pressure, requiring continuous frequency control, creative refreshes, and audience redistribution.
Performance analysis focused not only on conversion volume, but on how retargeting affected the overall acquisition system. The strongest impact came from reconnecting with users already inside the funnel rather than continuously replacing them with new acquisition traffic.
The result:
- 6,000+ first-time deposits per month
- strong conversion within D0–D1 windows
- noticeable uplift from the retargeting layer
This shows that in high-volume iGaming acquisition, retargeting can become a major revenue driver when campaigns are aligned with user behavior, funnel timing, and deposit intent rather than simple re-engagement metrics.
Market Benchmarks
Performance Benchmarks in Practice
Performance in In-App campaigns varies significantly depending on vertical, GEO, product setup, and funnel structure.
There are no universal benchmark ranges that apply across all acquisition systems. The same CPI or conversion rate can indicate either strong or weak performance depending on downstream user behavior and unit economics.
Singular’s Q2 2026 Quarterly Trends Report makes this clear:
At the same time, industry benchmarks provide useful reference points.
According to AppsFlyer benchmarks, metrics such as CPI, retention, and conversion rates differ significantly across verticals and regions. Acquisition costs in highly competitive categories such as fintech and iGaming can vary multiple times across GEOs and platforms, making direct comparison between campaigns unreliable.
A low CPI does not automatically indicate efficient acquisition if user quality is weak. Higher acquisition costs can still produce stronger business results when supported by stable retention, payer behavior, and long-term ROAS.
In practice, teams rely more on internal comparisons across sources, creatives, audience segments, and funnel performance than on external benchmark averages.
Key Metrics That Matter
In-App performance is evaluated across multiple levels of the funnel.
Install-level metrics such as CPI and click-to-install rate provide initial signals about traffic quality and creative performance. However, they do not reflect the full picture.
Deeper funnel metrics — including install-to-registration, install-to-purchase, payer rate, revenue, and LTV - determine overall acquisition sustainability.
AppsFlyer data highlights that differences between install metrics and post-install behavior are common across mobile acquisition, especially in competitive verticals.
Because of this, evaluating performance requires looking at how these metrics align, rather than focusing on any single indicator.
What “Good Performance” Looks Like
Strong performance in In-App campaigns is defined by consistency across the funnel.
This includes stable conversion from install to key events, predictable payer behavior, and LTV that supports acquisition costs.
Exact values differ across verticals, but the pattern remains consistent.
When performance is strong, metrics reinforce each other. When it is weak, gaps between funnel stages become visible.
In practice, performance is also defined by how quickly these results are achieved.
“ROAS > 100% on day X — and X depends on your product. The other half is speed.
How fast did the campaign reach 25%/50%/75%? That’s what separates strong from acceptable.”
— Roman Garbar, Marketing Director at Tenjin.
Industry benchmarks help define the range, but real performance is determined by how well traffic, funnel, and monetization are aligned.
Practical Checklists and Diagnostic Frameworks
As acquisition systems grow more complex, teams need operational frameworks to evaluate scaling readiness, traffic quality, and performance stability.
The full report includes practical checklists and diagnostic frameworks designed to help acquisition teams identify recurring failure patterns, recognize early warning signs, validate traffic quality, and optimize campaigns more effectively at scale.
Unlock the Full Report and Checklists
In-App Performance Diagnostic
Why This Matters
As budgets grow, performance issues rarely come from a single factor.
In most cases, inefficiencies are structural — related to traffic mix, funnel behavior, creative strategy, and data interpretation. Without a structured review, these limitations are difficult to identify.
What the Diagnostic Covers
We run a focused In-App performance diagnostic based on your current setup and data.
The overview focuses on traffic quality, funnel behavior, creative strategy, and optimization logic, with a focus on how your acquisition performs under higher volumes.
As a result, you get a clear view of:
- where performance is lost
- how traffic quality affects outcomes
- how acquisition and monetization are aligned
- what limits further growth
The goal is to identify bottlenecks and define realistic opportunities to improve efficiency and unlock additional value.
Next Step
If your acquisition setup shows signs of instability (rising costs, inconsistent performance, or weaker downstream efficiency) — this usually signals structural pressure inside the system.
A focused diagnostic helps uncover where performance starts shifting, how traffic quality changes under scale, and which limitations affect further growth.
Request an In-App acquisition diagnostic. Complete the short form below, and the ROCKAPP team will review your acquisition setup, identify potential pressure points, and contact you with next steps.
Fill out the form to get started.
