
Influencer marketing has crossed a line.
At this year’s Super Bowl, Salesforce set its eyes on one of the world's biggest creators, MrBeast.
In the teaser released ahead of the game, MrBeast walks into Salesforce’s offices, pitches the marketing team on an idea we don’t hear, and gets approval to “do anything” in the ad as long as it’s legal and features Salesforce products. He then hints that viewers “might become a millionaire.”
@mrbeast How I Made a Super Bowl Ad w/ @Salesforce #ad
That is textbook brand betting on using a creator’s format, audience, and storytelling logic. With 30-second spots reportedly selling between $7 million and $10 million, this was prime-time, high-stakes media.
And that is where influencer marketing sits in 2026.
Creators are becoming central to major marketing campaigns. Not just as faces, but as formats. As distribution engines. As cultural anchors.
But as visibility increases, so does pressure.
Budgets are rising. Expectations are tightening. Measurement conversations are getting sharper. Scaling influencer marketing is no longer about finding a few good creators. It is about building an operating system that can handle cost, credibility, and performance scrutiny at scale.
This report is built from the marketers navigating that shift in real time. It reflects how they are planning spend, defining success, choosing platforms, reshaping creator tiers, and integrating AI into workflows as influencer marketing moves from an emerging channel to core growth lever.
- Letter from the Editors
- Research Methodology
- Executive Summary
- Platform Investment Intentions
- Platform Choices by Budget Intent Show a “Single-Platform Bet” Market; TikTok Dominates the Bet
- Budget Expectations for 2026: Intent Is Overwhelmingly Expansionary
- A Scaling Warning: Is Your Measurement Growing as Fast as Your Budget?
- Expected Payback Period vs. Influencer Budget Change
- Creator Tier Mix Is Shifting Down-Market (Nano/Micro Up, Macro/Celeb Mostly Flat)
- Social Commerce Adoption and Testing Plans
- Content Format Effectiveness Rankings
- Measurement Tool Adoption Shifts With Budget Intent
- Influencer Marketing Functions Most Commonly Outsourced to Agencies
- Influencer Fraud and Quality Risks
- Current AI Applications in Influencer Marketing
- Influencer Marketing Challenges
- Leading Influencer Marketing Focus Areas
- Influencer Marketing Ownership and Operating Model
- KPI Priorities Shift Upward as Budgets Rise
Letter from the Editors
Influencer marketing is entering 2026 with a contradiction that every marketer will recognize: budgets are set to expand quickly, while the operational realities of execution—creator costs, authenticity risk, and measurement friction—are not getting easier.
This benchmark report is designed to give you something more useful than trend commentary: a set of quantified signals you can use to pressure-test your 2026 plan.
Across the survey, 600+ respondents report aggressive budget expansion and short payback expectations, paired with concentrated platform bets, a continued shift toward nano/micro and UGC-driven production, and clear priorities around AI-enabled scaling and social commerce.
The takeaway is not “do more influencer marketing.” The takeaway is that 2026 rewards teams that treat influencers as an operating system: clear platform roles, repeatable creative iteration, defensible measurement design, and quality controls that scale with volume.
Use this report to benchmark your decisions. If your strategy differs from the dominant patterns here, that’s not automatically wrong—but it should be an intentional choice with a defined rationale.
Research Methodology
This report summarizes findings from a 2026 influencer marketing survey fielded to marketing professionals. Results are presented as benchmarks of intent, adoption, and operating posture, based on respondent selections to structured questions.
Key methodology notes to use in the report:
- Question-level denominators: Not every respondent answered every question. Percentages are calculated among respondents who answered that question.
- Multi-select questions: Some questions allow multiple selections (e.g., platforms, KPIs, measurement tools). In those cases, results reflect selection incidence, not spend share or exclusivity.
- Ranking questions: Content format effectiveness is derived from respondent rankings and reported using Top-1 share, Top-3 breadth, and average rank to separate “hero formats” from broadly effective formats.
Confidence and Limitations
- Intent vs outcome: Many questions measure planned behavior (budget changes, platform plans). Intent does not guarantee execution.
- Multi-select inflation: In multi-select questions, totals can exceed 100% across options because respondents may choose multiple items.
- No causal claims: Findings show associations (e.g., budget increases correlating with different KPI stacks), not proof of cause and effect.
- Context dependency: Some effectiveness findings (e.g., live shopping) are category- and maturity-dependent; the benchmark reflects consensus and polarization patterns, not universal rules.
Executive Summary
What This 2026 Survey Benchmark Covers
The survey supports benchmarking of:
- Influencer budget expectations and expected payback horizons
- Program ownership models (in-house vs agency)
- KPI selection and measurement tool adoption
- Platform investment intentions
- Content format effectiveness rankings
- Social commerce adoption and testing plans
- AI usage across the influencer workflow
- Outsourcing patterns and fraud/quality risks
- Top challenges and leading focus areas for 2026
Key Findings
These highlights summarize the strongest signals among respondents who answered each question:
- Budget intent is overwhelmingly expansionary. Among those answering, 72.2% expect budgets to increase 50%+.
- Payback expectations are short. Among those answering, 65.9% expect payback within 1 month, including 48.4% within 2 weeks.
- Influencer is primarily owned in-house. Among those answering, 66.3% report running programs entirely in-house.
- Success is defined more by upper-funnel impact than direct revenue. Brand awareness is the most selected KPI (reported as 55.1% of those answering in your summary), while revenue/sales KPIs are selected less frequently.
- Measurement is present, but scaling may be outrunning instrumentation. Promo/discount codes lead adoption (45.9% of those answering), followed by affiliate links (26.0%) and native shop features (25.0%). The strongest budget scalers slightly under-index on measurement-tool breadth relative to their share of planned budget growth.
- Platform focus is concentrated. TikTok is the most frequently selected platform for investment intent, with the market behaving like a “single primary platform bet” environment.
- Video is the dominant effective format; live shopping is high-upside but low-consensus. Short-form and long-form video lead clearly; live shopping ranks third but appears polarized by context.
- Social commerce is not universal—but where it exists, it’s TikTok-first. TikTok Shop is the most selected social commerce feature; adoption is higher among brands increasing budgets.
- AI adoption is operational. AI is most used for creator discovery; AI is most frequently used for creator discovery; “not using AI” is selected by 10.56%.
Platform Investment Intentions
TikTok is the clear focal point for influencer investment heading into 2026.
In this year’s survey, 31% of respondents included TikTok in their influencer plans, making it the most frequently selected platform for investment intent. After TikTok, selection incidence drops sharply, with every other platform clustering in a narrow band—roughly 8-15%, which signals a market that’s making deliberate, selective bets rather than spreading budgets across many channels.
That pattern shows up not only in the headline platform ranking, but also in how concentrated platform selection is overall. Respondents could select multiple platforms, so these figures reflect selection incidence (who included each platform in their plans), not relative spend share or exclusivity.
Even with multi-select allowed, total selections remained relatively close to the number of respondents, reinforcing that most teams are prioritizing a primary platform rather than taking a broad “test everywhere” approach.
What Marketers Should Take From This
When investment is concentrated, execution discipline matters more than channel expansion. If TikTok is your primary growth and experimentation platform, the goal isn’t simply to “do more TikTok.”
The goal is to build a repeatable TikTok operating system, creator sourcing, creative testing, amplification, measurement, and iteration, so additional spend translates into performance rather than noise.
Meanwhile, Instagram, YouTube, and Facebook sit in secondary or supporting roles for most programs. That doesn’t mean they’re unimportant. It means that, in 2026, many brands appear to be treating them as:
- Stabilizers (steady reach and consistent creator formats),
- Coverage channels (supporting the core platform with repurposed creative and creator partnerships), and/or
- Conversion assist layers (reinforcing credibility, retargeting, and downstream behavior rather than acting as the main experimentation engine).
The 2026 Platform Priority Stack
Across the main platform ranking, the selection order is:
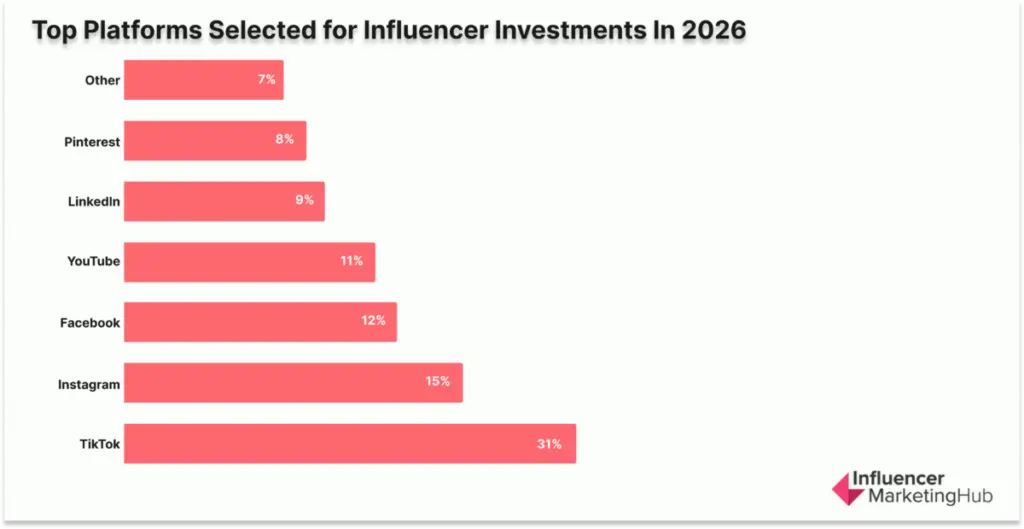
The gap is the story. TikTok’s selection incidence is more than double Instagram’s and roughly triple LinkedIn’s, indicating that most brands are not planning broad multi-channel expansion.
Instead, they are consolidating around a single dominant platform for experimentation and growth, with the rest of the mix supporting defined roles inside the program.
What To Do Next (Practical Planning)?
If your 2026 plan mirrors this concentration pattern, use it to your advantage:
- Name your “primary platform” explicitly. If TikTok is the growth engine, plan around TikTok-native creative cycles and creator volume, not around cross-posting.
- Assign clear roles to secondary platforms. Decide whether Instagram/YouTube/Facebook are there to scale proven concepts, support conversion, or extend reach—then measure them against that role.
- Avoid “multi-channel” as a strategy by default. The survey data suggests most teams aren’t spreading bets widely. A tighter platform focus typically requires stronger creative testing and clearer measurement discipline to justify the concentration.
Platform Choices by Budget Intent Show a “Single-Platform Bet” Market; TikTok Dominates the Bet
Across every budget intent group—brands increasing spend, cutting spend, testing for the first time, or holding steady—platform selection stays tightly concentrated.
Incidence totals cluster around ~100% per segment, which implies most brands are effectively committing to one primary platform rather than spreading influencer effort across a broad mix.
This matters operationally: teams planning for 2026 should assume that competitor brands are not “everywhere.” They are placing one focused platform bet, building creative systems and creator rosters for that platform, and only then layering secondary channels if there is clear incremental value.
TikTok Is the Primary Entry Platform and the Last Platform Brands Want to Drop
TikTok is the highest-incidence platform among brands increasing investment (32%) and those testing influencer marketing (31%). More telling: TikTok is also highest among brands planning to decrease investment (39%).
That combination points to TikTok functioning as the default performance-and-experimentation arena—the platform brands want to keep even when budgets tighten.
For marketers, the implication is not just “use TikTok,” but that TikTok is where peers will concentrate:
- Creative testing volume,
- Creator diversification,
- And the fastest iteration cycles (brief → publish → learn → adjust).
If the market is making one-platform bets, TikTok is the platform most likely to receive that bet.
Instagram Is the Scaling Layer, Not the Experimentation Layer
Instagram’s incidence rises most clearly among brands increasing investment (20%), but is lower for first-time testers (13%) and especially low among reducers (6%).
This looks like Instagram is playing a secondary scaling role: once a brand has working creator messaging and a repeatable production workflow, Instagram is where that playbook gets expanded, often with more controlled brand presentation, repurposed short-form, and steadier content cadence.
Marketer Takeaway:
Treat Instagram as the channel for systematizing what already works, not as the first place to discover what works.
YouTube and Facebook Indicate “Durability,” but for Different Reasons
YouTube remains present across Increase (15%), Testing (17%), and Decrease (19%), suggesting it functions as a consistent consideration when brands are committed to influencer activity at all.
Facebook’s higher incidence in Decrease (23%) and No plans (19%) suggests it’s more often treated as a supporting or efficiency channel rather than a growth engine.
The strategic takeaway is that “middle tier” doesn’t mean “unimportant.” It means these platforms may be selected when the brand’s goal shifts from experimentation to asset longevity (YouTube) or efficient reach/retention support (Facebook).
LinkedIn, Pinterest, and “Other” Remain Niche—But Spike When Budgets Aren’t Expanding
LinkedIn (15%), Pinterest (12%), and Other (17%) are most pronounced in the “No plans to invest” segment.
That pattern suggests these platforms are more likely to be selected for specific audience-fit reasons rather than broad budget expansion.
For marketers, this is a cue to treat them as precision channels—where the decision to invest should be justified by audience behavior and category fit, not by trend momentum.
What This Means for 2026 Planning (Practical Actions):
- Plan around one primary platform. The market is signaling operational focus, not multi-platform breadth.
- If scaling budgets: build the growth engine on TikTok, then use Instagram to operationalize and extend your winning strategy.
- If testing for the first time: TikTok is the most common entry bet, with YouTube frequently co-considered—so measurement and creative iteration need to be designed for fast learning.
- If reducing budgets: the pattern suggests consolidation, not abandonment—keep the platform(s) most likely to deliver learning velocity and/or durable assets, and cut fragmented experimentation.
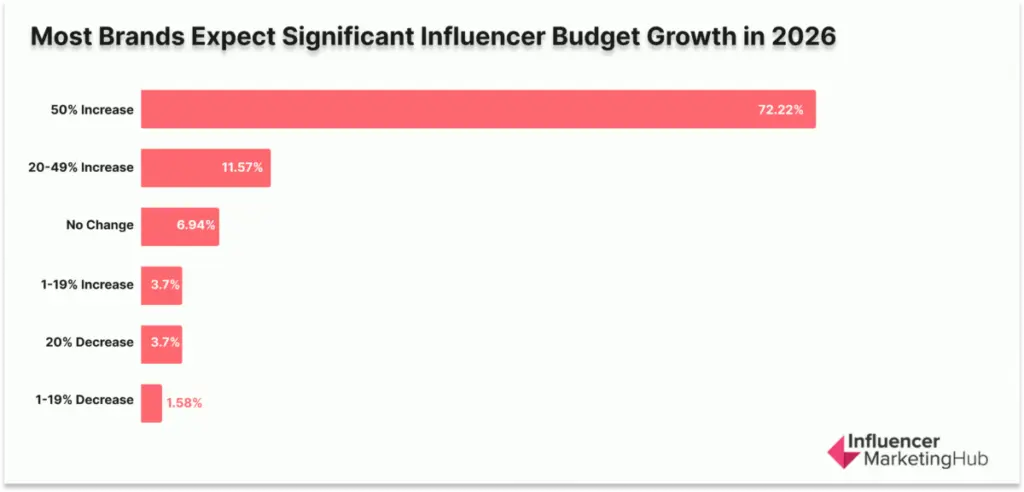
Budget Expectations for 2026: Intent Is Overwhelmingly Expansionary
Influencer marketing enters 2026 with a rare kind of signal: not “steady growth,” but aggressive planned acceleration. Across respondents to this question about influencer marketing budget allocation in 2026, 87.49% expect their influencer marketing budget to increase, while only 5.55% expect a decrease.
The dominant response is a step-change investment:
72.22% of respondents expect their influencer budget to increase by 50%+.
Here’s the distribution reported in the survey:
What This Means in Practice (And What It Doesn’t)
This is a confidence indicator first, and an execution indicator second.
A large majority planning “50%+” increases signals that influencer marketing is being treated less like an experimental line item and more like a growth lever that marketing teams believe can absorb more capital.
But it’s also critical to treat this as a planned investment, not confirmed performance. Intent can move faster than organizational readiness.
The Operational Implication: Your Bottleneck Will Shift
When spend rises this fast, performance often stops being limited by “finding good creators” and starts being limited by your operating system:
- The speed of creative iteration (brief → content → approvals → posting → reuse)
- Your ability to repurpose content into paid, web, and lifecycle channels
- Rights management, whitelisting, and compliance workflow
- The consistency of tracking hygiene (UTMs, promo codes, landing pages, tagging)
If you don’t rebuild the system as you’re scaling, bigger budgets typically just buy more variability.
A Scaling Warning: Is Your Measurement Growing as Fast as Your Budget?
Here’s something you should pause on.
In our survey:
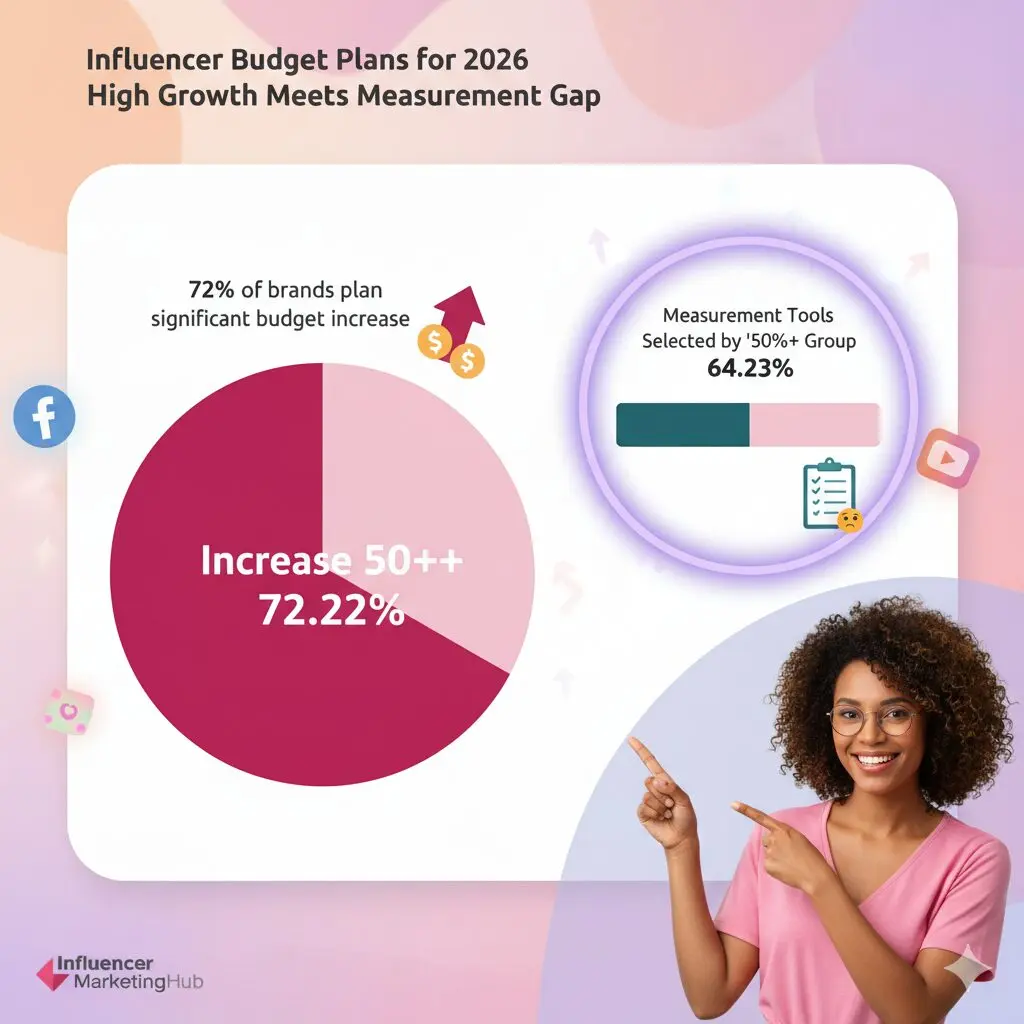
- 72.22% of respondents plan to increase influencer budgets by 50%+ in 2026.
- But when we look at the measurement adoption cross-tab, that same “Increase 50%+” group accounts for only 64.23% of total measurement-tool selections.
That gap matters.
If nearly three-quarters of the market is planning aggressive budget expansion, you would expect that same group to dominate measurement tool usage at a similar rate. Instead, they slightly under-index.
Now look at the opposite pattern:
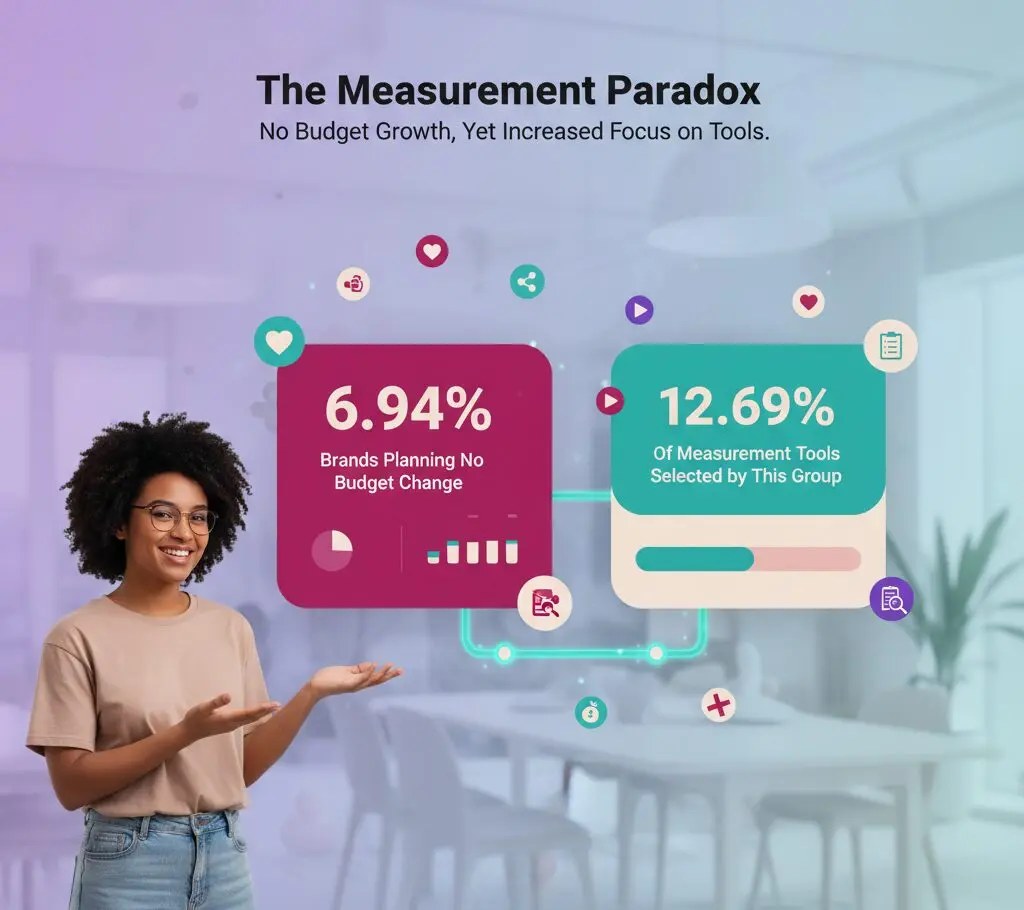
- Brands planning no budget change represent just 6.94% of respondents.
- Yet they account for 12.69% of total measurement-tool selections.
In Other Words:
The flat-budget group is proportionally heavier on instrumentation than their share of the sample would suggest.
What to Do Next: A Scaling Checklist You Can Use Before Budgets Expand
If you’re planning any meaningful increase—especially 20%+—treat the next planning cycle as an operating-system upgrade, not a creator-volume exercise.
- Convert “increase intent” into an operating plan. Define WHAT you will scale: creator volume, content volume per creator, paid amplification, or usage rights. Pick the primary lever so the team isn’t trying to scale four things at once.
- Lock KPI definitions before spend rises. Decide what counts as success at the leadership level (the KPI you’ll defend) and what you optimize weekly (the KPI you steer with). Keep those distinct.
- Standardize tracking hygiene. Establish one convention for UTMs, promo codes, landing page routing, and post tagging so reporting doesn’t degrade as volume increases.
- Build reuse into the workflow. Make repurposing (ads, PDP/site UGC, email, landing pages) a default output, not an afterthought—because reuse is often what turns “content spend” into scalable performance.
- Set a governance rhythm. Define how often you review creators, creative themes, and performance signals—and what triggers scale, hold, or cut decisions.
The Practical Question You Should Ask Right Now:
If your 2026 plan includes a 50%+ increase, ask: What changed in my measurement infrastructure that justifies that scale?
If the honest answer is “nothing major,” then you’ve identified your next priority.
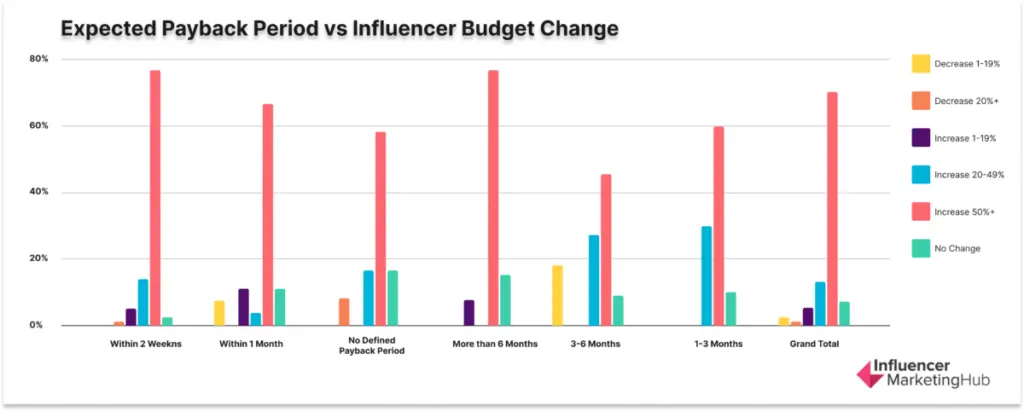
Expected Payback Period vs. Influencer Budget Change
This cut shows how payback expectations (how quickly teams expect influencer activity to “return” value) map to budget intent (how aggressively they plan to increase or decrease influencer spend).
The pattern is less about “short vs. long payback” and more about how teams operationalize accountability when they scale.
What the Data Is Really Saying
1) Bigger 2026 Budget Bets Aren’t Tied to “Fast Payback Only.”
Across the whole sample, the dominant posture is still aggressive growth (70.20% plan to increase 50%+, with another 13.25% planning +20–49%). That dominance shows up inside multiple payback expectations—not just the short-window teams.
2) Two Scaling Archetypes Show Up—And Both Are Growth-Forward.
- Performance-sprint scalers (Within 2 weeks): This group is overwhelmingly expansion-oriented (76.92% plan +50%; 14.10% plan +20–49%). In other words, teams expecting a fast return are typically the same ones leaning in, not dabbling.
- Brand-compounding scalers (More than 6 months): This group also skews heavily toward +50% intent (76.92%), which signals a different logic: “We’re scaling because we believe outcomes compound, even if they mature later.”
3) The “Middle Horizon” Cohorts Look More Risk-Managed and Mixed.
The 1–3 month and 3–6 month expectations carry more spread into moderate growth (e.g., 1–3 months: 30.00% at +20–49%; 3–6 months: 27.27% at +20–49%) and even some contraction signals (3–6 months includes 18.18% at -1–19%). That’s what a portfolio posture looks like: still investing, but demanding clearer proof before going all-in.
4) “No Defined Payback Period” Is a Scaling Risk, Not a Neutral Answer.
Even without a defined payback period, 58.33% still plan +50% and 16.67% plan +20–49%. That combination (“scale + undefined payback”) is where teams most often feel the internal squeeze later—because leadership pressure rises faster than measurement maturity.
What This Means for Marketers
If you’re scaling budgets with a short payback expectation (2 weeks / 1 month)
You’re effectively saying: “Influencer is a performance channel.” That can work, but only if your operating model is built for it.
- Treat creators like iterable inventory (fast creative testing, fast swaps, fast redistribution).
- Standardize a tight conversion-definition (what counts as “payback” internally) so teams don’t argue after results land.
- Build an always-on system for reuse: the teams expecting fast payback are usually the ones who win by turning creator outputs into paid, retargeting, email, PDP, and marketplace assets—not by “one-and-done” posts.
TikTok and Other Platforms Allow Longer Attribution Windows (e.g., Click-Through Windows up to 28 Days, and View-Through Options), Which Means ‘No Payback in 2 Weeks’ Can Still Be a Measurement Artifact if Your Window Is Too Short.
If you’re scaling budgets with a longer payback expectation (3–6 months / 6+ months)
You’re positioning influencer as a demand-and-trust builder whose returns mature over time. That’s valid—but you need a framework that doesn’t collapse into “vibes.”
- Separate leading indicators (content velocity, saves, comment quality, product page lift, search lift) from lagging indicators (revenue, repeat purchase, CAC stabilization). This protects the program from being judged only by short-term attribution.
- Lock measurement windows and evaluation cadence before you launch major budget lifts—otherwise every stakeholder will “grade” the same program on different timelines.
Lift-Style Measurement Doesn’t Always Settle Immediately—Results Can Fluctuate After a Test Ends—So Teams Should Avoid Treating “Immediate” Readouts as Final.
If you have no defined payback period but plan to increase spend anyway
This is where to be brutally practical: define payback as a decision tool.
- Write down (internally) what payback means in your org: incremental profit, attributed revenue, new customer volume, retention lift—pick one primary.
- Create a single “investment memo” rule: every incremental budget step must map to a specific measurement horizon (even if that horizon is longer than leadership wants). Otherwise, you’ll scale without knowing what “working” means.
In Meta’s own reporting, 71% of consumers say they make a purchase within a couple of days after seeing creator content on Meta apps—supporting the idea that some creator-driven impact can be very fast when the path-to-purchase is tight.
Creator Tier Mix Is Shifting Down-Market (Nano/Micro Up, Macro/Celeb Mostly Flat)
In 2026 planning, the creator mix is moving in a clear direction: brands are expanding nano and micro usage far more aggressively than they are expanding macro or celebrity work. The highest net growth intent sits at the smallest tiers.
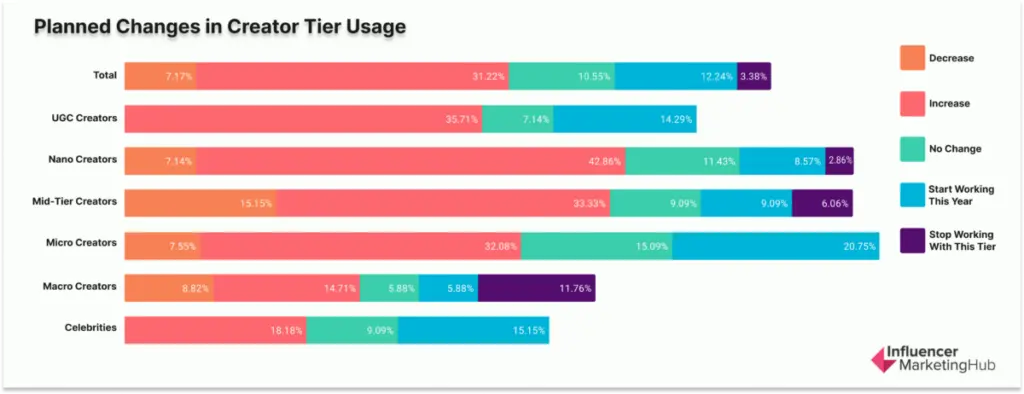
- For nano creators, 51.43% of respondents indicate expansion intent (42.86% “increase” + 8.57% “start working with this tier”), while only 10.00% indicate contraction (7.14% “decrease” + 2.86% “stop”).
- Micro creators show a similar pattern: 52.83% expansion (32.08% increase + 20.75% start), with just 7.55% reporting a decrease and 0% saying they’ll stop. UGC creators also skew strongly expansionary, with 50.00% planning growth (35.71% increase + 14.29% start) and 0% planning to reduce or stop.
- Mid-tier creators sit in the middle: there is growth, but it’s not one-way. 42.42% plan expansion (33.33% increase + 9.09% start), while 21.21% plan contraction (15.15% decrease + 6.06% stop).
- Macro creators, by contrast, read as essentially neutral: 20.59% expansion (14.71% increase + 5.88% start) is almost identical to 20.58% contraction (8.82% decrease + 11.76% stop). Celebrity data shows 33.33% expansion intent (18.18% increase + 15.15% start) and 0% contraction.
The cost-side inputs reinforce the same story.
When respondents selected cost ranges by tier, the most frequently priced-out tiers were Nano (29.54% of all cost selections) and Micro (22.36%), far ahead of macro (4.35%) and celebrities (13.92%), with UGC lowest (5.91%).
In practical terms, this is what teams are budgeting and scenario-planning most often: not a handful of premium deals, but repeatable spend across smaller creators.
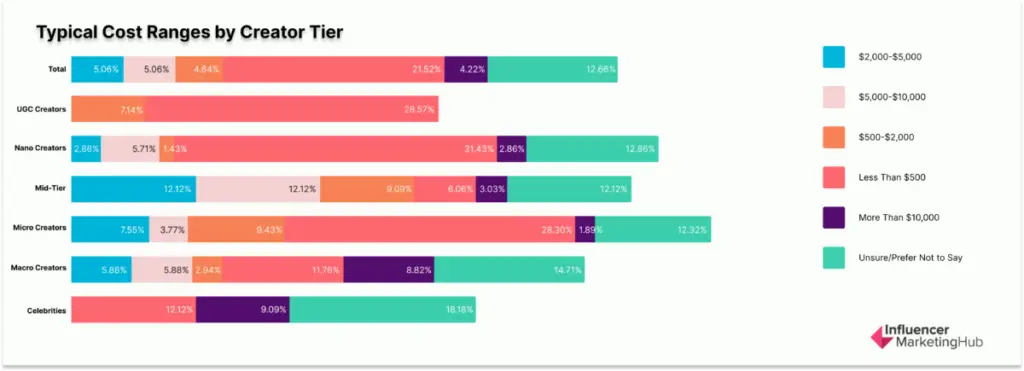
Among respondents for cost ranges, the lower tiers cluster heavily in the sub-$500 territory.
- For UGC creators, roughly 80% of all responses sit under $500, with the remainder mostly in $500–$2,000.
- For Nano creators, the largest share of answers is also under $500 (about 55%), with a meaningful “not sure” portion still present.
- Micro creators follows a similar shape: about 45.5% of all responses are under $500, with smaller shares in $500–$2,000 and a non-trivial “not sure” group. The cost curve shifts upward as you move into mid-tier and macro.
- Mid-tier respondents most commonly place creators in the $2,000–$5,000 and $5,000–$10,000 bands (each about 22.2%), while Macro is more dispersed—showing meaningful representation across low-cost, mid-cost, and >$10,000 bands.
What This Means for Your 2026 Operating Model Is Straightforward:
If your growth is coming from nano/micro/UGC, your limiting factor won’t be “finding creators.” It will be throughput.
Scaling these tiers forces you to industrialize the workflow: intake, vetting, briefing, compliance, usage rights, asset management, and performance tagging need to scale faster than creator volume.
The macro tier’s near-neutral pattern also suggests many teams are keeping macro as a selective layer—used for credibility moments, launches, or reach spikes—while the program’s day-to-day output shifts down-market to smaller creators and UGC-style production.
Social Commerce Adoption and Testing Plans
Social commerce is still not a standard part of the influencer playbook in 2026; most teams are either not participating yet or treating it as a planned experiment.
In this survey, 53.33% of respondents say they are not currently using social commerce, while 46.67% say they’re planning to test in 2026. That split matters operationally: you should assume that “best practices” are still being learned in-market, and that performance will vary heavily by platform, category, and execution maturity.
When you look at which platforms current adopters are actually using, the market is highly concentrated.
TikTok Shop accounts for 66.17% of platform selections among adopters, while the next tier is far smaller: Instagram Checkout (13.16%), YouTube Shopping (9.02%), Facebook Shops (8.27%), and Pinterest Shopping Features (3.38%).
In practical terms, that’s a “TikTok-first” adoption curve: if you’re building social commerce capability, the dominant pattern is that teams are learning it on TikTok, and only then branching out—if they branch out at all.
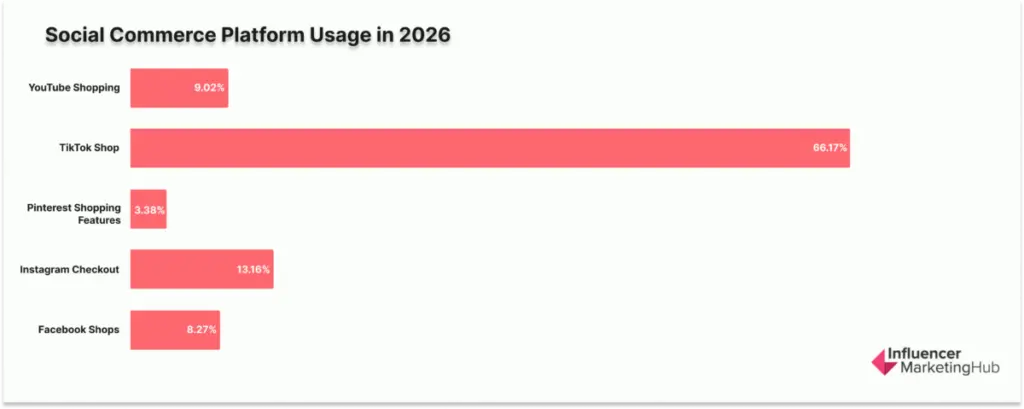
*These platform percentages reflect incidence among adopters; responses can be multi-select.
Adoption is also strongly tied to growth intent.
- Among brands planning to increase influencer budgets, 70.37% say they are using social commerce (vs. 29.63% not using).
- Among brands planning budget decreases, only 41.67% say they are using social commerce (58.33% not using).
- Brands expecting no budget change sit in the middle at 60.00% using (40.00% not using).
If you’re in growth mode, social commerce is already part of the toolkit for most of your peer set—roughly 1.7× more common among budget-increasers than budget-decreasers—so it’s becoming a marker of “scaling intent,” not just experimentation.
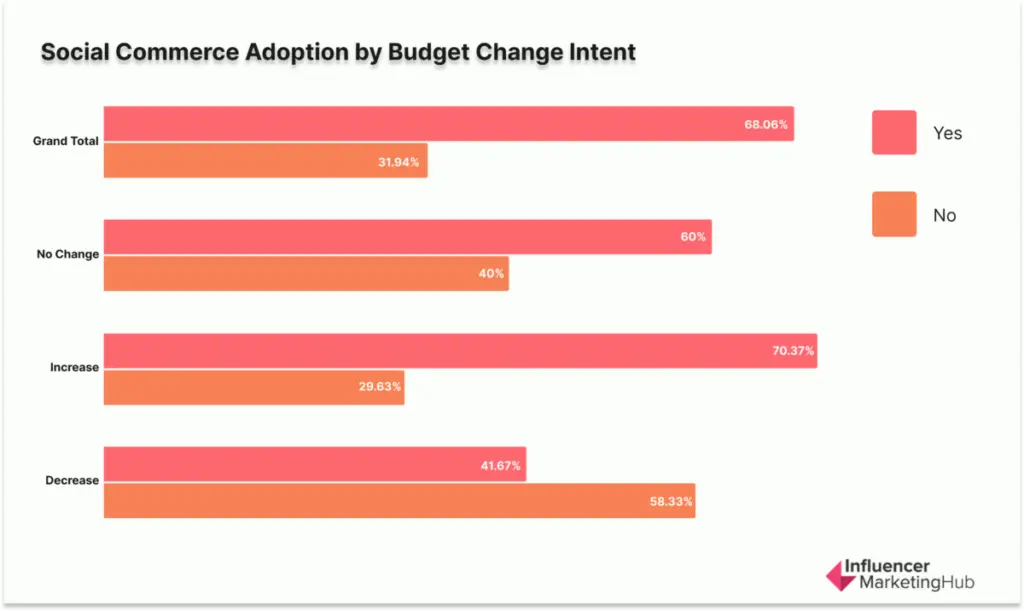
The data suggests that teams who are increasing budgets are the ones most likely to be active here—so if you’re planning to scale, pressure-test whether your internal workflow (catalog/offer readiness, creator briefing, content approvals, tracking) can support it before you expand spend.
Content Format Effectiveness Rankings
The 2026 data shows a clear hierarchy: video wins by a wide margin, and everything else is fighting for “supporting format” status.
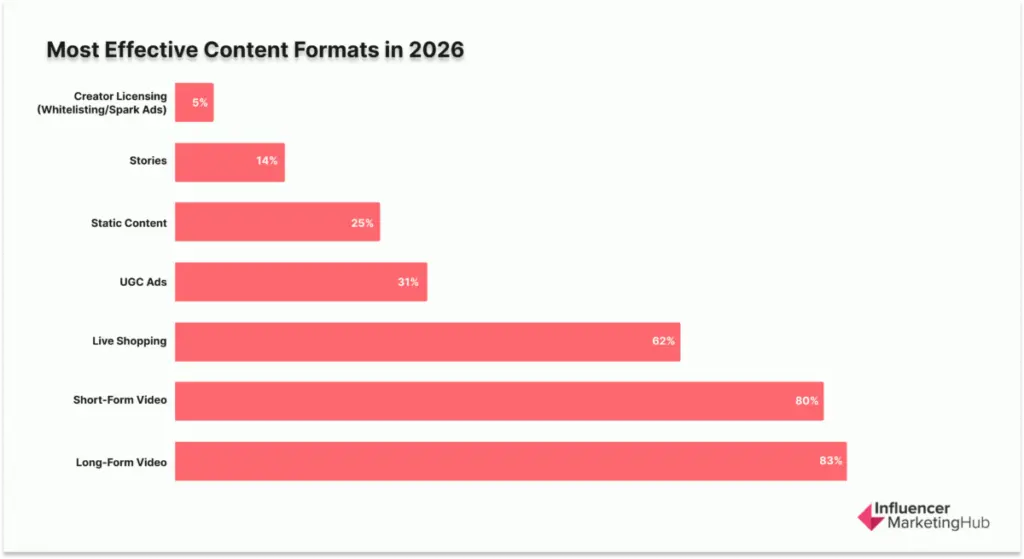
Video Is the Default “Core Format,” but Short-Form Is the Hero
Most brands put both long and short form content in their top three most effective content formats. This means most teams see video as the most reliable path to outcomes.
- Long-form has one of the highest percentages in the entire set (83%).
- Short-form is equally effective (80%).
Live Shopping Is High-Upside, Low-Consensus
As much as 62% of brands put live shopping in their top three most effective content formats.
UGC Ads and Static Content Show Mid-Tier Utility, Not Leadership
These two formats sit in the middle: they matter, but they rarely lead.
- 31% of brands rank UGC as highly effective.
- 25% of brands rank Static Content as highly effective.
This pattern suggests many teams treat them as amplifiers and variants rather than the main engine: useful for extending creative, testing messages, and supporting performance, but not perceived as the strongest standalone format versus video.
Stories and Creator Licensing Rank Lowest Across the Board
Two formats show very low perceived impact in this dataset:
- 14% for Stories
- 5%, by far the lowest in our dataset, for Whitelisting
This doesn’t mean they “don’t work” in every scenario, but it does mean most brands are not experiencing them as primary effectiveness drivers right now.
For a marketer, the implication is prioritization: if you’re resource-constrained, these are the easiest to keep out of the core plan unless you have a specific reason they belong.
What To Do With This In Your 2026 Plan
If you’re using this benchmark to allocate effort and expectations:
- Treat long-form video as the most common “hero” format.
- Treat short-form video as highly effective.
- Treat live shopping as a targeted bet.
- Treat UGC ads + static as supporting formats with moderate adoption.
- Treat Stories + licensing as low-consensus formats in this dataset.
Measurement Tool Adoption Shifts With Budget Intent
Measurement behavior changes as budgets grow, but not in the way most marketers assume.
The largest share of respondents plans aggressive budget expansion, and that same group dominates measurement selections overall, which makes sense.
In the combined measurement view, brands planning to increase by 50%+ account for 64.23% of all measurement-tool selections, followed by those planning to increase between 20-49% (14.62%) and those not planning to increase adoption with 12.69%.
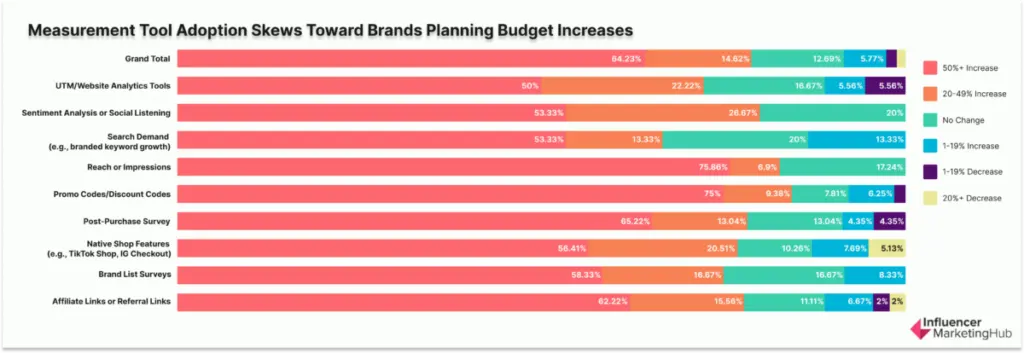
That distribution confirms that measurement is present in scaling programs, but it also reveals a more important planning reality:
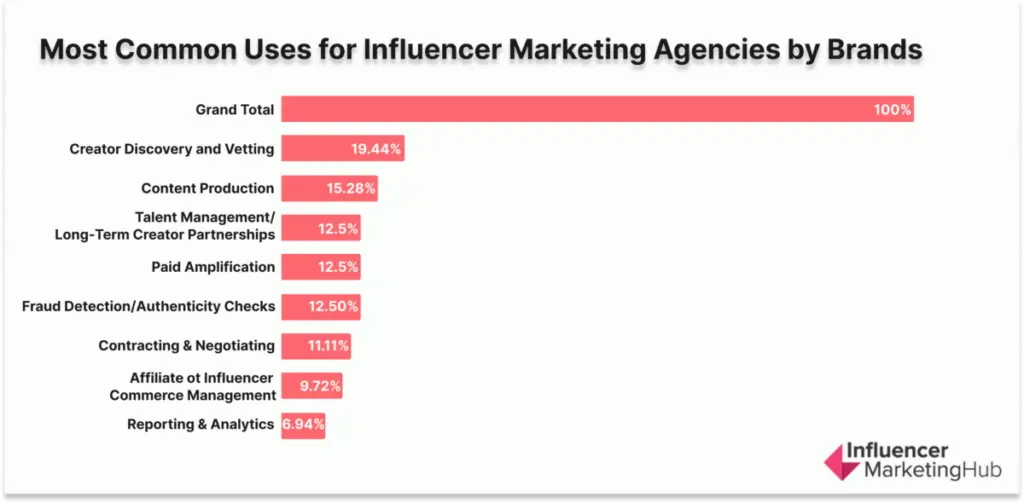
Influencer Marketing Functions Most Commonly Outsourced to Agencies
The 2026 survey shows agencies are being used primarily as execution and scale partners, not as end-to-end owners of the influencer program.
The most commonly outsourced function is creator discovery and vetting (19.44%), followed by content production (15.28%). A second cluster sits close behind: talent management/long-term creator partnerships, paid amplification, and fraud detection/authenticity checks, all at 12.5%.
Contracting and negotiation work remains a meaningful outsource category at 11.1%, while affiliate/influencer commerce management is less frequently pushed to agencies, at 9.7%.
The clearest signal is what’s least outsourced. And the result is clear: reporting & analytics at 6.9%.
For marketers, that’s a directional indicator of where control is concentrating. In this respondent set, teams are more willing to outsource labor-intensive activities (sourcing, producing, amplifying, managing creator relationships) than to outsource visibility into results.
That aligns with the broader “influencer as a real channel” shift: once budgets rise and scrutiny increases, many teams want measurement access, definitions, and decision rules to live in-house rather than inside agency reporting.
What the Outsourcing Pattern Implies About Operating Models in 2026
1) Agencies Are Being Hired for Access and Throughput, Not Strategy Ownership
Creator discovery/vetting being the top outsourced function (19.44%) suggests agencies are still valued for creator networks, speed, and screening capacity—especially as brands expand nano/micro and UGC-style volume where sourcing becomes a production line.
2) Execution Work Is Split Into Specialist Lanes
The distribution is spread across multiple functions rather than concentrated in one “full-service” bucket. With content production (15.28%), paid amplification (12.5%), and authenticity checks (12.5%) all high, the data supports a modular model where agencies plug into specific bottlenecks instead of running the entire program.
3) Measurement Is Increasingly Treated as an Internal Asset
Reporting & analytics ranking last (6.94%) is consistent with teams wanting direct performance visibility and less reliance on agency-defined ROI narratives. In practical terms, marketers are behaving like this is a channel they own—where agencies support delivery, but the brand retains the truth layer.
How to Use This as a Marketer
If you’re deciding what to outsource in 2026, this benchmark points to a high-leverage split:
- Outsource capacity and specialization: Creator sourcing/vetting, production workflows, paid amplification operations, authenticity screening, and contracting support when legal bandwidth is tight.
- Keep decision authority and measurement definitions in-house: KPI ownership, reporting standards, and optimization rules (who gets scaled, who gets cut, what “success” means per objective).
That division of labor matches how the market is behaving: influencer marketing is being managed more like an internally owned growth function, with agencies acting as tactical extensions where speed, access, and operational load are the limiting factors.
Influencer Fraud and Quality Risks
Fraud shows up in your program less as “bad content execution” and more as audience authenticity risk.
In this dataset, fake or bot followers account for 56.5% of all reported fraud/quality issues, dwarfing every other category. That single number tells you where the real leak usually is: not in how creators post, but in who the audience actually is.
The next tier of risk clusters around engagement quality—signals that can make a creator look healthy even when the audience isn’t. Inauthentic or templated comments represent 10.6% of selections, and fake or purchased engagement represents 10.2%.
Combined, that’s 20.8% of reported issues tied to “engagement integrity.” In other words, even when follower counts aren’t the only metric you look at, engagement can still be engineered to pass a surface-level check.
More operational forms of fraud exist, but they appear less frequently in this survey. Incentivized or undisclosed reviews account for 6.1%, and misreported performance metrics account for 5.4%—11.5% combined.
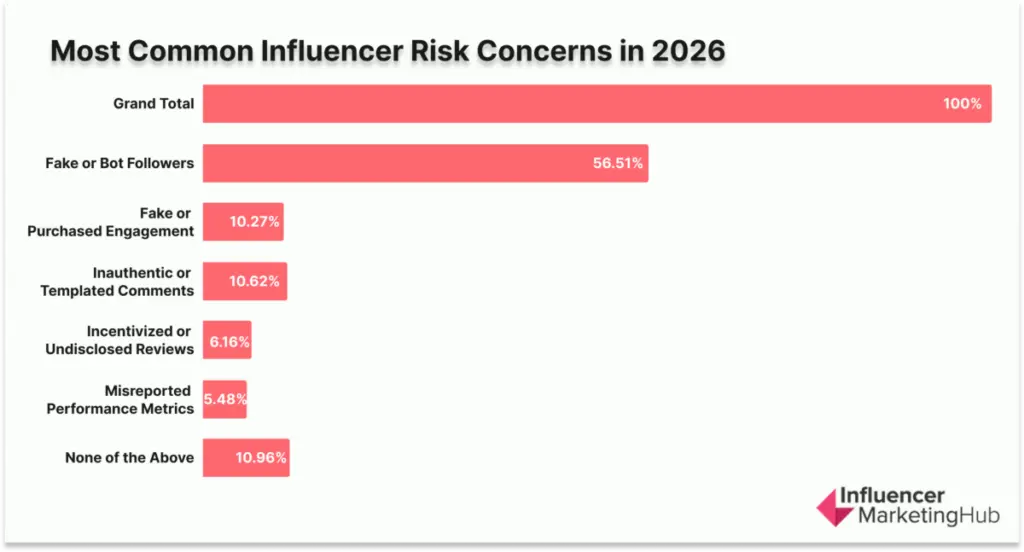
These risks matter because they create compliance exposure and internal reporting noise, but they are not the dominant pain point compared to audience manipulation.
The final signal is the one that should shape your posture: only 10.9% selected “none of the above.” That means fraud and quality risk is not an edge case you handle “when it happens”—it’s a baseline condition most teams expect to manage continuously.
What This Means for How You Should Run the Channel in 2026
1) Make Authenticity Controls Part of Onboarding, Not Post-Mortems
If fake/bot followers are the primary issue, your protection has to happen before contracting. Treat “audience quality verification” as a gating step—especially as you scale volume (more creators = more exposure).
2) Stop Using Engagement as a Comfort Metric Unless You’re Validating Its Quality
With ~21% of reported issues tied to fake engagement and templated comments, raw engagement rate alone can mislead you. Your check needs to include how engagement behaves (patterns, repetition, timing) and who it comes from (authenticity of engagers), not just the total count.
3) Don’t Ignore Compliance/Reporting Risk Just Because It’s Smaller
Misreporting and undisclosed incentives are less common in this distribution, but they’re high-impact when they occur: they can distort your learning loops and create avoidable brand risk. The right move is to standardize expectations in contracts and workflows so compliance isn’t “optional” or dependent on creator habits.
What to Do Next
If you want this benchmark to change outcomes (not just describe the market), the practical takeaway is: optimize your program around quality control at the top of the funnel—creator vetting, audience authenticity checks, and engagement-quality validation—because that’s where the majority of reported risk concentrates in 2026.
Current AI Applications in Influencer Marketing
AI is being applied where influencer teams feel the most immediate scaling pressure: creator discovery leads adoption at 36.67%.
This signals that the primary business case for AI is not replacing strategy; it’s increasing sourcing velocity, improving creator-audience matching, and reducing the manual workload of vetting as programs expand.
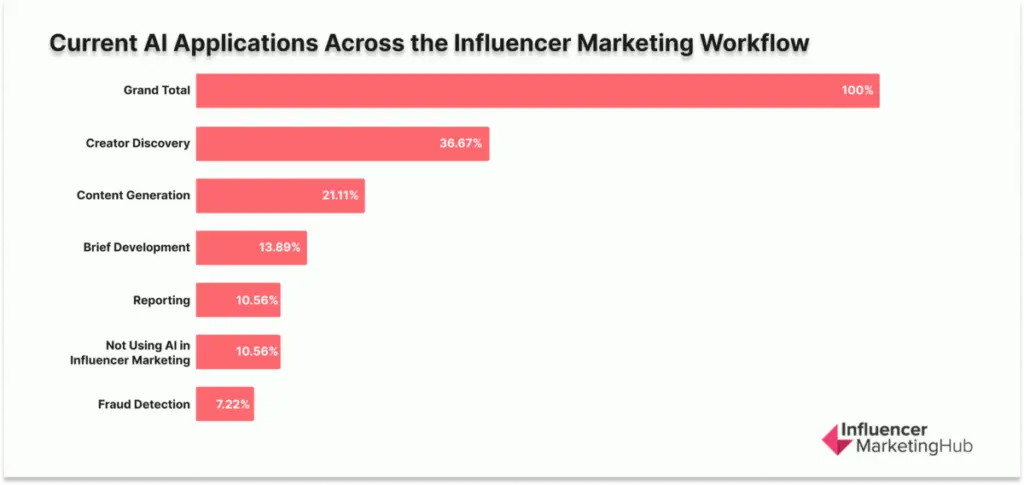
AI’s second role is creative throughput. Content generation is cited by 21.11% of respondents, and brief development by 13.89%, showing that many teams use AI to accelerate campaign setup, create more creative variants, and shorten production cycles.
Combined with discovery, these early-stage and creative applications make up 71.67% of selections, reinforcing that AI is currently positioned as a productivity layer across the front half of the workflow.
Adoption drops sharply in areas where trust and accuracy are the product. Reporting sits at 10.56% and fraud detection at 7.22%, indicating that most teams are not yet comfortable delegating validation-heavy tasks to AI.
This pattern aligns with rising internal accountability: as budgets scale, teams tend to prioritize direct visibility and defensible measurement over automated interpretation.
AI is also not yet a default capability across the market. 10.56% of respondents report they are not using AI in influencer marketing, which points to uneven maturity: some programs are already systematizing discovery and creative iteration, while others remain fully manual.
The practical implication for your 2026 operating model is sequencing: use AI first where it reliably reduces cycle time—discovery, briefing, and content ideation—and introduce it into reporting and fraud only with clear standards, audit steps, and human approval, so automation increases speed without weakening governance or trust.
Influencer Marketing Challenges
The 2026 survey shows influencer programs are being pressured most by market economics, not internal execution capacity.
Rising creator costs are the top challenge at 35.4%, making pricing pressure the primary constraint marketers are planning around. When combined with budget constraints (5.28%), economic pressure totals 40.68% of reported challenges, indicating that the dominant problem is not “how do we run influencer,” but “how do we afford and justify scale under increasing rates.”
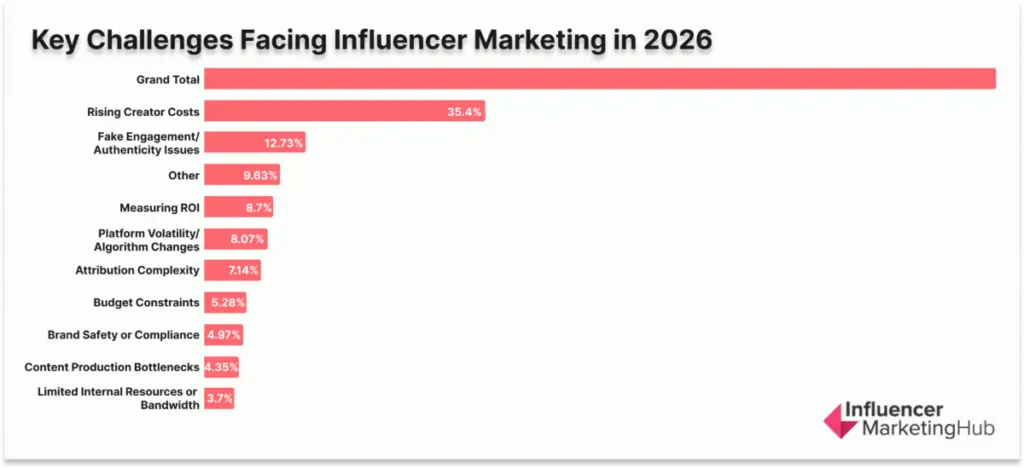
The second major challenge cluster is trust and quality. Fake engagement and authenticity issues account for 12.73% of selections, keeping fraud risk a top-tier operational concern even as influencer marketing matures.
This matters because authenticity risk directly undermines cost efficiency: when prices rise, the tolerance for wasted impressions, inflated reach, and unreliable audiences drops sharply.
Measurement remains a structural constraint rather than a solved problem. Measuring ROI (8.70%) and attribution complexity (7.14%) combine to 15.84% of reported challenges, showing that even when teams invest, they still struggle to connect creator activity to outcomes in a way that holds up internally.
This is consistent with a channel that is scaling into higher scrutiny: the more budget moves into influencer, the more measurement becomes a budget-defense requirement, not a reporting formality.
Platform instability is a meaningful but secondary pressure. Platform volatility and algorithm changes sit at 8.07%, indicating marketers still view platform dynamics as a risk, but less urgent than cost inflation, authenticity, and proof.
Operational constraints rank lower: content production bottlenecks (4.35%) and limited internal bandwidth (3.73%), total 8.08%, suggesting most teams see execution as manageable compared to the economic and trust environment they’re operating in.
Brand safety/compliance (4.97%) remains present but is not the dominant constraint in this dataset, while 9.63% of respondents cited other signals a meaningful tail of program-specific challenges that vary by category, region, and business model.
The practical implication for 2026 planning is that high-performing teams will win less through “doing more influencer marketing,” and more through controlling unit economics, validating creator quality, and tightening proof loops, because that’s where the majority of market-reported friction sits today.
Leading Influencer Marketing Focus Areas
Your peers are prioritizing capabilities that make influencer marketing easier to scale, easier to monetize, and harder to waste.
The top focus area is AI-driven creator matching (26.89%), which signals that the primary bottleneck many teams want to solve is not “how to run influencer campaigns,” but how to source, vet, and fit creators efficiently as volume increases.
When creator costs are rising and authenticity remains a persistent risk, better matching becomes a practical lever for improving unit economics: fewer misaligned partnerships, faster cycles, and less spend lost to low-quality audiences.
The second-ranked priority—social commerce (19.33%)—shows influencer programs moving closer to revenue, not just attention. This focus is less about chasing novelty and more about tightening the path from creator content to transaction.
In a market where pricing pressure is the dominant challenge, commerce-enabled influencer becomes an efficiency play: it’s one of the clearest ways to convert creator activity into outcomes that budget owners recognize.
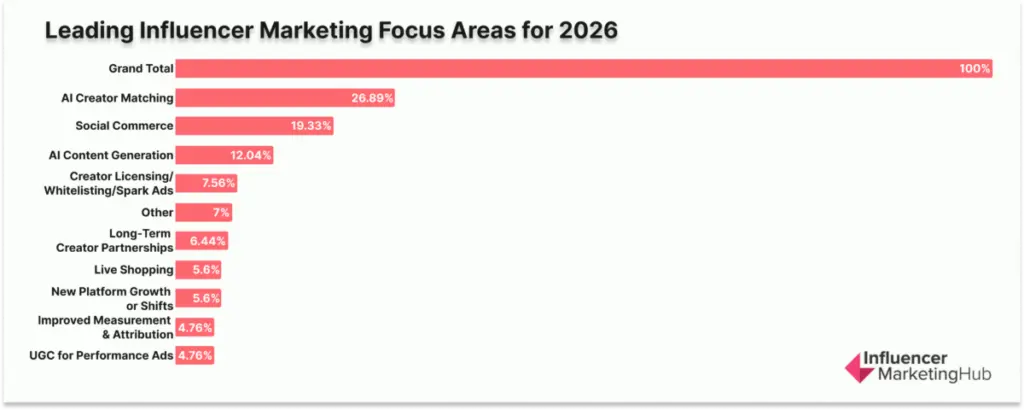
AI also ranks high as a creative accelerator. AI-assisted content generation (12.04%) indicates that brands are using AI to increase creative throughput—more variations, faster iteration, and shorter production cycles—rather than handing over strategic decisions.
Combined, the two AI priorities (matching + content generation) account for 38.93% of all selections, reinforcing that AI is being applied where speed and scale matter most.
Several priorities sit in the “enablement layer” rather than the core engine. Creator licensing/whitelisting/Spark Ads (7.56%) and long-term creator partnerships (6.44%) indicate continued interest in making creator output more reusable and more durable—either by extending distribution rights or by stabilizing creator relationships.
Live shopping (5.6%) and new platform growth or shifts (5.6%) appear as secondary bets: meaningful, but not where most teams are placing their primary focus.
Finally, the low ranking of improved measurement & attribution (4.76%) and UGC for performance ads (4.76%) suggests that many teams view these as known levers rather than the next frontier.
The market’s stated priorities are not centered on experimenting with new tactics; they’re centered on building an influencer operating system that can scale under pressure—where creator selection gets smarter, creative production gets faster, and outcomes move closer to commerce.
Influencer Marketing Ownership and Operating Model
The 2026 data shows influencer marketing is being run as an internally owned growth function far more often than an outsourced service. 66.33% of respondents say their influencer marketing is managed entirely in-house.
Another 10.71% report a hybrid model (a mix of in-house + agency), while the same percentage (10.71%) runs it through an agency partner. A notable 12.24% say they don’t run influencer marketing today, which matters for interpretation: this is not a market where everyone is active, but among those who are active, internal ownership is the dominant operating model.
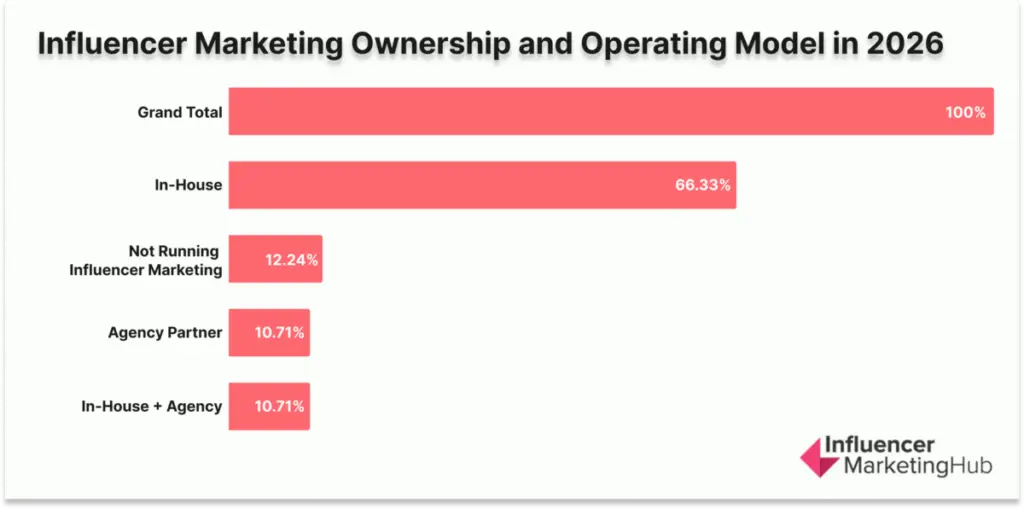
The structure of the distribution is the signal. With roughly two-thirds in-house and only about one-fifth involving agencies either fully or partially (21.42% combined for hybrid + solely agency), the typical brand posture is: keep strategy, decision-making, and performance visibility inside the company, and use external partners only when they unlock speed or specialized capacity.
This aligns with the broader maturity pattern across the survey: when budgets scale, and scrutiny rises, teams tend to treat influencer marketing like any other paid and owned growth channel—owned internally, governed internally, and evaluated on internally defined metrics.
For marketers, the implication is practical rather than philosophical. If your program is in-house (as most are), your limiting factors shift to process and throughput: creator sourcing velocity, brief quality, content review cycles, legal contracting flow, and measurement consistency.
If you do use an agency, the benchmark suggests the most effective model is typically modular—agencies as tactical extensions for execution and scale—rather than handing over the full program.
KPI Priorities Shift Upward as Budgets Rise
When budgets increase, the way teams define success also changes.
Across all respondents, brand awareness is the most selected KPI. It clearly leads the list.
Engagement, content quality, conversions, and reach or impressions follow behind.
Metrics tied directly to sales, such as web traffic and attributable revenue, appear less frequently overall.
What Happens When Budgets Increase
Among teams planning to increase budgets by 50% or more:
- 63.5% of all KPI selections come from this group
- 34.9% of their selections are brand awareness alone
- 69.2% of their total KPI mix is upper funnel
- 21.5% is lower funnel
Among teams increasing budgets by 20% to 49%:
- 75.0% of their KPI mix is upper funnel
- 19.4% is lower funnel
Among teams keeping budgets flat:
- 45.5% of KPIs are upper funnel
- 29.5% are lower funnel
- 25.0% fall into other diagnostic metrics such as brand lift and sentiment
For comparison, only 9.3% of KPI selections in the 50%+ increase group fall into those diagnostic categories.
What the KPI Breakdown Shows
Looking at individual KPI selections among brands increasing budgets:
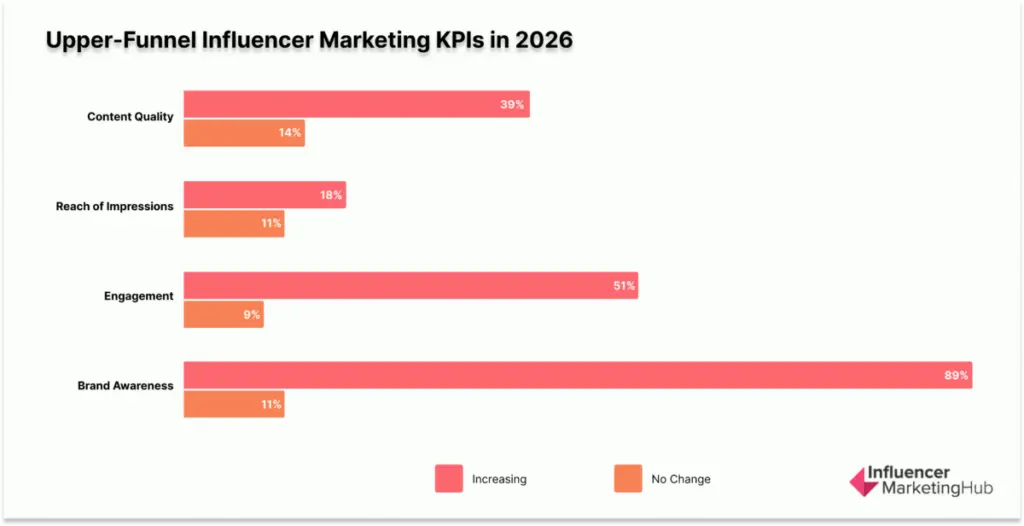
- 89% select brand awareness
- 51% select engagement
- 39% select content quality
- 18% select reach or impressions
Lower funnel KPIs are selected less frequently:
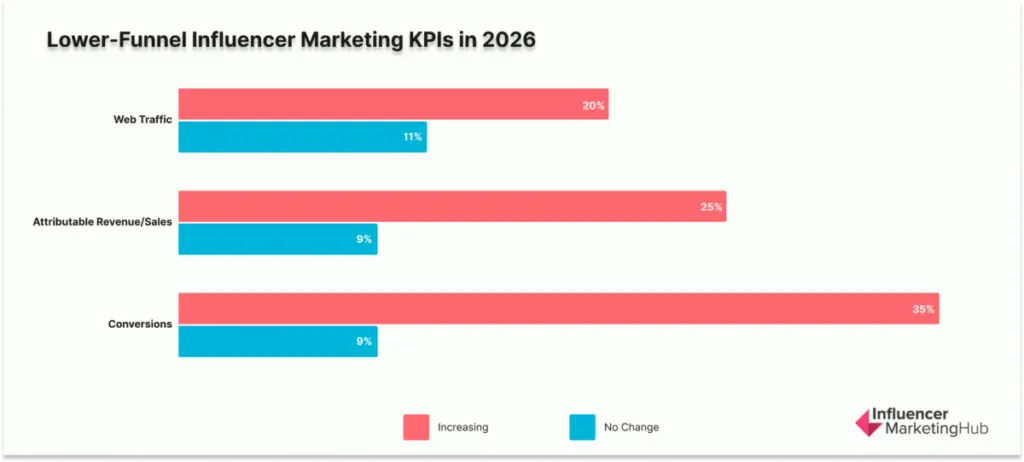
- 35% select conversions
- 25% select attributable revenue or sales
- 20% select web traffic
What This Means
The numbers show a clear pattern.
As budgets increase, KPI focus becomes more concentrated around awareness and engagement. Lower funnel metrics remain part of the strategy, but they do not grow at the same rate as upper funnel goals.
When budgets stay flat, teams distribute KPIs more evenly across awareness, performance, and diagnostic metrics.
In simple terms, higher budget growth aligns with brand building. Flat budgets align with balanced measurement.
SUGGESTED

Influencer Marketing Hub
Stay Ahead of the Influencer Marketing Movement The latest benchmarks brand stories and...

What is Influencer Marketing? The Ultimate Guide for 2026
Learn how influencer marketing drives brand awareness engagement and sales with our...

10 Influencer Marketing Campaign Examples in 2026
Explore 10 influencer marketing examples with real campaigns results and strategies...