COVID-19 has shocked the world and sent economies spinning. It was late-2019 when the virus first appeared in the Chinese city of Wuhan. Initially, it only affected China, but its effects are now felt around the globe, with many countries in lockdown.
Many businesses are fighting to survive, and marketing will be an essential part of their recovery. We have already provided a series of marketing tips that will help many firms better weather the Coronavirus crisis.
But just how significant an effect will the virus have on marketing and sales? We recently surveyed 237 brands to see how they are coping with the crisis. Also, we have scoured the Net and found a wide range of other Coronavirus-related marketing and sales statistics. The overall trend from our survey was one of great concern, but the realization that the crisis will affect some industries far more than others. Businesses deemed essential are struggling to meet demand at the moment. Luxury and service-related firms are in a more precarious position. And companies that have not kept up with the times, for example, "old media" are in the most dangerous situation of all. For example, magazine publishers have already pulled the plug on significant and long-running publications. We present the results of our survey, along with the other statistics below. We carried out our survey in late March 2020 and September, and most of the other statistics quoted also relate to that time.
Now we've reached the end of 2020 and seen the world become totally disrupted, we should be thankful that the world of commerce hasn't been worse affected. The nations that have done best to contain COVID-19, such as New Zealand, Australia, and Taiwan, are now rebounding through a V-shaped recovery (although some argue the recovery is more K-shaped, with more inequality in the population). Those nations who are still battling thousands of deaths daily due to COVID hope that their recoveries will begin soon too.
COVID-19 Marketing Report: Stats and Ad Spend:
Forecast Search Ad Spending Now Expected to Exceed Pre-Pandemic Predictions by 2022
Before the COVID-19 pandemic, eMarketer predicted that search ad spending would rise by 14.4% in 2020. Indeed, they suggested there would be a steady rise in search ad spending through to at least 2024. Of course, in the early days of the Coronavirus, with lockdowns across the world and online shopping was not yet commonplace, there was a drop in online shopping queries, particularly in the travel sector.
However, despite the virus's persistence, online search has recovered, as online shopping has become the norm, and eMarketer now expects an overall 5.9% growth in search ad spending this year.
They recognize that the pandemic has now made a permanent change in the way people shop. So, while their current forecast for search spending in 2020 and 2021 is lower than they predicted before the pandemic, their new forecast for search now exceeds their pre-pandemic expectations for 2022 to 2024. They now expect advertisers will spend $99.22 billion on search in 2024, up from their earlier prediction of $91.32 billion.
Online Sales Jumped 15.1% on Cyber Monday 2020, But This Was Less Than Expected
Results for Cyber Monday 2020 can best be described as mixed. Consumers spent a record $10.8 billion online on Cyber Monday, making it the largest shopping day in the history of U.S. eCommerce.
However, as good as this sounds, digital sales increased just 15.1% year over year from $9.4 billion in 2019. This is far slower than optimistic projections based on massive year-to-date surges in online buying. Adobe had forecast a 35.3% increase for the day, making the 15.1% increase a decidedly disappointing reality. Cyber Monday 2019 had seen a 19.7% year-over-year boost over the 2018 figures.
Third-Party Sellers Grow Their Sales By 60% Year-On-Year on Amazon on Black Friday
Independent businesses selling on Amazon saw record demand from customers over the Black Friday weekend. 2020 has seen the largest holiday shopping season so far in Amazon's history. Amazon customers made Black Friday and Cyber Monday the best-ever for independent businesses selling on Amazon, most of whom are small and medium-sized businesses, with worldwide sales growing over 60% year-over-year. Independent businesses selling on Amazon surpassed $4.8 billion in worldwide sales from Black Friday through Cyber Monday.
UK Sales Rebound in August
After the initial shock of COVID, it is gratifying to see something of a rebound in UK retail sales. UK retail sales increased 4.7% on a like-for-like basis between August 2019 and August 2020 (although the 2019 figure was a 0.8% decrease from 2018).
On a Total basis, sales increased by 3.9% in August, against a decline of 0.4% in August 2019.
However, over the three months to August, in-store sales of Non-Food items declined 17.8% on a Total and 8.5% on a like-for-like basis. Over the three months to August, food sales increased 6.3% on a like-for-like basis and 5.9% on a Total basis. People clearly still have to eat during a pandemic, although panic buying undoubtedly affected the timing of their purchases.
62% of US Shoppers Say They Shop Online More Now Than Pre-COVID
Bazaarvoice surveyed over 5,000 consumers in various countries to learn more about their holiday shopping plans in the post-COVID world. Consumers in all those countries acknowledged that they now shop more online than previously: United States (62%), Canada (59%), Mexico (70%), the United Kingdom (58%), France (41%), Germany (32%), and Australia (47%). Overall, 49% of shoppers say they're shopping online now more than they were pre-COVID.
75% of Mexicans Believe COVID Will Impact Their Holiday Spend Compared to Just 27% of Germans
The Bazaarvoice Survey also asked consumers in the seven surveyed nations whether they thought COVID-9 would impact their holiday spending. Surprisingly, the answers varied markedly between the countries. The percentage of people who believed that their holiday spending would be impacted was: United States (50%), Canada (44%), Mexico (75%), the United Kingdom (44%), France (34%), Germany (27%), and Australia (51%). This averaged out to be 43% across all the nations.
It's Advertising as Usual for the US Telecom Industry
In some ways, it is a case of "Pandemic, what pandemic?" for the US telecoms industry. They are amongst the largest advertisers in the United States, having spent $12.49 billion on digital advertising alone in 2019. This was 9.4% of total digital ad spending.
Despite the pandemic, eMarketer predicts that the US telecoms will spend $13.99 billion in 2020 (a 12% increase, 10.4% of total digital ad spending.) And they are expected to boost their advertising even more next year, increasing by a further 23.0% to $17.21 billion – 10.6% of total digital ad spending.
One of the reasons for this is that the telecom sector is fiercely competitive, and there is low brand loyalty. Consumers will happily change phone networks if they see advertising proposing a better deal elsewhere. And just because there is a deadly bug touring the world hasn't caused people to turn off their phones. Indeed, with more teleworking, people are probably using their smart devices more, as they can simply pop into the next office to ask a question or share some gossip.
Radio Advertising Expected to Drop 25% This Year
While some industries, like telecoms, expect little or no reduction in their marketing efforts due to Coronavirus, others, like radio, are noticing a significant change. eMarketer initially forecast that US radio ad spending would fall by a mere 1.0% back in March. They have markedly changed this estimate, though, and now anticipate a 25.0% drop.
With radio being a traditional form of advertising, there were always expectations of a fall in radio advertising, but by nowhere near this level of magnitude.
On a positive note, eMarketer expects radio ad spending to rebound in 2021 to $12.18 billion. However, they see this as a one-off, with further smaller drops in subsequent years, reaching $11.82 billion in 2024. By comparison, their pre-COVID March forecast thought that spending in 2024 would have been $13.22 billion.
Facebook Removes 7 Million Posts for Sharing False Information on Coronavirus
One of the more bizarre side effects of the current pandemic has been the prominence of conspiracy theorists. In New Zealand, for instance, one of the most talked-about new parties heading into the upcoming election is the New Zealand Public Party. Their policies nearly all relate to conspiracy theories. They meet the criteria to appear on television debates and advertise as freely as the big parties (NZ has an MMP political system). The party opposes the United Nations, 5G technology, 1080 poison, fluoridation, and electromagnets. It spreads misinformation related to the COVID-19 pandemic and campaigns on repealing the COVID-19 Public Health Response Act 2020.
Much of the "conspiracy marketing" during COVID has been shared on Facebook. However, Facebook has clearly tried to reduce instances of sharing COVID conspiracy theories on the platform. It removed 7 million posts in the second quarter of the year for disseminating false information about COVID-19. This includes content that promoted fake preventative measures and exaggerated cures (some of which were encouraged by high profile politicians).
The platform removed about 22.5 million posts containing hate speech in the second quarter, up from 9.6 million in the first quarter. It also deleted 8.7 million posts connected to extremist organizations, compared with 6.3 million posts in Quarter One.
Marketer Optimism Plummeted to Great Recession Levels
The CMO Survey provides the marketing profession with an understanding of how the upheavals of COVID-19 have influenced marketing activities, spending, jobs, and performance. The CMO Survey is administered twice a year via an Internet survey. Their recent Special Edition focuses on understanding the impact of the COVID-19 pandemic on marketing in companies.
One notable conclusion was that marketer optimism has plummeted to 50.9 on a 0-100 scale with 0 being least optimistic and 100 most optimistic. Immediately before COVID, the score was 62.7. The index peaked in February 2015 when it reached 69.9.
They split these scores by sector. B2B (54.0) is more optimistic than B2C (47.1). Somewhat intuitively, Healthcare is the most buoyant sector at 59.0, and Consumer Services is the least confident at 43.9
97.0% of Marketers Have Noticed Lower In-Person Marketing Engagement
The respondents of the CMO Survey were asked what types of customer behaviors they have observed during the COVID-19 pandemic. The most notable statistic was 97.0% noticed lower in-person marketing engagement (e.g., sales/store visits, trade shows). Other clear trends in customer behavior that the respondents identified during the pandemic include:
- Increased openness to new digital offerings introduced during the pandemic (84.8%)
- Increased value placed on digital experiences (83.8%)
- Greater acknowledgment of companies' attempts to "do good" (79.1%)
- Lower likelihood to buy (67.2%)
- New customers have attracted to their products and services (65.4%)
Pandemic Raises Marketing Budgets as a Percentage of Firm Budget and Revenue
Another notable trend shown in the CMO Survey was that the marketing budget of most of the firms surveyed increased as a percentage of the overall budget during the COVID period. In February 2020, respondents' firms planned to spend 11.3% of their total budgets on marketing, on average. By June 2020, this rose to 12.6%. As an additional comparison, the figure was only 8.1% back in February 2011.
You can see a similar trend when you compare marketing expenses with total revenues. Back in February 2011, marketing expenses were also 8.1% of a typical firm's revenues. This statistic fluctuated over the next nine years, reaching a peak of 9.3% in February 2014, before falling to 7.9% in February 2018. It had risen back to 8.6% in February 2020 but skyrocketed to 11.4% by June 2020.
This clearly reflects the priorities given to marketing to retain customers and maintain brand awareness in tough times.
69% of Brands Expect They Will Decrease Ad Spend in 2020
While our survey was carried out before the end of March, the concerns of the current situation were clearly obvious to our respondents. 69% of them have indicated that there is either a high or possible likelihood that they will be decreasing their ad spend this year. Presumably some of our respondents are from regions in lockdown and will have already stopped ad campaigns for products they cannot currently sell.
65% of Respondents Noticed a Decrease in Revenue
While there was still a week to go in March at the time of our survey, 65% of our respondents say that their firms were already reporting a noticeable decline in revenue. Most of the remaining firms are probably in essential industries or regions yet to experience the worst effects of the coronavirus.
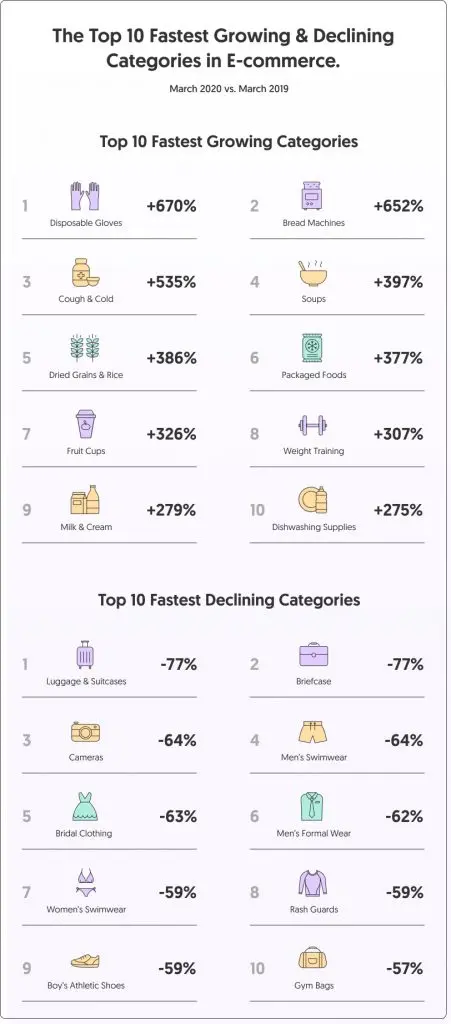
Below are interesting findings from Stackline, where they compared e-commerce sales across the U.S. and compiled a list of the top gaining and top declining categories. (March 2020 vs March 2019)
74% of Brands Surveyed Are Posting Less on Their Company Social Accounts at Present
It should come as no surprise that nearly three quarters of the firms we surveyed have slowed down their social media posting. This is a greater drop than overall social media use, but inevitable, considering that many firms are closing up shop and refocusing their activities. In other cases, companies may still be posting, but less frequently. It is possible that this number may reverse to some extent once more social media managers are settled into working from home.
34% of Respondents Have Shifted Social Time From Instagram to Twitter
One of the more interesting results from our survey (backing up some of the results form RivalIQ research) is that there has been a shift in preferred social networks over the last few weeks. Twitter has surged in popularity recently, presumably because of its news-focus. Quite a few of our respondents also reported increasing their Facebook usage, although this may have been more to check in on their family and friends than for work activities. As a result of this, our respondents are using Instagram proportionally less now that they were just a few weeks ago.
38% of Respondents Believe They May Have to Lay Off Workers Due to Coronavirus
Perhaps the most concerning statistic from our respondents was that 38% felt that they may have to lay off workers as a result of the worsening economic conditions caused by the Coronavirus. And it must be remembered that this survey was taken before the situation became so critical in business-centric places like New York. Hopefully, measures put in place by some governments can minimize the actual number of workers who lose their jobs.

Source: thebalancecareers.com
76% Of Italian Companies Report the Emergency Deriving from The Spread of COVID-19 Has Had Immediate Negative Impacts
One of the earliest nations to suffer the horror of COVID-19 was Italy. With a rapidly spreading virus, and higher than average deaths due to an aging population, the effects have been devastating. 76% of Italian companies report that the emergency brought about from the spread of COVID-19 had immediate negative impacts. One in five companies expects they will experience their first consequences in April. Two out of three companies feel that the emergency will harm their domestic business, with the effects on exports remaining uncertain.
Estimated Effects Are Equally Relevant for Both Smaller Companies and Larger Companies
The effects of Coronavirus are of equal concern to both small and large companies. Companies surveyed show similar concern, whether they be small, with fewer than 50 employees, or large, with over a thousand employees. No business will escape the virus’s impact, and brands will have to think carefully about how they market their way through the economic shocks.
73% of Small Businesses Experience Significant Decreases in Domestic Demand
The survey signposts a significant decrease in domestic demand. 73% of small entrepreneurs surveyed stated their greatest concern was that small businesses would experience significant declines in domestic demand. If you look at images from places such as New York at the moment, you will see few people enjoying the services of small businesses (except for any that produce essential goods).
One Company Out of Four Declares That It Will Increase Marketing Activities
Some companies are bunkering down, merely trying to survive at the moment. They have reduced their spending wherever possible. In the circumstances, it is notable that one in four companies are set to increase their marketing activities, and 41% intend to make use of the momentum to maintain or increase their presence in the media.
At Least 28 Percent of Respondents Believe Sales Are Going Up
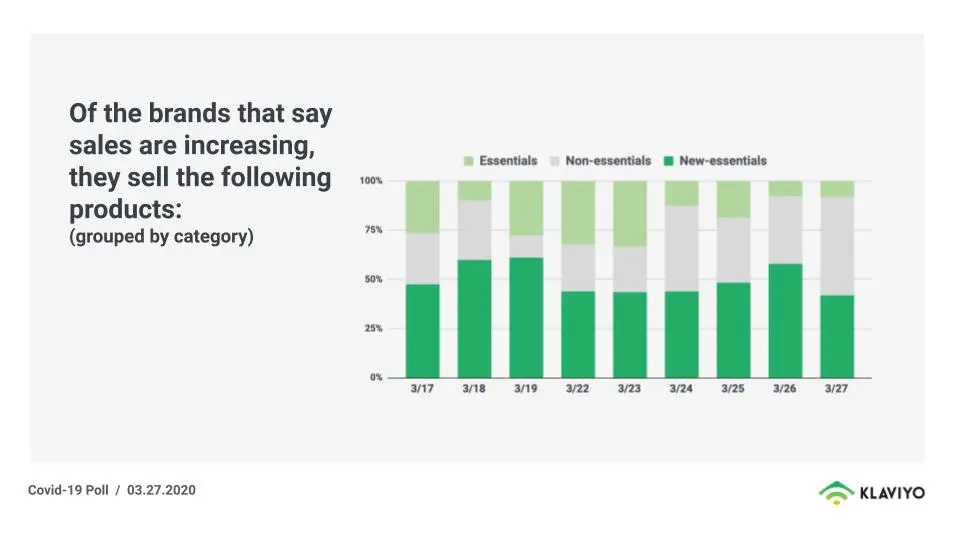
KLAVIYO has been surveying its network of 30,000 businesses each day throughout the COVID-19 crisis. The most recent survey published at the time of writing was for the week ending Friday, March 27. At that stage, an astonishing number of businesses still had optimistic sales forecasts. Surprisingly, more than 28% of respondents continue to say sales were going up. This is higher than the previous day when 24% of the respondents saw their sales increase. However, there is a distinct movement in the types of goods on which people spend their money. They are shifting their spending to essentials, and a limited range of non-essentials that some people may consider essential to their wellbeing, e.g., alcohol and religious items.
Source: klaviyo.com
UK Retail Sales Drop by 18.1% During April
Unsurprisingly, considering Britain’s lockdown, UK’s retail sales continued to fall at an accelerated rate in April. Indeed, they fell by a record 18.7% from March figures, that were themselves down by 5.2% from the previous month.
This meant that sales were a whopping 23.1% down on those of April 2019. Indeed, the dollar value of sales in the UK in April 2020 was similar to the sales of a decade earlier, April 2010.
Government restrictions, imposed from 23 March 2020, impacted many store types and some reported zero turnover because of the temporary closure of stores. Overall, 14.3% of UK stores reported zero turnover in April.
Global Retail Sales Expected to Lose $2.1 Trillion in 2020 Due to Corona Pandemic
The Corona pandemic is now predicted to have an extraordinary effect on world commerce. Forrester predicts that global retail sales in 2020 will decline by an average of 9.6% globally, a loss of $2.1 trillion. They also predict that it will take four years for retailers to overtake pre-pandemic levels.
Forrester predicts the impact of the coronavirus on retail sales will vary worldwide given the regional differences and considering that each country is at a different stage of the pandemic.
UK Auto Sales Fall by 97.3% in April 2020 Compared to Same Month in 2019
The effect of the lockdown is particularly stark when you focus on the UK new car market. Sales fell by an astounding 97.3% during April as the Coronavirus crisis shut showrooms.
Just 4,321 new cars were registered in the month, 156,743 fewer than in April 2019, with deliveries continuing to frontline workers and organisations.
The Society of Motor Manufacturers and Traders (SMMT) expects 1.68 million new car registrations for the whole of 2020, the lowest since 1992.
Searched for "Buy Online" Reached 27K in March 2020
SEMrush has looked at how searches for various terms have changed over the period of the Coronavirus. Searches for “buy online” skyrocketed in March globally, reaching up to 27K+ searches per month. This compares to about 15K searches at the start of the year.
Another keyword to see a boost in searches is “unemployment”. Unemployment does, of course, negatively impact buyers’ confidence and consumer spending. There were about 7.5K searches for “unemployment” in March, compared to just 1K in January.
Online Computer Retailer BuyPower.com Saw Paid Web Traffic Grow by 1250% in March
As we have seen in many of these stats, overall retail sales have dropped during the Coronavirus. We have also seen an overall move from sales at bricks and mortar stores to online shopping. Quite a few brands have increased their spend on online advertising, even B2B firms.
This trend has been particularly beneficial to online computer retailer, BuyPower.com. Their online advertising led to a 1250% increase in paid web traffic in March compared to February.
Other US firms to benefit from increased paid traffic during the COVID-19 crisis include veeam.com (1086% increase), wpengine.com (859% increase), easybib.com (852% increase), and ywilio.com (750% increase).
More Than 40 Percent of Brands Reporting Rising Sales of Products in the Essential Category
Along with lockdowns in many regions, there are often also restrictions on the types of items that people can buy. This has meant an increase in the proportion of goods people are buying that they deem essential. To ensure that they aren’t breaching any regulations, many brands have placed restrictions on what they will sell. Many firms that market online now only highlight essential items on their website. This has led to more than 40 percent of brands reporting rising sales of products in the Essentials category.
50% Increase in Facebook Messaging in Hardest Hit Countries
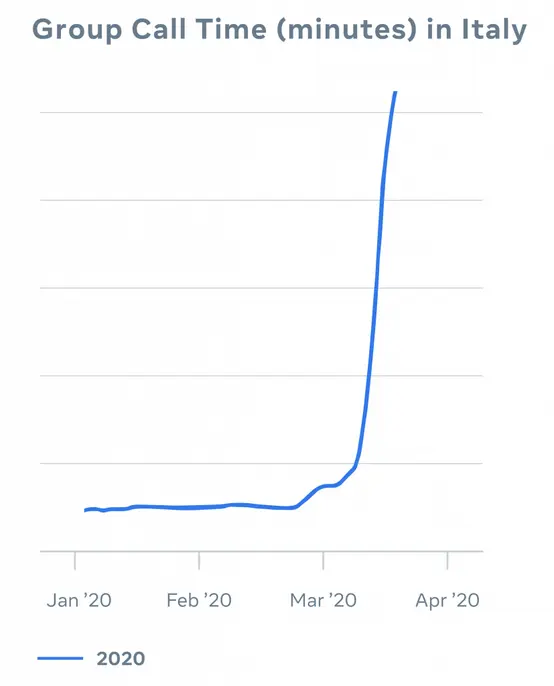
Another popular type of software during the Coronavirus has been instant messaging apps. Facebook has seen a definite surge in the use of both Messenger and WhatsApp over the last few months. The countries with the strictest lockdowns have seen the highest use in messaging apps. Facebook has seen 70% more time spent on its apps in Italy since the crisis started. Instagram and Facebook Live views doubled in a week. Group calling (with three or more participants) increased by over 1,000% in a month.
Twitter Conversations About COVID-19 Increased 4x in March
Twitter has noted that COVID-19 was an important topic of conversation in March. Globally, conversations about the topic grew four times that month compared to February tweets.
There were a relatively consistent one million global posts per day during February that referred to COVID-19 issues. However, March saw some significant spikes, coinciding with events happening in the world. It first spiked to 5-6 million when the US stock market first jittered. Conversations then rose to 20 million per day as the US declared a state of emergency in mid-March. For the rest of March, Twitter conversations on the topic hovered between 13-20 million daily posts.
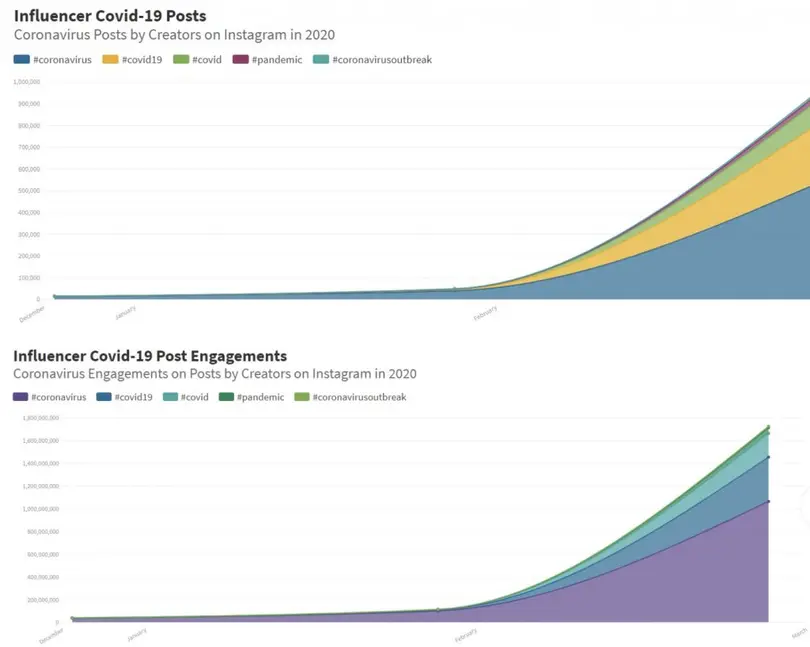
Overall Engagements on Influencer Posts About the Coronavirus Exceed 2.9 Billion
CreatorIQ analyzed more than 1.4 million Instagram influencers’ posts. They looked at posts that included the hashtags #coronavirus, #covid19, #covid, #pandemic, and #coronavirusoutbreak. The most popular of these tags was #coronavirus, which they found was used in 466,175 posts and 1,882,051,405 engagements. All up, there were more than 800,000 influencer posts that resulted in 2.9 million engagements.
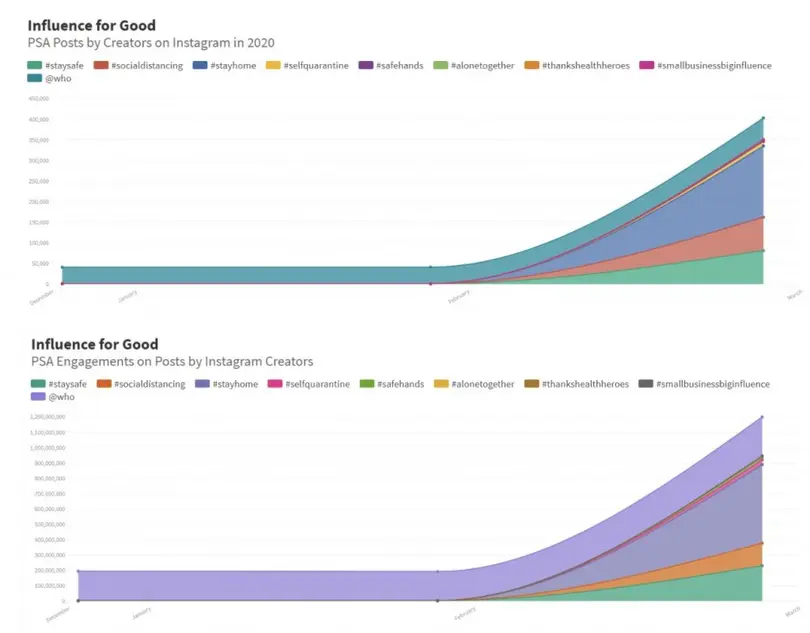
Engagements on PSA/ information-sharing posts by creators have passed 1.5 Billion.
CreatorIQ analyzed posts made by these influencers concerning PSA/ social good campaigns. Overall engagements on PSA/ information-sharing posts by creators have passed 1.5 billion, on 480,000 posts.
The most popular social good hashtag was #stayhome, featuring in 173,005 posts, and 512,286,746 engagements.
70% More Time Spent Across Facebook Apps Since the Crisis Arrived in Italy
Source: about.facebook.com
With many people having more time on their hands now, along with increasing uncertainty about what is happening around us, it is unsurprising that people have turned to social media. Also, in places where people are in lockdown, they have used videoconferencing and messaging apps to remain in contact with families, friends, workmates, and clients.
Facebook has released statistics relating to the use of their family of apps in Italy since the crisis arrived there. They have seen 70% more time spent across their apps. Instagram and Facebook Live views doubled in a week. They saw messaging increase over 50% and time in group calling (calls with three or more participants) increase by over 1,000% during March.
Google and Facebook Predicted to Lose More Than $44 Billion in Worldwide Ad Revenue

Source: swarajyamag.com
Despite people spending increased time on Facebook and increasing their overall time online, both Facebook and Google are likely to lose considerable ad revenue in 2020.
Google total net revenue for 2020 is now projected to be about $127.5 billion, down $28.6 billion compared to Cowen & Co’s prior estimate (an 18% decline). They estimate that Facebook ad revenue for the year will be $67.8 billion, a drop of $15.7 billion (19%) from previous estimates.
Just 4.5% of US Consumers Say They Will Have Both the Ability and Confidence to Spend on Retail Goods Post-Lockdown.
The Coronavirus has arguably caused the most significant shock to the world economy since the Great Depression of the 1930s.
GlobalData has released some stats showing evident concern over US consumer spending post-crisis. A mere 4.5% of US consumers say they will have both the ability and confidence to spent on retail goods post-lockdown. 22.5% say they will have neither the ability to spend nor the confidence to do so.
Only 15.9% say they are confident about spending.
TV Set Viewing Averaged 219 Minutes a Day
TV viewing has soared as more people have to stay home in isolation and lockdown. TV set viewing in the UK reached an average of 219 minutes a day for the week ending 5 April. Although this was slightly down on the previous week, it was almost 40 minutes more than the same week in 2019.
These figures don’t include non-BARB (Broadcasters' Audience Research Board) reported channels, such as Netflix, which added a further 96 minutes a day.
56% of Brands Say They’re Experiencing Logistics Delays with Their Supply Chain
Source: klaviyo.com
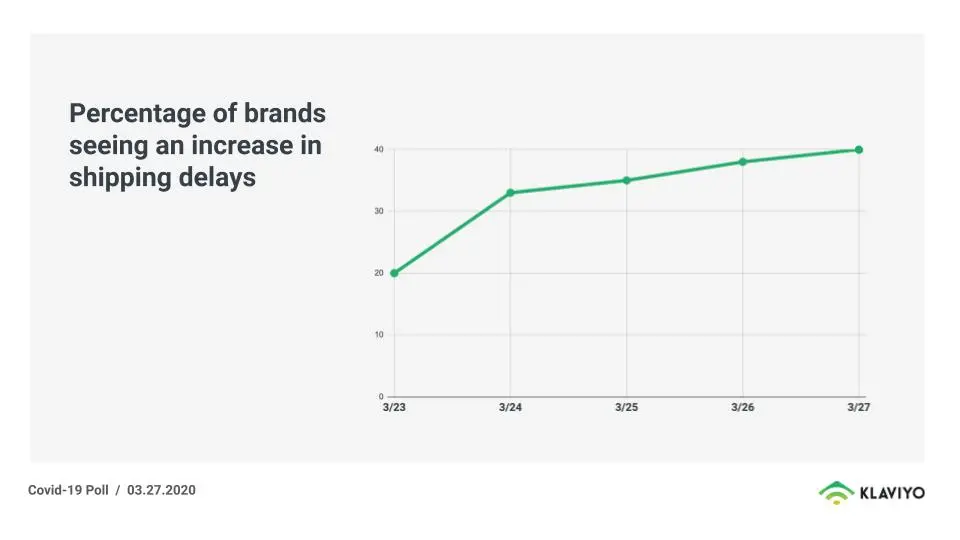
As much as some brands claim increasing sales, the logistics of shopping is getting worse. More brands now claim they experience issues with shipping. 40% of brands now say they’re experiencing shipping issues, and two brands say that shipping is not only delayed, but it’s also now costing a premium. 56% also say they're having problems with their supply chain, either because a factory is closed or because their suppliers have temporarily paused production.
An Increase in Brands Saying They’re Spending More on Ads
Source: klaviyo.com
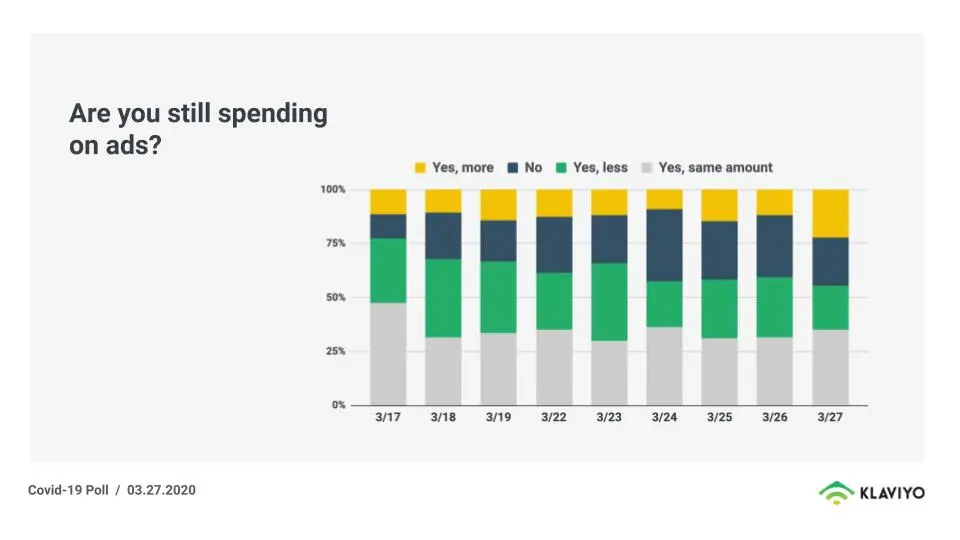
Many in KLAVIYO’s network still have a positive outlook in terms of advertising. 22% of brands say they’re spending more on ads. Unsurprisingly the bulk of the increased advertising comes from brands that mostly sell higher demand essentials and niche non-essentials.
Cost Per 1,000 Impressions Are Down and Cost Per Click is Flat or Down
The brands continuing to advertise online have seen the cost per 1,000 impressions (CPMs) fall and the trend in the cost per click (CPC) flat or down, This has resulted in their return on advertising spend (ROAS) trending much higher than usual.
One Brand that Sells Firearms and Supporting Accessories Is Reporting Sales Are Up 450%
One of the side effects of the COVID-19 crisis has been heightened fear levels across the globe. This is particularly evident in the USA, which has seen an enormous increase in demand for firearms. Gun Stores are considered an essential service in many areas, allowing them to remain open. This hasn't stopped a rush on gun stores, however, both in the USA and other nations.
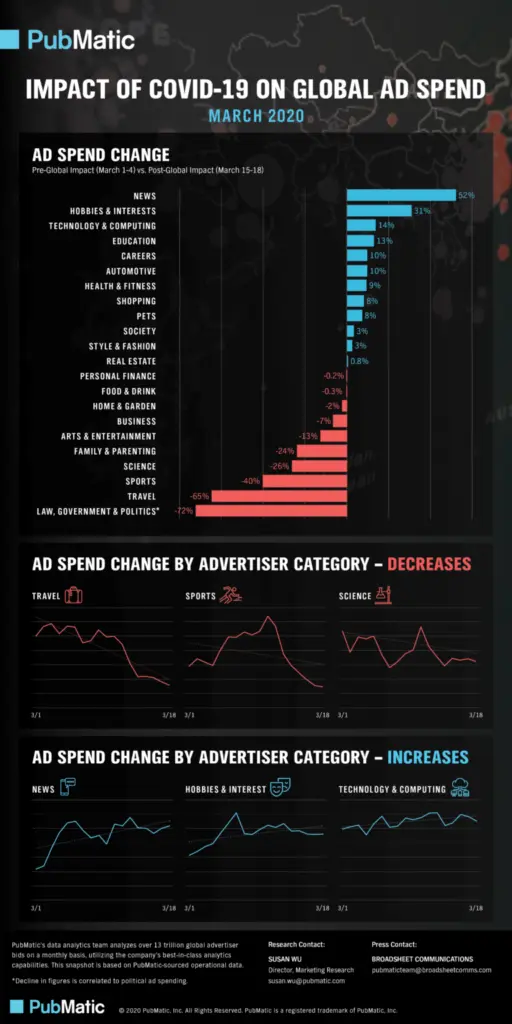
52% Increase in Ad Spend by News Sector
The Coronavirus has had a massive impact on the media; however, its effects haven't been equal. There are clear winners and losers. There has been increased interest in news, and this sector saw a 52% increase in ad spending from before the global impact (March 1-4) until after (March 15-18). Other areas to have seen rises in ad spending in that timeframe include hobbies & interests (31%), technology & computing (14%), and education (13%). Notably, these are all activities that can be consumed at home.
65% Decrease in Ad Spend by Travel Sector
Of course, many sectors have cut back on their advertising activity.
Interestingly, the most significant drop in ad spending is for law, government, and politics (72% drop), presumably because governments have refocused their activities, shuttering government departments in many areas. The worst private-sector group is travel, which has almost come to a standstill in many places. It should be no surprise that advertising spending is down 65% here – nobody is booking holidays at present. There were also noticeable drops in ad spending on sports (40%), science (26%), and family & parenting (24%).
Ad Spend on E-Commerce Doubled in the US in Period Between Mid-February And Early-March

Source: marketingdive.com
e-Commerce companies have clearly seen the opportunity for increased sales and doubled their ad spending in the four weeks between February 17 and March 9. Brands that operated both an online and physical presence have apparently moved their marketing to the web. Ad spend from e-Commerce sites doubled from $4.8 million for a trailing four-week period starting on February 17 to $9.6 million for the week of March 9.
58% of People Ages 18 to 39 Claim to Have Ordered Grocery Items Online for Store Pickup in the Month to March 12
Online shopping seems to be particularly popular with Millennials and Generation Z. 58% of people aged 18 to 39 say they have ordered grocery items online for store pickup, and 30% say they have increased their online purchases in the month to March 12. If you look at all ages, 34% ordered grocery items for store pickup, and 25% had increased purchases.
30% of Shoppers Claim to Have Bought Hand Sanitizer
We have all seen shortages of things that people believe essential to their survival through the crisis. A video showing two Australian women fighting over toilet paper in the supermarket went viral. Hand sanitizer might not have been on everybody’s shopping lists before the pandemic, but it is much demanded now. 30% of shoppers claim to have stocked up on hand sanitizer, which is higher than disinfecting wipes (28%), household cleaners (25%), antibacterial hand soap (24%), paper products (24%), bottled water (22%) and canned foods (20%).
Coronavirus Lead To 20.5% Drop of Sales in China
With Coronavirus first appearing in China, the rest of the world has kept a close eye on statistics released by that nation. Many shops, factories, and other businesses shut for a prolonged period, and are only beginning to recover now. Retail sales were 20.5% lower in January and February compared to the previous year. Industrial output plunged 13.5% during the same timeframe.
Travel Industry Expected to Lose $820 Billion
The travel industry has been particularly badly hit. The global business travel sector is expected to take a revenue hit of about $820 billion, with China accounting for nearly half of the losses. This prediction was made in mid-March, however, and the financial hit is likely to be higher now. It is now spread more evenly across the world. China saw a 95% drop in business travel since the outbreak and is expected to lose $404.1 billion in revenue from corporate travel.
Nearly 50% Decrease in Traffic to Travel Sites
Not only are people spending less on travel, but they are also taking less interest in options for leaving home. There has been a decrease of nearly 50% in traffic to travel websites. Even those stuck at home on lockdown aren’t dreaming about future trips they could make.
Greater than 30% Increase in Traffic to Media Sites
The biggest winner, in terms of traffic to their websites, is the Media sector. In reality, not all companies are performing well here, though. Some traditional media, like printed magazines, are struggling with reduced circulation and delivery options. However, people are flocking to news websites to keep up on the latest COVID-19 development.
Nearly 60% Increase in Conversion to Food Sites
Of course, what interests a firm most is its conversions. It's all very well having visitors to your website, but it is far more valuable if your visitors spend money while they are there. Some areas, such as the Finance Sector, have seen noticeable increases in traffic, but sizeable drops in conversions. The food sector stands out in terms of conversions, with a nearly 60% increase in conversions. This is a clear result of people shifting their grocery shopping online. Many people would like this statistic to increase further, but supermarkets will have to increase their delivery capacity and logistics before they can improve this by much more.
Nearly 50% Decrease in Conversion to Construction Sites
Interestingly, travel hasn’t had the greatest drop in conversions (although at just over 40% it is highly noticeable). There is clearly less construction occurring at the moment, and this has resulted in a drop of approximately 50% in construction site conversions.
65% Of Chinese Claim to Shop Online More
The Chinese were the first to feel the effects of COVID-19. Their government brought in tough isolation measures, meaning that few citizens could go out to shop. A side-effect of this is that 65% of Chinese now claim to shop online more.
42% of Britons Use Less Cash

Source: reuters.com
With the combination of increased online sales, lockdowns, and a general unwillingness to touch currency that has been in the hands of others, many people are moving away from cash. This is particularly so in the United Kingdom. Britons are using much less cash to purchase things, and they’re not hoarding cash either, according to a report by Quartz. ATM usage is way down, and people are using less real money as they try and stay away from germs.
10.9% Increase in Consumer Packaged Goods Sales in Italy Due to the Coronavirus Pandemic
We have all heard about the panic buying that occurred in many places around the globe. Many people have tried to stock up on essentials, so they can isolate themselves from people and the virus. This is particularly evident when looking at the change in consumer packaged goods sales due to the coronavirus pandemic worldwide in March 2020. These figures relate to the week ended March 8, 2020. Sales of consumer packaged goods rose 10.9% in Italy, 9.5% in the USA, 9% in France, and 8.2% in the UK.
$53 Average Transaction in Grocery and General Merchandise Stores
Source: statista.com
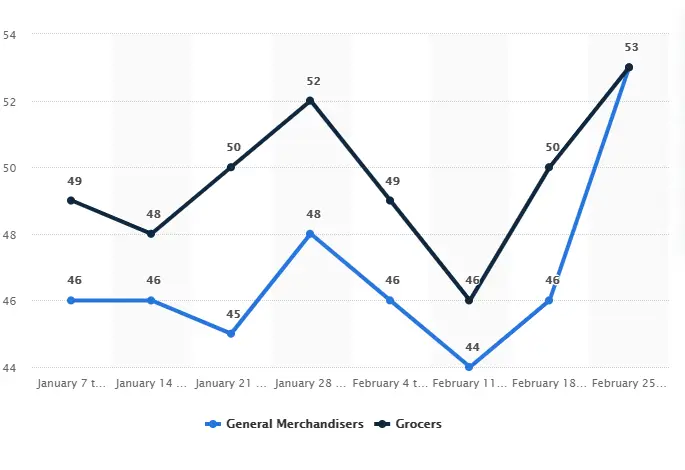
Statista gives an insight into people’s spending. Their US statistics don’t yet show the full impact of COVID-19, but you can see spending changes beginning to take effect. In the week of January 7 to 13, the average transaction in grocery stores was $49, and $46 for general retail stores. Although these numbers fluctuate over the next two months, there was a notable increase to $53 for both types of stores by mid-March.
91.6% in Trips for Refrigerated Milk Substitutes
Of course, just because people can't afford to increase their spending by a great amount, doesn't mean that they don’t change the composition of what they buy. There were a couple of big increases in US grocery and drug store product trips during February. Sales of refrigerated milk substitutes rose 91.6% compared to the same month last year. Other notable increases were hand sanitizers (64.1%), frozen breakfast food (46%), and eye care products (40.8%). Even personal thermometer sales increased by 26.8%. This was in February. March and April statistics could look very different yet again.
347.3% Increase in Sales of Oat Milk in The USA Due to the Coronavirus
Statista separates the sales growth of food and beverage products due to Coronavirus in the United States as of the week ending March 7, 2020. The largest increase (presumably coming off a small base) was in oat milk, with a 347.3% increase. Powdered milk alternatives increased sales by 126.3%. Other staples to sell strongly include dried beans (62.9%), canned meat (57.9%), Rice (57.5%), and Chickpeas (47.3%). There was even a 42% increase in sales of water.
59% Increase in Sales of Paper Products
When you look at the changes in dollar sales of non-edible groceries due to the coronavirus pandemic in the United States for the week ending March 8, 2020, you see that the greatest increase, 59% comes for the category Paper Products. Presumably, the greatest increase here will be in toilet paper sales. Home care products also saw a 40% surge in sales.
385.2% Increase in Sales of Aerosol Disinfectants
The sales growth of cleaning products is the most noticeable, however. Sales of aerosol disinfectants increased 385.3% year on year. This was followed by bath & shower wipes (180%), and multipurpose cleaners (148.2%). If you struggle to find these products on the shelves now, you can understand why. It is unlikely that the manufacturers of these products have to worry too much about marketing at the moment. However, they may have to later if people are left with significant stocks on hand at the end of the pandemic.
161.4% Increase in Traffic to Supermarket Websites
There has been a significant shift in the types of websites that people go to for their eCommerce. Demand for online supermarket shopping has grown dramatically, outstripping capacity in many areas. This has resulted in a 161.4% increase in traffic to supermarket sites in March, compared to just a month earlier. Media and telecom websites have also seen an increase in popularity. The biggest eCommerce losers have been entertainment/events (-57.3%) and tourism (-56.8%).
Source: pubmatic.com
218% Increase in Use of the Instacart Grocery Delivery App
People in the USA have also been downloading supermarket grocery delivery apps in greater numbers. In the period between mid-February and mid-March, there were 218% more downloads of Instacart, 160% more downloads of Walmart Grocery, and a 124% increase in the use of the Shipt app.
74.6% Of US Consumers Avoiding Shopping Centers and Malls
US consumers have stayed away from malls and shopping centers in droves. 74.6% of surveyed US consumers say they intend to avoid shopping centers/malls, compared to 52.7% avoiding shops in general.
45% Of US Consumers Intend to Spend More on Home Cleaning Products
When surveyed in mid-March about their shopping intentions, 45% of US consumers expected to spend more on cleaning products, with 48% saying they will make no change. Surprisingly 2% say they will spend less – perhaps these are those who have already stockpiled and now have large supplies on hand.
89% Of Britons Believe Stockpiling Has Caused Shortages
The Australians may have received the most press coverage for their fights while stockpiling toilet paper, but there are a few other countries who also have concerns about stockpiling. People were asked the most likely perceived cause of food and supply shortages in local grocery stores due to Coronavirus worldwide. 89% of UK consumers believe stockpiling is the reason for shortages of food and other grocery products. The Australians aren't far behind, though, with 86% blaming stockpiling for shortages.
47% Of US Retail Businesses Expect Revenue to Fall
When questioned in mid-March, US businesses were already pessimistic about the future. 47% expected some downside revenue implications, although a further 33% thought it too early to say at the time of the survey. At that point, 9% expected significant downside revenue implications, a number likely to be higher in the next survey.
58% Of US Consider the News Media Their Main Source of Coronavirus News
When asked about what was the most used source for information about the Coronavirus in the United States, 58% stated the news media, followed by 20% who gained their information from government/health agency websites. Only 7% relied on posts from friends and family on social media. However, these numbers do vary greatly by age. 70% of those over 55 rely most on the news media, compared to just 27% of those aged 18-24. 2% of those over 55 gained their information from social media posts, compared to 14% of 18-24 year-olds. Perhaps of more concern are the 3% who claim that they haven't been getting information about COVID-19 from any source.
16% Claim They Will Spend More on Videogames as a Result of Coronavirus

Source: cnet.com
While 61% of US consumers 18 and older don't expect to change their video gaming habits as a result of the Coronavirus, 16% expect to buy more games, presumably because they intend to spend more time at home. 8% say they will spend less on video games, perhaps a reflection of an expectation of tough times ahead.
18% Of Millennials and Generation Z Intend to Spend More on Music Streaming Services as a Result of Coronavirus
US consumers were asked about their expectations concerning paying for music streaming during the coronavirus outbreak. In the first week of March, 14% of Generation Z claimed they would increase their music streaming. This figure rose to 18% a week later, however. Millennials had similar views. A smaller 10% claimed they would increase their music streaming in the March 6-9 poll, but this rose to 18% on March 13-16.
UK Retail Industry Forecast to Lose £12.6 Billion in 2020
GlobalData published a new forecast on March 24, showing that they expected UK retail sales to plummet. They believe the overall UK retail industry will see a loss of £12.6 Billion this year. Clothing and footwear brands are predicted to fall the furthest, seeing a sales decline of 20.6% to £11.1 Billion.
Online Fashion Sales Fall 30%
Nosto took a data snapshot of the Fashion, Apparel & Accessory industry from March 1 through 25, 2020. All eCommerce KPIs are down for 2020 compared to 2019. At the lowest point in their sample for sales (Friday, March 20), global Fashion, Apparel & Accessories sales revenue had dropped over 30% from the March 1st baseline.
One in Ten UK Consumers to Use Foodservice Delivery for First Time
One industry that is booming at the moment is food delivery. Indeed the delivery services of many supermarkets around the globe are at capacity, and it can be challenging to access food delivery for many consumers. Consumer research company, The NPD Group, found that one in ten in the UK is set to try foodservice delivery for the first time as a result of the COVID-19 coronavirus crisis. UK supermarkets, Sainsbury’s, Tesco, and Waitrose have announced they are prioritizing the elderly and vulnerable with deliveries.
Just 8% Think Brands Should Stop Advertising
Kantar surveyed 35,000 consumers globally about their views on brands advertising through the COVID-19 crisis. Only 8% thought brands should stop advertising. However, consumers do believe that it shouldn't be business as usual for marketers and advertisers. 78% of consumers think brands should help them in their daily lives. 75% say that brands should inform people of what they’re doing, and 74% think companies should not exploit the situation.
61% Of UK Marketers Expect a Drop in Demand for More than Two Quarters
Marketing World and Econsutancy surveyed 887 UK brand marketers. 39% say their company has already experienced lowered demand for its services, while 61% expect to see this lowering of demand continue over the next two quarters. Of that 61%, 36% expect a drop of more than 20% in demand.
Only 14% of UK Marketing Campaigns Continue as Planned
By the end of March, UK marketers realized the need to change their previously planned marketing campaigns. In a survey by Marketing Week and Econsultancy on March 31, 86% of the respondents indicate that they are now delaying or reviewing their campaigns. This leaves a mere 14% of UK marketing campaigns continuing as initially planned.
This is a significant change from only a fortnight previously when Marketing Week and Econsultancy found that 55% of marketers had postponed or were reviewing ad campaigns, while 60% were cutting or reviewing budgets. At that point, 55% had paused product or service reviews.
The reality is that much pre-booked advertising is irrelevant and inappropriate to the situation, particularly in places that have a lockdown with limited shopping capabilities.
120% Increase in Sales of Canned Meals by New Zealand Supermarkets
The pandemic has caused problems for marketers and brands across the world. Consumers have stockpiled their pantries with shelf-stable food products. In New Zealand, sales of canned meat grew 120% in the four weeks to March 22. This was closely followed by rice (118%), and canned and dried vegetables (110%). Non-food grocery lines where sales more than doubled in a month were toilet tissues (116% increase), cough and cold treatments (113%), household cleaners (103%), and personal wash (100%). Notably, a few companies making these products have now changed their marketing to focus on being kind and fair to others, rather than trying to boost sales further.
34% Have Cancelled an Advertising Campaign Completely
The Coronavirus has had a significant impact on pre-booked advertising campaigns. 34% of advertisers claim they have canceled a campaign altogether (pre-launch), and 45% have stopped or pulled a campaign mid-flight. 38% have paused all new advertising efforts until later in the year. Overall, 89% have taken some action with their ad budgets.

Source: inma.org
68% Expect COVID-19 To Result in Reduced Ad Spend Into 2021
69% of advertisers expect COVID-19 to have a significant impact on their ad spending in Q2 2020. This number reduces to 28% for Q3 2020 and 11% for Q4. However, 68% expect that the pandemic will still have some impact leading into 2021.
47% of Display Ads Have Been Paused, Cancelled, or Pulled
The changes in advertising spend differ significantly by media type. The biggest loser is display advertising, with a 47% reduction in budget spend. Paid social media has also suffered a 45% drop. Linear tv sees 42% pause, cancel, or pull budget. Paid search continues more normally, however, with a comparatively smaller 24% drop in budget.
Dramatic Drops in Advertising at Sports Events
A good chunk of the canceled advertising relates to live sports events. Most sports are canceled or postponed at the moment, meaning that sports-related advertising is also on hiatus. For example, 77% of firms declare they have no intention to advertise during soccer in any form in the coming weeks.
65% Believe that Coronavirus will Result in Advertisers Focusing Spend with Media That Can Show Direct Sales Outcomes
When asked about how they believed the Coronavirus outbreak would affect the advertising industry, 65% either somewhat or totally agreed that Coronavirus would result in advertisers focusing spend on media that can show direct sales outcomes.
Instagram Has Seen a 14% Drop in Engagement by Followers
Despite more people being at home, using the internet, there has been a drop in social media engagement. This is not consistent across all social networks, however. Instagram has suffered most overall, with a 14% drop in engagement rate by follower for the week ending March 11 versus the previous three weeks. Facebook isn’t far behind, with a 13.5% drop. Twitter has performed better, with only a 7% drop. Clearly people are still turning to Twitter for critical information and news, and then retweeting and discussing these topics.
69% of UK Organizations See Drop in Demand for Their Services
With much of the UK in lockdown, there has been a massive drop in demand for many goods and services. Data from Econsultancy and Marketing Week surveys suggest that 69% of UK organizations have experienced a decline in demand for their products and services.
These results are worse for small and medium-sized businesses (SMEs) than for large. 77% of SMEs with annual revenue of less than £50m have seen a drop in demand for their services, compared to "only" 64% of big businesses.
The large companies do still have some problems, however. 44% claim to have experienced some impact on their supply chain, compared to 32% of SMEs.
UK Supermarket Sales Rise 20.6% in March
While many businesses have suffered catastrophic declines in demand and sales in March, some essential services were overwhelmed by the demand for their services. Supermarkets are a case in point. UK supermarkets saw a 20.6% rise in sales during March. In the four weeks leading to March 31, the public spent £10.8 billion on groceries, which exceeds all previous periods, including the run-up to Christmas.
British shoppers have increased their trips to the supermarket. In the week beginning March 16, 88% of households made an average of five shopping trips to supermarkets between Monday to Thursday. The average UK household spent an additional £62 on groceries in the past month.
Retail Email Open Rates Rise 25% Week-on-Week
A possibly surprising stat relates to email open rates during the time that consumers stay at home. Email open rates have risen by up to 25% week-on-week in retail. Clearly, people have more time on their hands at the moment and can devote more of it to opening and reading their emails.
Daily email open rates are generally increasing by 5-10% each week.
Another related change is that email opens and interactions have increased more on desktop than mobile. Clearly, more people are working at home on their laptops, which they use to check their emails, rather than their smartphones, as they have previously. Reading email communications on the desktop provides a less distracting browsing experience than on mobile devices, and consumers are taking more time to read longer content.
Predicted £12.6 Billion Loss for UK Retail Industry in 2020
A forecast by GlobalData published in late March predicts that the overall UK retail industry will suffer a loss of £12.6bn this year. The clothing and footwear industry is predicted to suffer the worst decline, with sales falling 20.6% to £11.1 billion.
Images of Human Interaction Drops 27.4% in Social Ads
A study by Pattern89 has noticed an evident change in the imagery used by brands in social media ads during the time of the Coronavirus. They found 27.4% fewer image and video ads on Facebook and Instagram depicting models displaying human interaction, such as hugging or shaking hands.
There has been a significant increase in a few specific image types since mid-March, however. For example, images and videos displaying water splashing, hand/face washing, or cleaning have risen at six times the regular rate.
20x Increase in Italian YouTube Watching in February
One of the earliest countries to face a COVID-19 lockdown was Italy. Obviously, with the population stuck at home, they had to do something with their time. Many used their spare time to watch YouTube videos. There was 20x growth in YouTube viewing numbers in Italy between the first and last days of February. Although these stats don't include March, it is probable that the viewer numbers increased even further over that month.
UK YouTube watching time "only" grew 6.5x in February, but that probably merely reflects the fact that Coronavirus took longer to take hold there.
External Sources
RivalIQ
BVADoxa
KLAVIYO
PubMatic
Marketing Dive
Neil Patel
Statista
Econsultancy
Nosto
Essential Retail
Marketing Week
Nielsen
Advertiser Perceptions
CreatorIQ
Facebook
Variety
Marketing Week (GlobalData)
Stackline
KPMG
Bazaarvoice
eMarketer – Telecoms and Radio Ad Spending
CMO Survey


