For brands, social media offers an abundance of opportunities. Entrepreneurs and marketers are leveraging it to create brand awareness and generate leads. They also use it to gather data about audiences and reach them effectively. In fact, most marketing strategies revolve around social media today.
Social Media Schedulers play a crucial role in maximizing the effectiveness of these strategies. Marketing strategies that are backed by relevant statistics inspire trust. They can secure stakeholder buy-in more easily. It’s also easier to budget and forecast social media marketing efforts, if you have numbers to guide you.
If you’re an influencer or agency relying heavily on social media, you’ll need to know the latest trends on various social networks. Using this data, you can plan effective outreach and marketing programs.
That being said, it can be a pain to search for the right data. To make your life easier, the Influencer Marketing Hub team has collated all the most important social media statistics from verified sources. Here’s what you need to know in 2024.
70+ Essential Social Media Statistics for 2024:
Facebook Statistics
Now let’s take a closer look at the social media statistics for Facebook, specifically.
General Usage Statistics
- On average, Facebook has 2.08 billion daily active users. What’s more, it has nearly double that amount of monthly active users. (Statista)
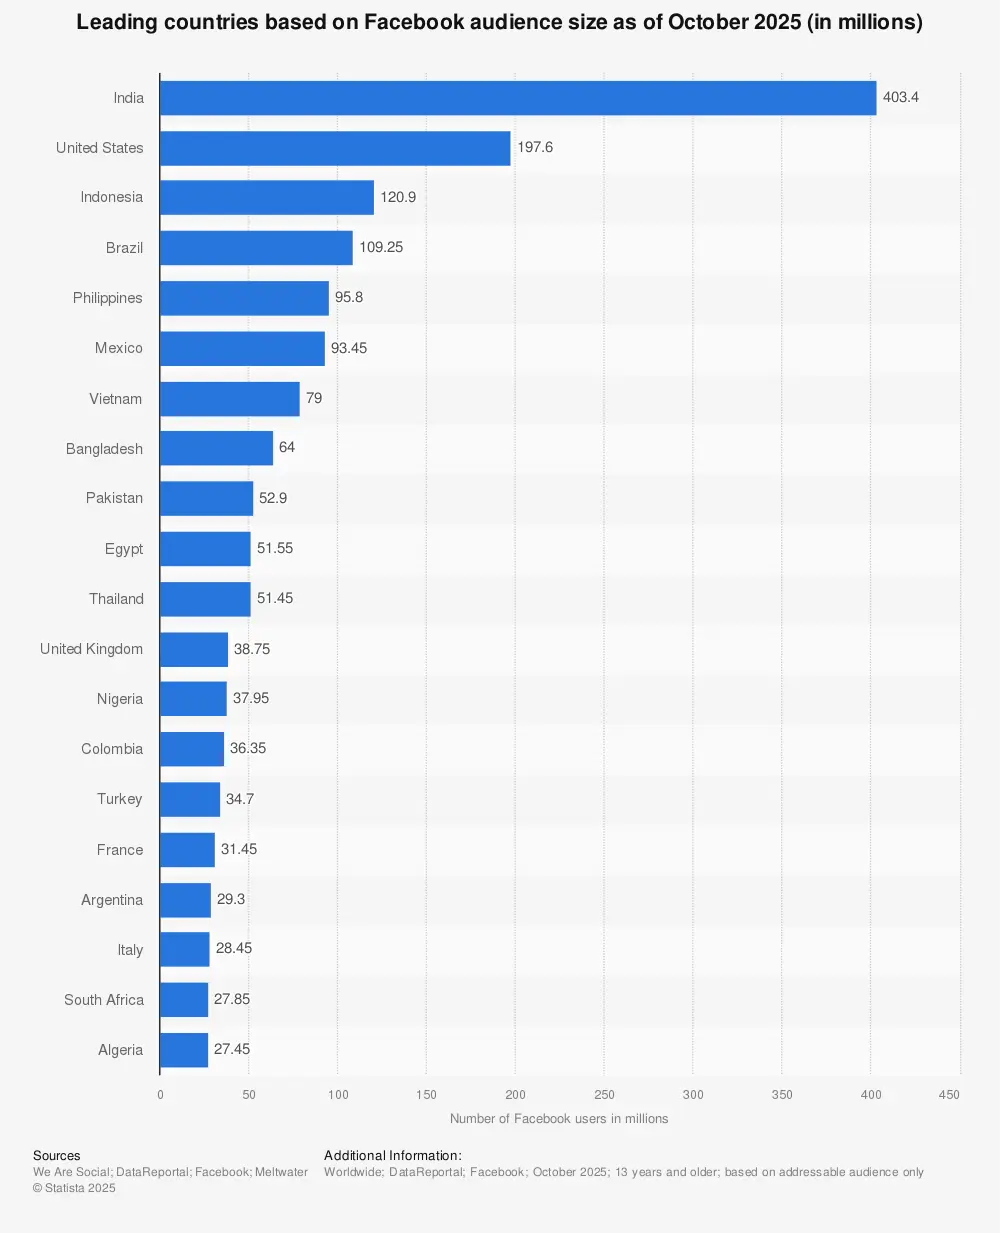
- India is the country with the biggest Facebook audience size in terms of users. There were nearly 315 million users as of January 2023. It’s followed by the United States with 175 million users and Indonesia with 119.9 million users. (Statista)
- It’s anticipated that by 2027 there will be nearly 255 million Facebook users in the United States. (Statista)
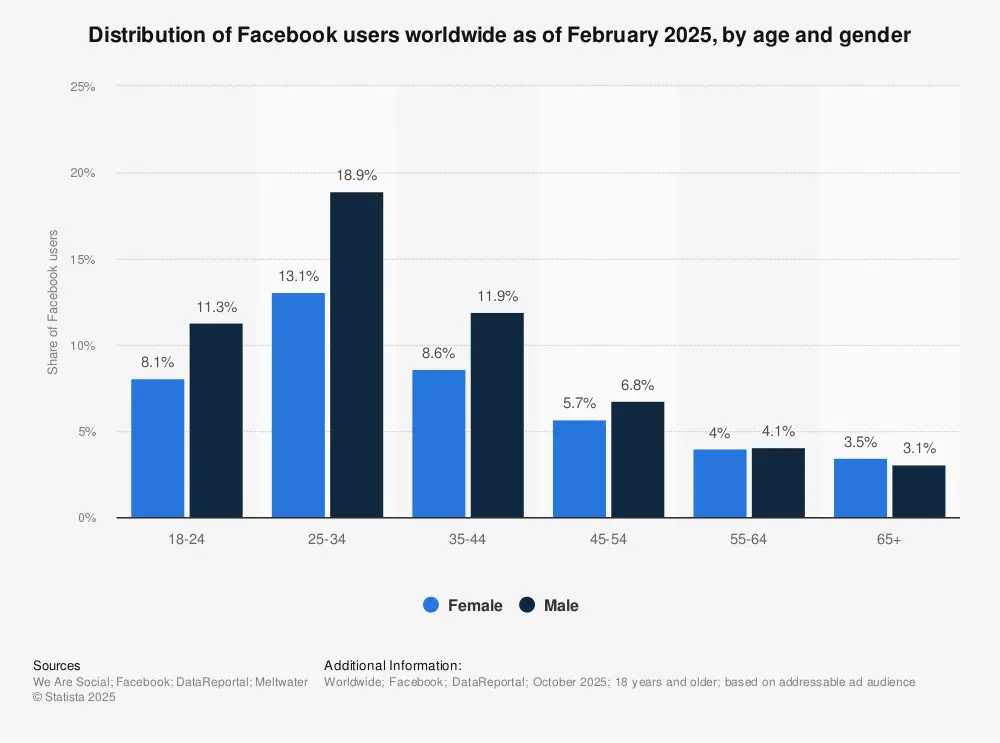
- Male users between 25 and 34 years of age constitute the largest proportion (17.6%) of Facebook users. The next largest user base is made up of male users in the 18-24 years age bracket. (Statista)
- 98.5% of users access Facebook via mobile devices. (Statista)
- Facebook is the 3rd most popular website across the globe and users spend nearly 10 minutes per day on the platform’s site. (Similarweb)
- 70% of US adults use Facebook each day. (Hootsuite)
- Facebook is a firm favorite among businesses. More than 200 million small businesses around the globe use its tools. (Oberlo)
Facebook Statistics for Businesses/Marketers
- According to Facebook, the potential target audience that can be reached by means of ads on the platform are 2.08 million. (Hootsuite)
- Along with YouTube, Facebook is the social media platform that’s the most widely used. What’s more, its user base is also the most broadly representative of the US population as a whole. (Pew Research)
- It’s anticipated that Facebook will continue to be the dominating social network till the end of 2024. (eMarketer)
- Just over 1 billion Facebook users speak English. (Hubspot)
- Facebook is used on average by 31% for local news. (Reuters Institute Digital News Report)
- The average Facebook page post engagement rate is currently the highest (0.45%) for pages with fewer than 10,000 fans. (Hootsuite)
- Just over 17% of Facebook’s active users access the platform via their desktop. (We are Social)
- More than 56% of its advertising audience is male. (Hootsuite)
- As of January 2023, about 61% of Facebook users were younger than 35. (Statista)
- Facebook flags and removes more than a billion registered user accounts before they become active on the platform. (HubSpot)
- There are more than 10 million active advertisers on Facebook. (Statista)
- On average, a Facebook user clicks on 12 ads per month. (Omnicore)
- Nearly 20% of US adults have bought a product by means of Facebook. (eMarketer)
- About 66% of Facebook users across the world visit the page of a local business at least once a week. (Facebook)
- The average click-through rate (CTR) for Facebook ads is 0.9%. (Wordstream)
- The average cost per click (CPC) for Facebook ads is $1.72. (Wordstream)
- The average conversion rate for Facebook ads is 9.21%. (Wordstream)
- The average cost per action (CPA) for Facebook ads is $18.68. (Wordstream)
Instagram Statistics
Now that we understand more about Facebook, let’s take a closer look at the stats for Instagram to keep an eye on for 2024 and beyond.
General Usage Statistics
- It’s predicted that by 2025, there will be close to 1.44 billion Instagram users. (Statista)
- India is the country with the biggest Instagram audience size in terms of users. There were just over 229 million users as of January 2023. It’s followed by the United States with 143.35 million users and Brazil with 113.5 million users. (Statista)
- About 40% of Americans use Instagram. (Pew Research Center)
- The majority of adult users in the United States (59%) use the platform at least once a day. (Pew Research Center)
- Nearly 40% of adult users in the United States use Instagram several times per day. (Pew Research Center)
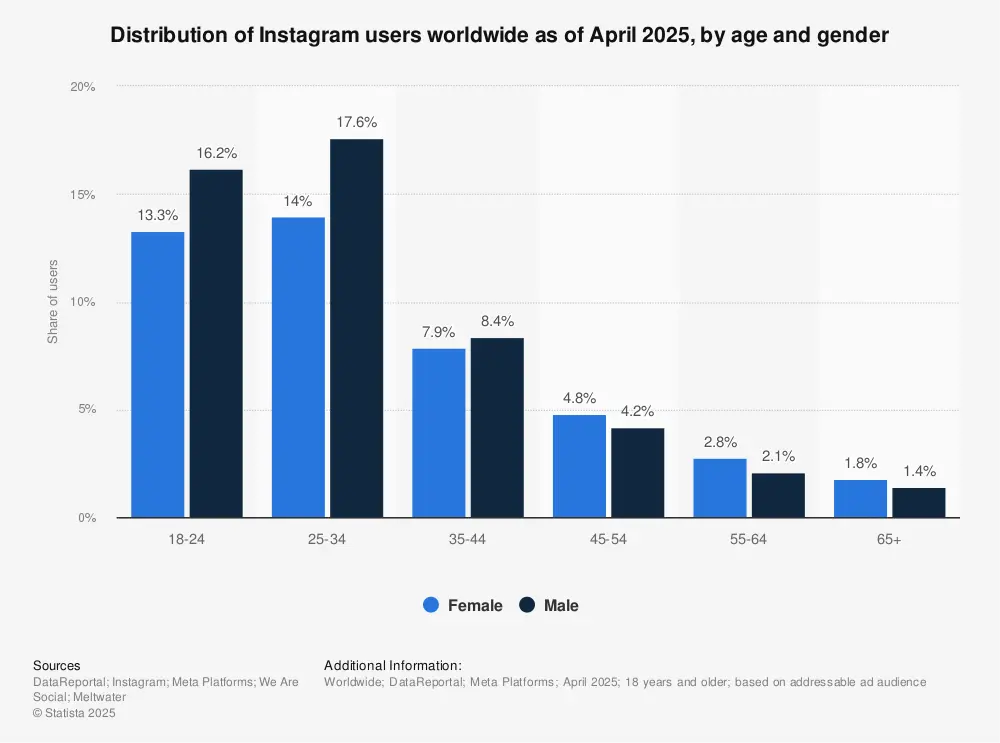
- As of January 2023, more than half of the platform’s global population were younger than 35. (Statista)
Instagram Statistics for Businesses/Marketers
- Photo posts are still the most common type of content, with videos posts making up nearly 20% of all main feed posts and carousel posts adding up to just over 17%. (Hootsuite)
- Just over 50% of its advertising audience is male. (Hootsuite)
- Business accounts with fewer than 10,000 followers have the best engagement rate (1.11%). (Hootsuite)
- The engagement rates for business accounts with 10,000 - 100,000 followers and 100,000+ followers are 0.93% and 0.76% respectively. (Hootsuite)
- The most popular hashtags on Instagram of all time include #love, #instagood, #fashion, #photooftheday, and #art. (Hootsuite)
- Just over 11% of US adults have bought a product by means of Instagram. (eMarketer)
- 90% of people on Instagram follow at least one business. (Instagram)
- About 66% of users say that Instagram helps them to interact with brands. (Instagram)
- Half of Instagram users are more interested in a brand when they see an advertisement for it on the platform. (Instagram)
- About 11% of US adults have indicated that they regularly get news via Instagram. (Pew Research Center)
- Over 80% of people rely on Instagram for researching services and products. (Hootsuite)
- 130 million Instagram users click on shopping posts per month. Considering its popularity among users, this feature promises to be effective for business owners and social marketers. (Hootsuite)
- The average Instagram business account posts at least one post each day. (Hootsuite)
X (formerly Twitter) Statistics
Now that we’ve covered the stats for Facebook and Instagram, let’s take a closer look at X (formerly Twitter).
General Usage Statistics
- As of the 2nd quarter of 2022, X (formerly Twitter) boasted 237.8 million monetizable daily active users across the world. (Statista)
- The United States is the country with the biggest X (formerly Twitter) audience size in terms of users. There were 95.4 million users as of January 2023. It’s followed by Japan with just over 67.45 million users and India with 27.25 million users. (Statista)
- It’s anticipated that by 2024, there will be more than 340 million X (formerly Twitter) users worldwide. (eMarketer)

Source: emarketer.com
- Twitter is the 16th most active social media channel across the globe. (Statusbrew)
- Almost 6.1% of the globe’s population use X (formerly Twitter). (Statusbrew)
- About 6,000 tweets get posted per second. (Hosting Tribunal)
Twitter Statistics for Businesses/Marketers
- Most of X's (formerly Twitter) annual revenue comes from advertising services. In 2021, it generated over $4.5 billion dollars via advertising. (Statista)
- 47% of X (formerly Twitter) users prefer brands that are culturally engaged. (Magna)
- Regarding purchase decisions, X (formerly Twitter) users are governed by these factors: prices and benefits, brand reputation, industry ratings, authenticity, and social involvement. Support for social issues is the most important factor. (Magna)
- In 2021, the top hashtag was #BTS. (Twitter)
- The most popular emojis in 2021 were the crying face and the face with tears of joy. (Twitter)
- Tweets that include hashtags get 100% more engagement. (Statusbrew)
- More than 40% of X (formerly Twitter) users have a college degree. (Hosting Tribunal)
- In 2021, 40% of marketers felt that X (formerly Twitter) was the most effective platform for reaching their business goals. In 2020, only about a third shared this sentiment. (Hootsuite)
- In 2022, 38% of brands plan on increasing their investment in X (formerly Twitter), while 36% plan on maintaining it. However, a quarter plans to decrease their investment in the platform. (Hootsuite)
- Nearly 79% of social media marketers will continue to invest in X (formerly Twitter) Spaces in 2022. (HubSpot)
LinkedIn Statistics
Last, but not least, let’s take a closer look at the LinkedIn stats you should know this year.
General Usage Statistics
- There are almost 1 billion LinkedIn users in more than 200 countries and territories. (LinkedIn)
- As of March 2021, only 5.7% of LinkedIn users in the United States accessed its app more than two to three times per month. (Statista)
- The average visit duration is 7 minutes and 12 seconds. (SimilarWeb)
- Nearly a third of its traffic comes from the United States. (SimilarWeb)
- Each week, 45 million people use the platform to search for jobs. (LinkedIn)
- Every minute four people get hired on LinkedIn. (LinkedIn)
- It’s currently available in 24 languages. (LinkedIn)
LinkedIn Statistics for Businesses/Marketers
- LinkedIn has over 57 million business profiles on the platform. That being said, some of these company profiles are as a result of LinkedIn automatically creating company pages. (LinkedIn)
- LinkedIn pages with complete info get 30% more weekly views. (LinkedIn)
- Businesses that post weekly see twice the engagement with their content. (LinkedIn)
- LinkedIn posts with images generally get twice more comments. Custom image collages with three to four images per post get great results for businesses. (LinkedIn)
- The optimal number of images per LinkedIn post is eight images. (OkDork)
- Titles that are between 40 and 49 characters long get the most number of post views overall. (OkDork)
- Somewhat surprisingly is that on LinkedIn, posts with multimedia assets (such as short-form videos) get fewer post views. (OkDork)
- LinkedIn posts that have headlines phrased as questions get fewer LinkedIn views. Instead, it’s better to write how-to posts or listicles. (OkDork)
- Long-form content (in other words posts that are about 2,000 words long) perform better than short-form content on LinkedIn. As a matter of fact, the longer the LinkedIn post, the better it performs. (OkDork)
- Once a LinkedIn business page has gained 150 followers, its opportunity for growth becomes exponential. (LinkedIn)
- More than 10 million members use the #OpenToWork photo frame. (LinkedIn)
- Nearly 80 job applications get submitted every second. This works out to more than 200 million job applications per month. (LinkedIn)
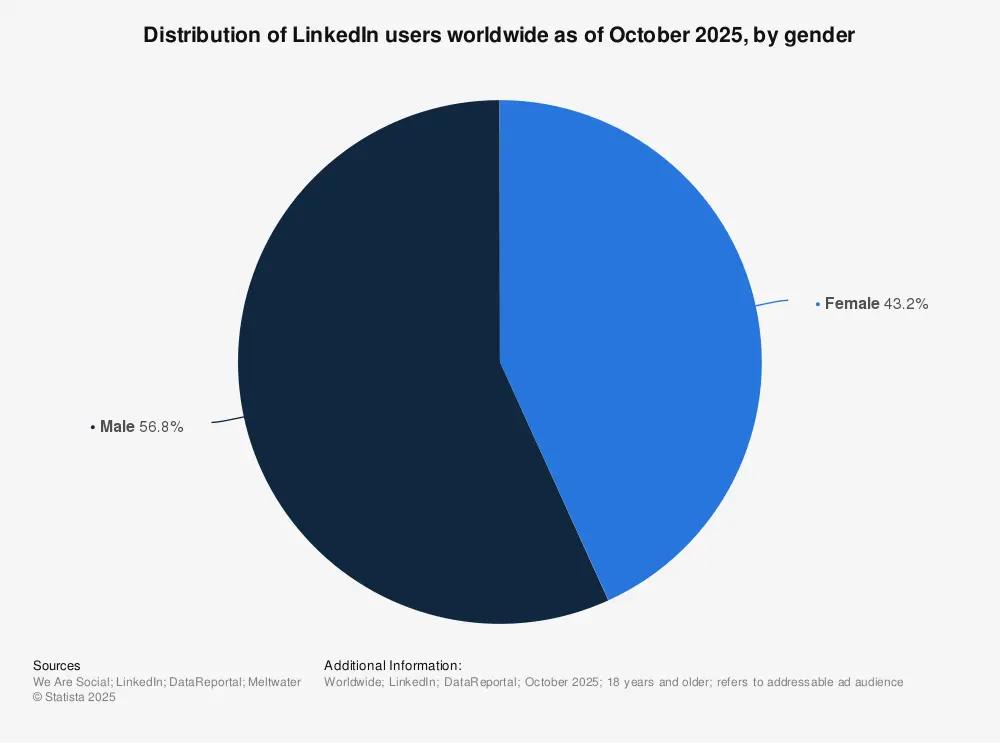
- As of January 2023, 56.3% of LinkedIn audiences were male while 43.7% were female. (Statista)
- Nearly 40,000 skills are listed on the platform. (LinkedIn)
- Almost 40% of marketers post video content on the platform and the vast majority (75%) claim that it’s effective. (Wyzowl)
- All in all, B2B marketers prefer LinkedIn for their organic content marketing. Most of them also consider LinkedIn as the platform with the best content marketing results. (Content Marketing Institute)
Wrapping Things Up
Social media is always evolving. Due to the vast audience that you can market your products to, new players keep entering this space.
To ensure that you stay ahead of your competition, you must remain updated with the latest social media usage statistics. You can use the statistics mentioned above to improve your average engagement rate and overall marketing strategy to grow your brand online. Start fortifying your presence online today.


