Shopify analytics gives brands access to a wealth of performance data, but having data is not the same as understanding it. Inside the Shopify admin, marketers and eCommerce teams can track sales, traffic, customer behavior, and campaign performance, all from a single dashboard.
The challenge is knowing what actually matters and how to turn numbers into decisions. Therefore, marketers and teams should consider these two questions:
- Are you looking at Shopify reports every week but still unsure which metrics truly reflect store health?
- And when performance changes, do you know whether the issue comes from traffic quality, conversion friction, or customer behavior?
This guide breaks down Shopify analytics from both a strategic and practical perspective. It explains what Shopify analytics tracks, how to navigate the dashboard and reports, and how marketers can use this data to make smarter, more confident decisions that drive sustainable growth.
- What Is Shopify Analytics?
- What Data Does Shopify Analytics Track?
- Understanding the Shopify Analytics Dashboard
- Shopify Analytics Reports Explained
- Key Shopify Metrics Marketers Should Track Regularly
- How to Use Shopify Analytics for Marketing Decisions
- When Shopify Analytics Is Enough and When It Is Not
- Turning Shopify Analytics Into a Growth Advantage
- Frequently Asked Questions
What Is Shopify Analytics?
Shopify analytics is the built-in data and reporting system available inside the Shopify admin that helps brands understand how their store is performing.
It brings together sales, traffic, customer behavior, and marketing data into a single interface so teams can monitor results and make informed decisions without relying solely on external tools.
At a high level, Shopify analytics is made up of two components: dashboards and reports.
Dashboards provide a real-time and summary view of key performance indicators, while reports allow marketers and eCommerce managers to dig deeper into specific areas such as sales trends, customer activity, acquisition sources, and product performance.
For marketers, Shopify analytics answers the following questions:
- Where traffic is coming from
- Which channels drive conversions
- How campaigns influence revenue
For businesses and store operators, it supports broader insights into growth, customer retention, and operational efficiency.
While Shopify analytics is not designed to replace advanced attribution or business intelligence platforms, it serves as a reliable foundation for understanding store performance and identifying where deeper analysis may be needed.
What Data Does Shopify Analytics Track?
Shopify analytics surfaces a broad set of data that helps marketers and eCommerce teams understand both what is happening in their store and why it may be happening. Breaking these data points into clear categories makes reports easier to interpret and more actionable.
Sales and Revenue Performance
This is the foundation of Shopify analytics. Brands can track total sales, net sales, average order value, discounts, refunds, taxes, and revenue trends over time. These metrics are commonly used to evaluate the impact of pricing changes, promotions, product launches, and seasonal demand shifts. It also tracks the revenue number from each individual channel and touchpoint.
Order and Checkout Behavior
Shopify provides visibility into how customers move through the checkout process. Order volume, checkout completion, abandoned checkouts, and fulfillment status help teams identify friction points that prevent conversion. For marketers, this data is essential for understanding whether performance issues stem from traffic quality or on-site experience.
Traffic and Visitor Activity
Traffic data shows how users arrive and behave on the store. Shopify tracks sessions, visitors, page views, and traffic sources such as search, social, email, and direct. This helps teams assess demand generation efforts and spot changes in channel performance over time.
Customer Behavior and Retention Signals
Customer-focused analytics highlight how shoppers interact with the brand beyond a single purchase. Metrics like new versus returning customers, repeat purchase behavior, and customer history provide insight into loyalty and long term growth potential.
Marketing and Acquisition Insights
Shopify connects sales outcomes to referral sources and campaign data, offering a high-level view of marketing effectiveness. While not a full attribution system, these insights help marketers understand which channels contribute most to revenue and where deeper analysis may be needed.
By organizing Shopify analytics data into these categories, teams can move beyond surface-level reporting and start using insights to guide smarter decisions.
Understanding the Shopify Analytics Dashboard
The Shopify analytics dashboard is designed to give teams a fast, high-level view of store performance without needing to run individual reports. For marketers and eCommerce managers, the value of the dashboard lies in spotting trends early and knowing when to investigate deeper.
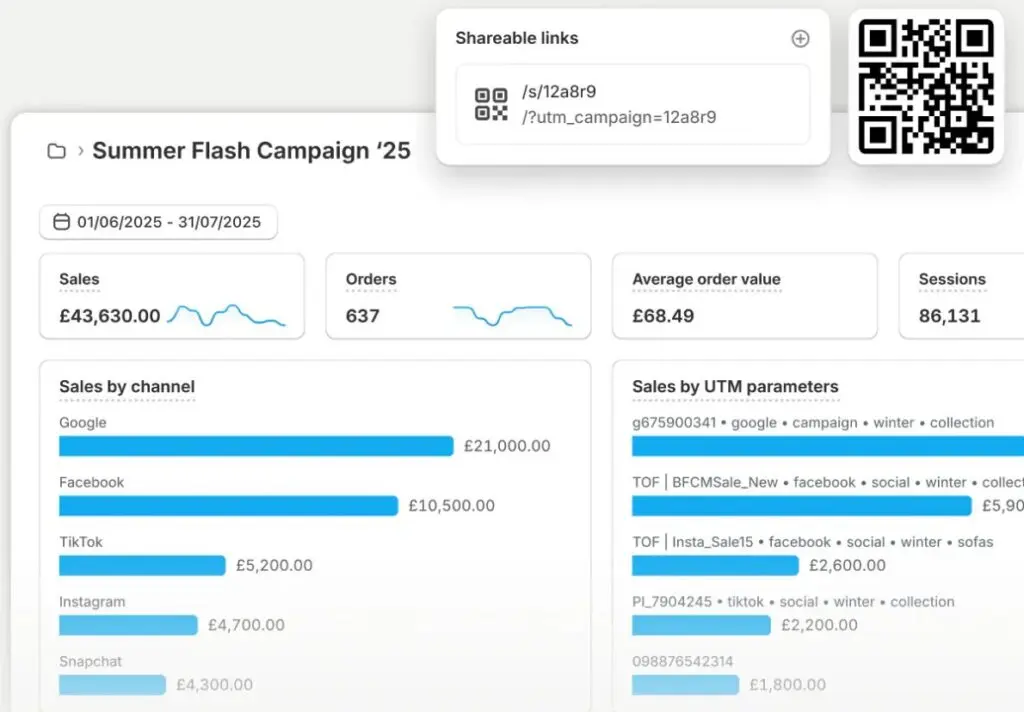
Overview and Real-Time View
The main dashboard surfaces key performance indicators such as total sales, sessions, conversion rate, and average order value over a selected time range. Shopify also includes a real-time view that shows live activity, including active visitors, recent orders, and top locations.
This is especially useful during launches, promotions, or high traffic periods when teams need immediate feedback.
Time Ranges and Comparisons
One of the most important dashboard features is the ability to adjust date ranges and compare performance over time. Comparing periods such as week over week or year over year helps teams distinguish normal fluctuations from meaningful changes. Looking at trends rather than single-day spikes prevents overreacting to short term noise.
Default KPIs and What They Signal
The dashboard prioritizes metrics that reflect overall store health. Sales and conversion-related KPIs indicate revenue performance, while traffic and session data provide context around demand. Marketers should read these metrics together, as changes in one often explain changes in another.
This video from Shipify explains the analytics components of the dashboard:
When to Move Beyond the Dashboard
The dashboard is a starting point, not a decision endpoint. When teams notice unusual shifts or emerging patterns, deeper insights usually come from drilling into specific reports. Using the dashboard as a monitoring tool, rather than a standalone analysis, helps keep analytics reviews efficient and focused.
Shopify Analytics Reports Explained
While the dashboard shows what is happening at a glance, Shopify analytics reports explain why it is happening. Reports allow marketers and eCommerce teams to break performance down by dimension, spot patterns, and answer specific business questions with more precision.
Sales Reports
Sales reports focus on revenue performance over time. They show total and net sales, sales by product, sales by channel, discounts, returns, and taxes.
These reports help teams understand which products and channels drive revenue, how promotions affect sales, and where growth is coming from. Marketers often use sales reports to evaluate campaign impact beyond surface-level traffic metrics.
Again, here's a convenient video from Shopify on the sales report dashboard:
Customer Reports
Customer reports provide insight into who is buying and how often they return. They include data on new versus returning customers, customer purchase history, and repeat behavior.
These reports are especially useful for assessing retention health, understanding customer value trends, and identifying whether growth is driven by acquisition or loyalty.
Acquisition and Traffic Reports
Acquisition reports show where visitors are coming from and how those sources perform. Shopify groups traffic by channels such as direct, search, social, email, and referrals. For marketers, these reports help compare channel quality, not just volume, by tying traffic sources to downstream outcomes like conversions and sales.
Product Performance Reports
Product reports break down how individual products and variants perform. Metrics like units sold, revenue contribution, and sell-through help teams identify top performers and underperformers. This data supports merchandising decisions, inventory planning, and product-focused campaign strategies.
Finance and Payout Reports
Finance reports focus on payouts, fees, taxes, and cash flow. While often used by finance teams, they are still relevant for marketers and business owners who need to understand net revenue and the true cost of growth.
Together, these reports turn raw Shopify data into structured insights, enabling teams to move from observation to informed action.
Key Shopify Metrics Marketers Should Track Regularly
With so much data available, the challenge is not access but focus. Successful teams prioritize a small set of Shopify metrics that clearly connect marketing activity to business outcomes. These metrics provide a reliable pulse check on store performance and help guide day-to-day decisions.
Conversion Rate
Conversion rate shows how effectively your store turns visitors into buyers. It is one of the fastest ways to diagnose performance issues. A drop in conversion often points to problems with traffic quality, product pages, pricing, or checkout experience, while stable traffic paired with rising conversion usually signals stronger on-site execution.
Average Order Value (AOV)
Average order value reveals how much customers spend per transaction. Marketers use this metric to evaluate upsells, bundles, free shipping thresholds, and promotions. Changes in average order value help explain revenue growth or decline even when order volume stays flat.
Traffic by Channel
Understanding where visitors come from is critical for marketing optimization. Shopify breaks traffic down by source, allowing teams to compare not just volume but performance quality across channels like search, social, email, and direct. This helps marketers shift spend and effort toward channels that actually convert.
Returning Customer Rate
Returning customer rate indicates how well a brand retains buyers over time. A growing returning customer base suggests strong product experience and post purchase engagement, while heavy reliance on new customers can signal rising acquisition costs and weaker loyalty.
Sales and Revenue Trends
Rather than focusing on daily totals, marketers should track revenue trends over time. Week over week and year over year comparisons provide context and help distinguish seasonal patterns from real performance changes.
By consistently reviewing these core metrics together, teams gain a clearer understanding of what is driving growth and where optimization efforts should be focused.
How to Use Shopify Analytics for Marketing Decisions
Shopify analytics becomes most valuable when it is used to guide decisions, not just report outcomes. For marketers and eCommerce teams, the goal is to connect performance data to specific actions that improve efficiency, conversion, and growth.
Identify High-Performing Channels and Campaigns
By comparing traffic sources with downstream metrics like conversion rate and sales, marketers can see which channels actually drive revenue, not just visits. This helps teams double down on channels that deliver qualified traffic and reassess those that generate volume without results.
Diagnose Funnel Drop-Offs
Shopify analytics helps pinpoint where potential customers disengage. Strong traffic paired with weak conversion often points to issues on product pages or checkout, while declining sessions may indicate problems with acquisition efforts. Using analytics to isolate the stage where performance breaks down allows teams to prioritize fixes with the highest impact.
Evaluate Promotions and Campaign Impact
Sales and order reports make it easier to assess how promotions, discounts, and launches perform over time. Marketers can compare periods before, during, and after campaigns to understand whether revenue gains come from increased demand, higher order values, or short-term spikes that fade quickly.
Align Content and Merchandising With Performance Data
Product and customer reports reveal which items, categories, and customer segments perform best. Marketers can use these insights to inform ad creative, featured collections, email messaging, and on-site merchandising, ensuring marketing efforts reinforce what already resonates with buyers.
When Shopify analytics is reviewed with clear questions in mind, it becomes a decision support tool that helps teams act faster and with greater confidence.
When Shopify Analytics Is Enough and When It Is Not
Shopify analytics is a strong foundation, but it is not designed to answer every question a growing business will eventually face. Knowing where it excels and where it starts to fall short helps marketers choose the right tools at the right stage, without overcomplicating their stack too early.
Where Shopify Analytics Works Well Natively
For many brands, especially in early to mid growth stages, Shopify analytics covers the essentials.
It provides reliable visibility into:
- Sales performance
- Traffic sources
- Conversion behavior
- Customer activity directly tied to the store
Marketers can answer questions like which channels drive revenue, how promotions affect sales, and whether conversion rates are improving, all without leaving the Shopify admin. For day-to-day monitoring, campaign reviews, and eCommerce decision-making, this level of insight is often enough.
Where Shopify Analytics Becomes Limiting as Stores Scale
As stores grow, marketing complexity increases. Shopify analytics offers directional acquisition data, but it lacks deeper attribution modeling, cross-channel journey analysis, and advanced segmentation.
Once brands rely heavily on affiliates, creators, paid media, and partnerships, it becomes harder to understand true performance using native reports alone. Shopify also offers limited insight into brand perception, off-platform conversations, and how marketing efforts influence awareness and sentiment beyond direct sales.
When and Why Brands Add Specialized Analytics Tools
This is where complementary platforms come into play. For example, brands running affiliate or partner-driven growth often turn to Refersion to track partner performance, commissions, and revenue attribution more accurately than Shopify can natively.
Refersion helps marketers understand which affiliates, creators, or partners are driving incremental value, making it easier to optimize partnerships without manual tracking or guesswork.
For brands focused on brand awareness, social performance, and consumer insight beyond the store, tools like Brandwatch Intelligence fill an entirely different gap.
While Shopify shows what customers do on your site, Brandwatch Intelligence helps marketers understand how audiences talk about the brand across social platforms, forums, and the wider web.
This allows teams to connect sales performance with sentiment, trends, and audience perception, something native ecommerce analytics cannot provide.
Signs You May Need More Than Shopify Analytics
Brands often outgrow Shopify analytics when they need:
- Clearer attribution across channels
- Deeper insight into partner-driven revenue
- A stronger understanding of brand impact outside the store
When decision-making starts to rely on questions Shopify cannot confidently answer, adding specialized tools becomes a strategic upgrade rather than an unnecessary layer.
Used correctly, Shopify analytics remains the backbone, while external platforms extend insight where native reporting naturally stops.
Turning Shopify Analytics Into a Growth Advantage
Shopify analytics is most powerful when it is treated as a decision support system, not just a reporting feature. For marketers and eCommerce teams, the real value lies in understanding trends, diagnosing issues, and using data to guide action across channels.
Native analytics provides a strong foundation for monitoring performance, evaluating campaigns, and understanding customer behavior.
As stores grow and strategies become more complex, analytics needs evolve. Knowing when Shopify analytics is enough and when to layer in specialized tools helps brands scale without losing clarity.
When teams build consistent review habits and focus on actionable insights, Shopify analytics becomes more than data; it becomes a competitive advantage that supports smarter, more confident growth decisions.
Frequently Asked Questions
Can Shopify analytics support SEO decision making?
Shopify analytics can highlight organic traffic trends and conversion behavior, but it does not replace specialized SEO analysis. Many brands pair Shopify data with insights from Shopify SEO services to understand keyword performance, technical issues, and how organic visibility influences revenue.
How does Shopify analytics compare to other ecommerce platforms?
Shopify analytics offers a strong native reporting foundation, especially for sales and conversion tracking, but depth varies by platform. Comparing analytics capabilities across ecommerce platforms helps brands understand whether Shopify aligns with their reporting and growth needs long term.
What is digital shelf analytics and how does it relate to Shopify?
Digital shelf analytics focuses on how products appear, perform, and compete across marketplaces and retail channels. While Shopify analytics tracks on site behavior, teams often layer in digital shelf analytics software to monitor visibility, pricing, and competitive positioning beyond their own store.
Does Shopify analytics track user behavior in detail?
Shopify analytics shows high-level behavior such as sessions and conversions, but it does not provide granular interaction tracking. Brands seeking deeper insight into how users navigate pages and features often adopt behavioral analytics tools to analyze friction, engagement, and drop off patterns.
When should brands work with an ecommerce agency for analytics?
As analytics needs become more complex, some brands partner with an ecommerce agency to interpret data, align insights with strategy, and build reporting workflows that support growth across marketing, merchandising, and operations.
Can Shopify analytics measure influencer marketing performance?
Shopify analytics can show sales outcomes from referral sources, but influencer programs often require more detailed tracking. Many brands rely on Shopify influencer integrations to connect creator activity with traffic, conversions, and partner performance more accurately.
How do marketing agencies use Shopify analytics?
Marketing agencies use Shopify analytics to monitor campaign impact, identify conversion issues, and guide optimization. Brands often collaborate with Shopify marketing agencies that combine native analytics with paid media, SEO, and creative data for a more complete performance view.
Is Shopify the best ecommerce platform for analytics focused brands?
Shopify offers a reliable analytics baseline, but suitability depends on business complexity and reporting needs. Evaluating the best ecommerce platform for analytics helps brands choose a solution that balances ease of use with long term insight requirements.

