How do you really know if your eCommerce business is successful? Is it by the number of sales, lack of complaints, or five-star customer reviews? Perhaps the balance of your business bank account is what you use as affirmation of your success?
However, to get a comprehensive picture of your success, you need to measure a range of factors. Some of these key performance metrics (KPIs) will give you better insight into the financial health of your business operations, while others can be used to assess if your marketing efforts are indeed fruitful.
So, depending on your specific business goals, we’ve listed 25 of the most important KPIs that all eCommerce businesses should track.
25 Crucial eCommerce KPIs to Track in 2024:
- 1. Average (complaint) resolution time
- 2. Average order value
- 3. Average position
- 4. Average (profit) margin
- 5. Average session duration
- 6. Bounce rate
- 7. Cart abandonment rate
- 8. Cart conversion rate
- 9. Chat sessions initiated
- 10. Churn rate
- 11. Conversion rate
- 12. Cost of goods sold
- 13. Customer acquisition cost
- 14. Customer lifetime value
- 15. Customer satisfaction and net promoter score
- 16. Cycle time
- 17. Email open and click-through rate
- 18. Followers on social media
- 19. Gross profit
- 20. Repeat purchase rate
- 21. Return on investment
- 22. Site traffic
- 23. Subscriber growth rate
- 24. Time between purchases
- 25. Traffic source
- Frequently Asked Questions
1. Average (complaint) resolution time
Your average complaint resolution time refers to how long it takes for a query to be resolved by your customer support team. To work it out, take the total of customer service requests received minus the total number of unresolved requests and divide the answer by the number of requests received.
2. Average order value

Also simply called AOV or sometimes referred to as your average market basket, your average order value refers to how much money a customer spends on average per transaction. To work it out, take your total revenue and divide it by the total number of orders.
By measuring this KPI, you will get a better understanding of how effective you are at upselling cross-selling. By increasing your AOV, you can boost your revenue and also justify increasing how much you spend on acquiring new customers (refer to customer acquisition cost).
3. Average position
To find out more about how effective your search engine optimization (SEO) strategy is, you need to track your average position. This way, you will have a much better idea of where you show up on the search engine results pages.
4. Average (profit) margin
Your average profit margin (or sometimes simply referred to as your average margin) refers to your profit margin over a specific time period. To work out this percentage, take your gross profit and divide it by your revenue and times by 100. Alternatively, you can also use one of the many online profit margin calculators to do it for you.
5. Average session duration
The average session duration refers to how much time a website visitor spends on average on your site during a single visit. To work it out, take the total session duration and divide it by the total number of sessions.
If the sessions are generally longer (or if there are more page views per visit), it is a good indication that your website is engaging. That being said, if they are spending more time on the checkout process than your blog, you need to simplify your checkout pages and add more interesting blog content.
6. Bounce rate
Your bounce rate is an indication of how many website visitors choose to leave your website after looking at only one of your web pages. The lower your bounce rate, the better it is as it indicates that users actually enjoy browsing your website and will get better acquainted with your brand which can help drive sales and customer loyalty.
7. Cart abandonment rate
Your cart abandonment rate (also called shopping cart abandonment rate or just CAR) refers to the number of visitors who complete the checkout process by paying for the products that they have added to their cart. To work it out, you divide the total number of completed purchases by the number of carts that have been created and then multiply it by 100.
8. Cart conversion rate
Just like you want to measure how many potential customers abandon their carts, it is a good idea to know how many website visitors, in fact, complete the entire checkout by paying for the items that they have added.
9. Chat sessions initiated
If you use live chat, you might also want to track how many visitors use this feature. This information can be used to get a better idea of how effective this functionality is and how many visitors it has helped to convert.
10. Churn rate
For online businesses that are selling subscriptions, measuring your churn rate is key. With this information, you can identify at which rate customers are canceling their subscriptions.
11. Conversion rate
Your conversion rate refers to the rate (expressed as a percentage) at which your website visitors are buying. To work it out, take the total number of website visitors and divide it by the total number of conversions.
For many eCommerce businesses, this is the most important KPI to measure and will have an impact on several other eCommerce KPIs. In addition to using it to gain insight into your sales, you can also use the formula to work out how many visitors, for example, sign up for a newsletter, create an account, or another meaningful action.
12. Cost of goods sold
By working out your cost of goods sold (aka COGS), you will find out how much you are spending to sell a product. It takes into account costs like overheads, manufacturing, and salaries/wages.
13. Customer acquisition cost
Your customer acquisition cost (aka CAC) gives you an indication of how much your online business is spending on getting a new customer. To work it out, take the amount spent to get new customers (this will be your marketing spend) and divide it by the number of customers that you have acquired.
To make sense of this number, you need to compare it to the price of your products. As mentioned earlier, if your average order value is higher, you can afford to spend more on getting new customers. If you are mostly selling low-ticket items, your CAC should be low.
14. Customer lifetime value
Similarly to conversion rate, the customer lifetime value (aka CLV) is the most important KPI according to many online stores. In short, it gives you an indication of how much a customer is worth to your eCommerce business as well as a good indication of how your business is doing overall and if it is growing steadily. You should aim to increase your customer lifetime value every year. To work it out, you multiply the annual profit contribution of the customer by the average number of years as a customer and then subtract the initial cost of acquiring the customer.
15. Customer satisfaction and net promoter score
To calculate your customer satisfaction score (aka CSAT), you can ask your customers to rate their experience via a numbered scale. You can also take it one step further to include a second question in the survey asking them how likely they are to recommend your brand to a friend to measure your net promoter score (NPS). This way, you can also get more information about customer loyalty.
16. Cycle time
If you manufacture the products that you are selling yourself, you will also want to work out the cycle time. The cycle time gives you insight into how long it takes to manufacture one product. By knowing what your cycle time is, you can keep better track of your efficiency with regards to production.
17. Email open and click-through rate
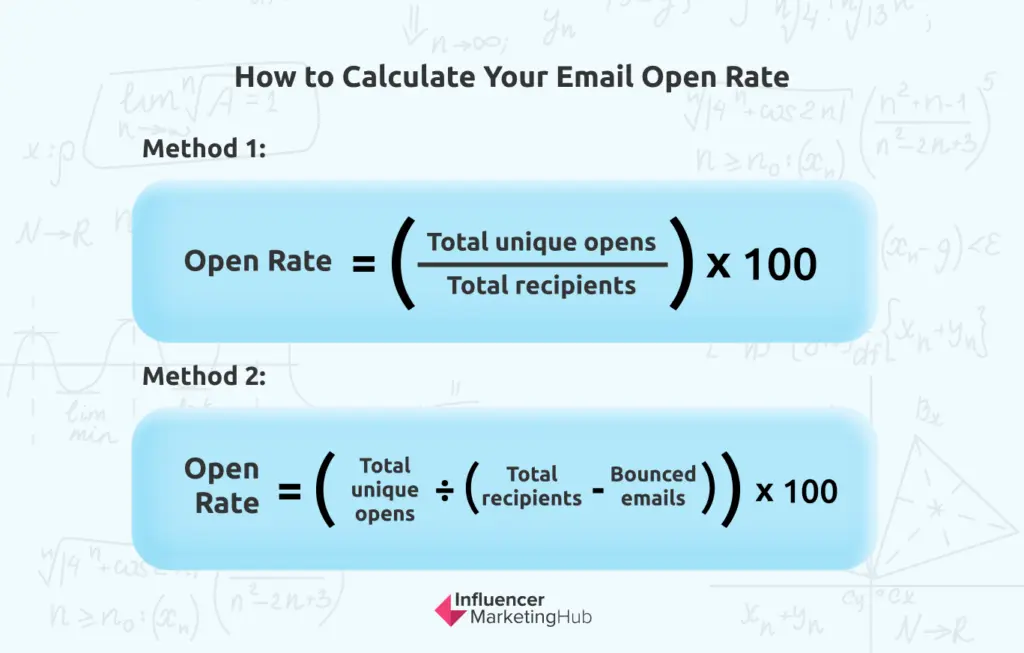
If email forms a major pillar of your marketing strategy, you will want to measure how many subscribers actually open your emails after receiving it. While each industry has different average open rates, if you get an open rate of around 17%, you are on par. If your email open rate is lower than that, you can start by cleaning your email subscriber list and tweaking your subject lines.
While knowing your open rate is a good place to start, you should also take it one step further and work out how many of the subscribers who opened the email clicked on a link after opening it. This is your email click-through rate. If your email click-through rate is too low, your website will not get enough traffic.
18. Followers on social media
It is also a good idea to keep track of how many followers you have on Facebook, Instagram, Twitter, etc. This number will give you a good indication of where you are at when it comes to brand awareness and customer loyalty. Then, to get a better idea of your followers’ engagement, be sure to pay attention to other social media metrics like to the number of comments and likes your posts receive.
19. Gross profit
To work out your gross profit, subtract the total cost of your goods from your total sales. All in all, it is a key number that will help you to plan efficiently for the future.
20. Repeat purchase rate
Your repeat purchase rate (aka RPR) gives you insight into customer loyalty. To work it out, take the purchases from repeat customers and divide it by the total purchases. If you find that the majority of your customers come back, you can focus more on product quality and rewarding customer loyalty as you do not have to focus that much on getting new customers. All in all, it is a good position to be in as it is a sign that your eCommerce business is on the right path.
21. Return on investment

The return on investment (or better known as ROI) gives you insight into how much your work has helped to attract online business by taking into account your earnings and expenses.
22. Site traffic
In short, site traffic refers to how many website visits your eCommerce site has attracted. While pretty straightforward, this KPI is still key, especially for assessing your marketing efforts. For example, if you had a retargeted ad campaign, you can take it one step further and look at how much of this traffic was created by returning visitors as opposed to new visitors. You can also specifically measure your mobile site traffic (the number of users who accessed your eCommerce site via a mobile device).
23. Subscriber growth rate
Another important KPI relating to email marketing is your subscriber growth rate. With this information, you will be able to tell if your newsletter subscriber list is in fact growing steadily so that you can reach more potential customers. To work it out, subtract your past subscribers from your current subscribers and divide it by your past subscribers. Then, times this answer by 100 to get a percentage.
24. Time between purchases
By working out the time between purchases, you can customize your marketing campaigns more effectively to better reflect their behavior. To work out this KPI, you first need to figure out the purchase frequency by dividing the total number of unique customers by the total number of orders. This answer is your purchase frequency. Then, you take your purchase frequency and divide it by 365.
25. Traffic source
This key performance indicator gives you more insight into how your website visitors ultimately found your eCommerce site. With this information, you can get a better idea of which channels (like social media versus organic search) created the most traffic.
Frequently Asked Questions
What are KPIs?
A key performance indicator (KPI) is like a milestone that tells you more about how successful your eCommerce business is. It is a data point or measurement that can be quantified to help you assess your performance in connection with a specific goal. In short, it refers to the metrics that matter most.
Why are eCommerce KPIs important?
By tracking eCommerce KPIs, you get actionable insight. With this data, you can then find out how effective you as owner, your team, or business as a whole is performing with regards to the objectives and goals that you have set.
What are some of the most important KPIs?
For eCommerce stores, there are dozens of important KPIs that they should track. Some of the most important ones are: shopping cart abandonment rate, conversion rate, cost of customer acquisition, customer lifetime value, average order value, and gross profit margin.
How can you get more followers on social media?
Depending on the social media platform, there are a few things that you can do to increase your follower count. For example, on Instagram you can use popular, but relevant hashtags, and host giveaways or competitions. On a platform like Twitter, engaging in relevant conversations and mentioning others can help.
How can you improve your email open rate?
To improve your email open rate, it is important to segment and personalize. It is also important to identify the best time to send your email. Typically, this is on Tuesdays between 10 a.m. and 1 p.m., but it will ultimately depend on the needs of your subscribers.


