
Slowly but surely, small businesses are getting their chance to give influencer marketing a shot. In its early days, influencer marketing was strictly the domain of large brands with household names (and house-sized marketing budgets to match). The first influencer marketing platforms were expensive, with some of the more sophisticated offerings carrying a monthly subscription fee of a few thousand dollars. Of course, as with anything new and expensive that catches on to the mainstream, the price for access to a discovery, management, and analytics platform has come down considerably.
Not considerably enough, though, if you’re a small, family owned business. Even with some of the best solutions coming down to a more accessible range of $500 - $800 a month—that’s still more than a small business can swing in most cases. There have been, in the past couple of years, several attempts at low-cost influencer marketing platforms. This is especially true with marketplaces, which don’t need to rely that heavily on advanced algorithms and AI, and are more well suited to pay-as-you-go type plans. The emergence of several platforms offering subscriptions under $100 a month—as well as others that rely on flat fees per campaign, or just commissions on payments to influencers—has been great news for small, local businesses. Mostly. Almost always, the one thing that’s missing from these platforms is data. Or, more specifically: analytics.
Enter Analisa, the Instagram analytics platform that’s poised to change the game for a lot of businesses who couldn’t afford to do influencer marketing right.
If you’ve ever wondered what the difference was between data and analytics, Analisa illustrates it perfectly. The new, low cost marketplaces provide you with data: they can tell you an influencer’s follower count, and how many likes/comments a post got. They’ll do the simple math and provide an engagement rate, and—well, that’s about it. What you’re getting is just numbers—raw data—and these numbers are things you could find out just by looking at the post. With Analisa, you get analytics. Yes, you’ll get raw data, like the number of likes, but you’ll also have that raw data analysed so you’ll understand that most of those likes happened on Tuesday and Saturday, at 3PM and 10AM, respectively. That’s a basic explanation, and if it doesn’t make sense to you yet, it will as we go through The Details and list all that you can learn through Analisa.
As you read ahead, keep this in mind: Analisa is using the same very basic, and publicly available, data that the low-cost platforms do. What they do with it goes much, much deeper. And they’re doing it at a price point that’s in just about any budget.

Summary:
Pricing
Analisa offers two levels of service through a no-contract subscription
- Free, $0/month for 1 user — True to its name, the free plan is free! You also can’t do too much with it. The analytics you’ll get are basically the same as what I described as being insufficient in the Overview section: raw numbers without much meaning behind them. But they’re presented attractively, in easy to read charts and graphs, and so serves as a nice way to see how Analisa works.
- Premium, $69/user/mo ($59.35/user/mo, if paid annually) — The Premium plan unlocks all that Analisa does, which we’ll cover in The Details. I should note that even though plans are priced per user, that doesn’t mean there are any collaboration tools within the platform (i.e. no way to share/comment/annotate any profiles or reports within the platform). The user license is strictly for access.
The Details

There are two kinds of reports you can run with an Analisa, and each has its own benefits. Running an @account report can give you in-depth analysis on an influencer’s profile and activity, while #hashtag reports can be used to monitor campaigns. For each report you’ll get a variety of analytics to help you gain deeper understandings of the subject:
@Account Report
- Engagement Rate, Like Rate, Comment Rate — Where most platforms give you engagement rate, Analisa breaks it down as well to see the difference between likes and comments. Not all engagement is created equal, and separating them out like this lets you know just how engaged this audience is.
- Average Engagement Rate — As the name suggests, this is an average over the history of the account, and is accompanied by an interactive graph showing engagement over time. You can select and zoom in to any portion of the graph for a closer look, as well as getting some real numbers for each day.

- Total Posts — This isn’t a great name, since it doesn’t actually show you the total amount of posts by the influencer. But that’s OK, because that’s pretty useless information. More useful is what’s included here: average posts per day, per week, and per month, and another interactive graph to drill down to specific dates.
- Tags and Mentions — Shows the accounts and hashtags most often used by the influencer. This is very useful for finding other influencers to work with, and to see which brands, if any, the influencer has worked with in the past.
- Posting Map — Shows the locations of all posts (provided they’ve been geotagged).
- Posting Activity and Audience Engagement — These are two different charts that are invaluable for future planning. Posting Activity shows the days and times the influencer posts, and is color coded for frequency (darker colors mean more activity, lighter mean less). Audience Engagement breaks the data down in the same way, by day and time, and color codes it similarly. Knowing when the audience is really paying attention can help you schedule posts for future collaborations.


- Average Likes and Comments Per Post, and Average Engagement Rates — Like the Audience Engagement heat map above, these two bar graphs give you more granular detail on audience activity, broken down by the days of the week and with hard numbers attached.
- Total Posts (Weekday Breakdown) — Different than the earlier “Total Posts” graph, this one is another bar graph showing the total number of posts for each day of the week for the history of the account.
- Caption Words and Hashtags Most Used — Avoiding commonly used words in the captions can help future posts seem fresh, while sticking with commonly used hashtag keeps things consistent.
#Hashtag Report
- Audience and Engagement — These two sections actually contain six different metrics: Contributors (those who posted with the hashtag), Followers (the total of all the contributors), Impressions (how many people actually saw the post), Posts (total number that include the hashtag), Likes (total number), Comments (total number).
- Total Posts — Just like in the @account report, this shows an interactive graph showing when each post in a campaign went live.
- Total Follower Reach — This interactive graph plots out when each of those total number of followers saw the post.
- Total Engagement — Another interactive graph, showing the engagement for each day.

- Geolocation — An interactive map showing the location of each post.
- Average Engagement Per Day — A bar graph that show the engagement rate by the day of the week, over the life of the campaign.

- Total Engagement Per Day and Total Follower Reach per day — More bar graphs, showing the total engagements and follower reaches for each day of the week, over the life of the campaign.
- Posting Activity and Audience Engagement — Just like the heat maps in the @account reports, these two give you a side by side comparison of when posting and engagement were at their peak.
- Caption Words and Hashtags Most Used — Probably self explanatory at this point.
- Participation — Shows how many contributors posted with the hashtag, plus the breakdown of how many contributed one to five posts, six to ten posts, or eleven or more posts.
In both the @account and #hashtag reports, you can also see the top posts for each. If you’re looking at an influencers analytics, the top posts will their personal best performers. For hashtags, those are the ones that did the best for a campaign.
Additionally, the #hashtag report includes one more set of data, and that one goes into depth about the influencers performance. Here you can see which influencers did the best, and which ones you’ll probably want to pass on next time around. Or, if you’re being extra strategic about things, you could do a #hashtag report on your competitors as a way to find influencers for yourself.

At this point, you should be able to identify what the difference between data and analytics is. Knowing that, it’ll make more sense when I level my one criticism: Analisa needs more data. And by “more data,” I mean “audience data,” which is not as easy to come by, but that what makes it all the more precious.
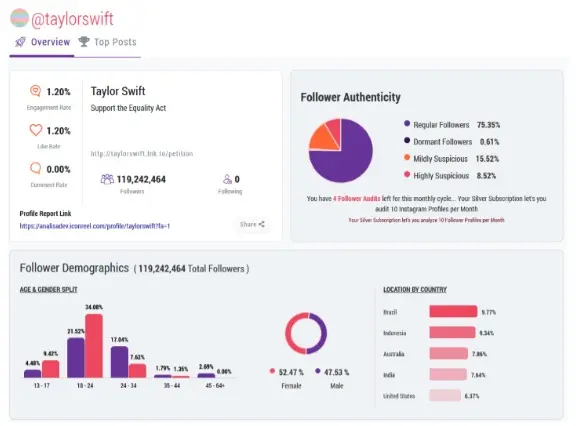
UPDATE:
As marketers increasingly depend on social media for business growth, there is a growing need for measurability and accountability in social media marketing to equip businesses with data- informed decisions and avoid potential frauds. Very notably in the exploding influencer marketing industry, where Unilever’s ex-chief marketing officer Keith Weed once called for a crackdown on influencer follower fraud and lack of data insights. To solve this industry-wide problem, Analisa.io has launched an Instagram Follower Analytics tool that lets users analyse any public Instagram Profile’s Follower Demographics such as Age, Gender, and Country Location, as well as measure Follower Authenticity to detect suspicious or dormant followers. Analisa.io’s Follower Analytics works on any public Instagram Profile, and lets users study audience demographics to find brand relevance, while auditing suspicious followers to avoid potential frauds.
Conclusion
With all that’s great about Analisa, there is one area where they can improve: audience data. As mentioned in the Overview, Analisa is dealing with all publicly accessible information. You don’t need API access to Instagram to find out things like total posts, engagement, or the time and day when something is posted. That Analisa did so much with the same data as other low-cost platforms is truly impressive. Now, I’d like to see them take it a step further and start getting at the demographics and psychographics of the audience. This is truly invaluable information, and if they can figure out a way to get it without having to raise their costs too much, Analisa could become a truly invaluable tool. For small businesses, though, it might already be indispensable. This is still more business intelligence than $69 a month has ever gotten you, and to think you wouldn’t benefit from it is, well...not intelligent.
Analisa
-
Features
-
Ease of Use
-
Reporting