If the SEO space was competitive before, it has now become an all-out war with AI's entry. In fact, 57.6% of marketers report that AI in SEO has increased the competition for search rankings. That means you need an even more in-sync cycle of reporting and optimization to meet search engine algorithms, user behavior, and AI capabilities exactly where they are.
However, with new trends like AI Overviews, generative engines, voice search, and large language model (LLM) SEO, many of the traditional SEO reporting tools have lost their edge. You may have to use multiple tools to get a comprehensive report of your SEO campaigns.
Using multiple tools also raises the issue of ROI depletion when you factor in the cost of each tool and time spent in manual reporting. Many SEO tools also lack white label features, which means you'd need yet another platform for agency branding or client-level metric customization.
The solution to all these problems lies in comprehensive SEO reporting tools. Below, we discuss some of these all-in-one solutions to automate your SEO reports.
- 1. Semrush
- 2. Google Analytics
- 3. Google Search Console
- 4. Looker Studio (formerly Google Data Studio)
- 5. Moz
- 6. SE Ranking
- 7. Raven Tools
- 8. AgencyAnalytics
- At a Glance: Top SEO Reporting Tools Compared
- Turning Data Into Action: From Metrics to Meaningful Insights
- Effective Communication & Storytelling in SEO Reporting
- Let Numbers Speak Louder Than Words With SEO Reporting Tools
- Frequently Asked Questions
1. Semrush
Best For: Agencies that need professional, automated SEO reports with white label features and in-house teams looking for an all-in-one SEO reporting tool.
Semrush is a widely known and used SEO tool that has remarkably kept up with the changing search engine landscape. So much so that it incorporates predictive SEO and AI-powered metrics that not only report on what's happening now but also what's to come.
The My Reports feature, also called the Growth Kit, is where you can see advanced reporting for your clients' campaigns. Here, you can create PDF reports for every client from scratch.
Semrush supports a ton of integrations, including but not limited to Ahrefs, HubSpot, Google, Matomo, TikTok Ads, Mailchimp, and so on. This way, you can gather data from all your SEO tools in one place and generate customized reports for clients according to their preferred metrics.
Another notable feature of Semrush as a reporting tool is data visualization. You have four options to select from: a line chart, a donut chart, a table, or a simple number. So, opt for whatever your clients prefer. You can also remove the data that you don't want to show up on the report, making it easier to focus on key metrics.
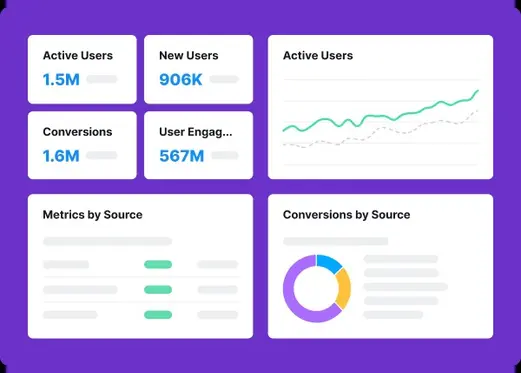
Data visualization in Semrush
The tool also has an option to add an AI summary for every report you create. You have the option to choose between a detailed or brief summary version. Semrush's AI will analyze all the data and generate a summary that clients with little to no SEO knowledge can easily understand.
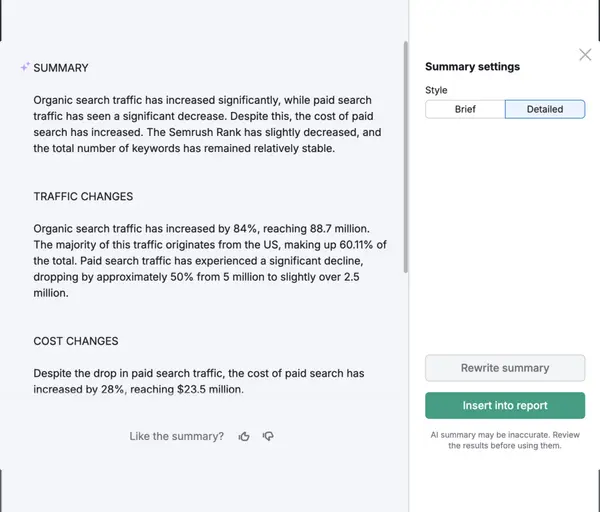
Semrush AI summary
Depending on your agency's size and existing resources, you can select between pre-existing templates or custom ones. Pre-built templates are available for Monthly SEO Report, Domain Comparison, Site Audit, Google Search Console, and more. Alternatively, you can use the handy Report Builder to create a custom report.
If you're managing multiple clients, it can be a bit tedious to keep track of all the reports you need to create and send. Semrush lets you schedule reports to be emailed out on a specific day and time.
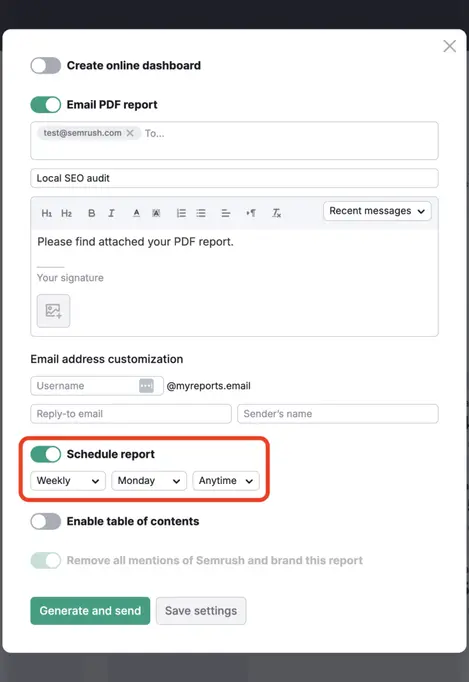
Report scheduling in Semrush
As for its white label features, you can use custom themes, visual styles, branding, and company logos to make the reports look professional and personalized for your clients. There are plenty of color schemes and fonts to choose from, so you're spoilt for choice.
2. Google Analytics
Best For: Budget-conscious marketers that need an easy-to-use analytics tool with immediate insights on traffic and user behavior.
If you're looking for a free and user-friendly analytics tool, then Google Analytics is the way to go. It gathers SEO data from your website and creates detailed reports on your site's performance, user behavior, and traffic sources.
These reports give you an idea of how your clients' target audience is behaving, what their activity looks like, where they come from, and so on. The Realtime report feature means that you can track website visitors in real time, providing an immediate understanding of how people are interacting with it.
Google Analytics shows you two types of reports:
- Overview Reports: This is where you'll see a summary of the most important website metrics and performance data, such as bounce rates and page views.
- Detail Reports: Here, you'll find in-depth data about a certain metric. For example, if you want to check the performance of a specific landing page for an eCommerce client, the details will be in this section.
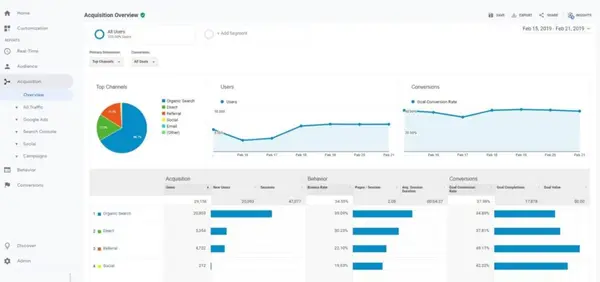
Besides website performance, Google Analytics also shows customer journey reports, giving an overview of the target audience's movement from awareness to retention. You can also see user demographics, devices, ages, and interests to further streamline your clients' strategies.
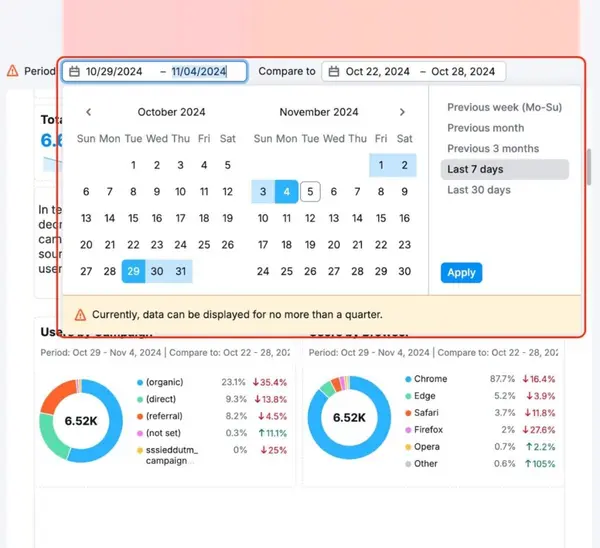
The date ranges in the reports can be changed to view specific time periods, making it easier to track the effectiveness of campaigns or any changes made on the website. Google Analytics also has a feature that allows data to be compared from different time periods.
Like Semrush, you can schedule reports and send them by email. A lot of reports are pre-made, including checkout journey, acquisition overview, engagement overview, organic search traffic, and more. So, you can simply send them as is.
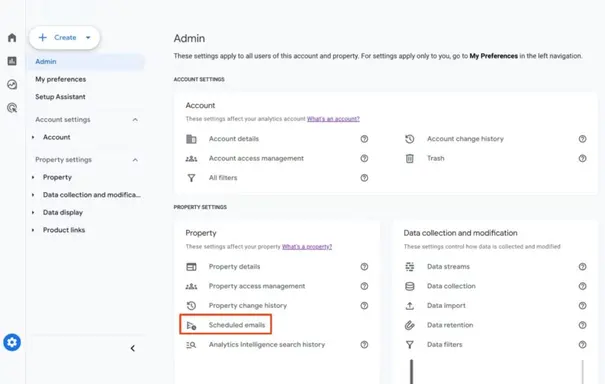
However, the downside of Google Analytics is the absence of a white labeling option. You'll have to use third-party tools to add branding elements and personalization to the reports you send to clients.
3. Google Search Console
Best For: Website owners and webmasters who want to measure their site's visibility in Google for free.
Google Search Console is among the most reliable SEO reporting tools since it takes data directly from the source — Google. It's free and can help you measure SEO performance and troubleshoot issues.
Its most notable feature is the Performance Report, where you can see the change in website traffic over time and the queries that result in clicks to your site. The report also shows the devices used to access your site and the click-through rates for your web pages.
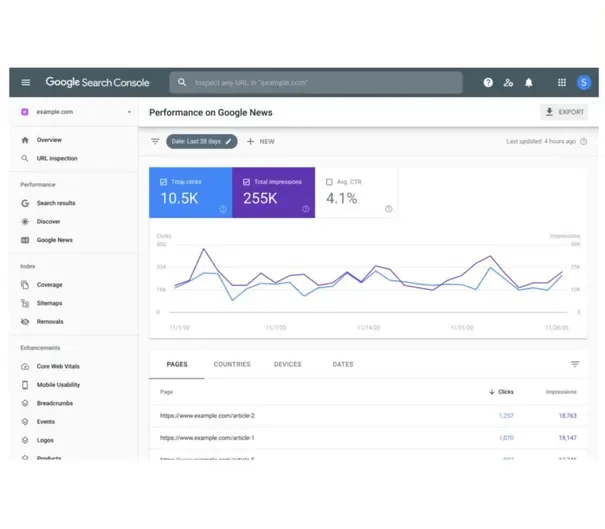
What makes Google Search Console so easy to work with is its filters. You can select the dimensions you want to see, such as by country, by page URL, and so on. Plus, metrics can also be filtered to see only what matters. Like Google Analytics, there's an option to change the date range to see data from a specific period.
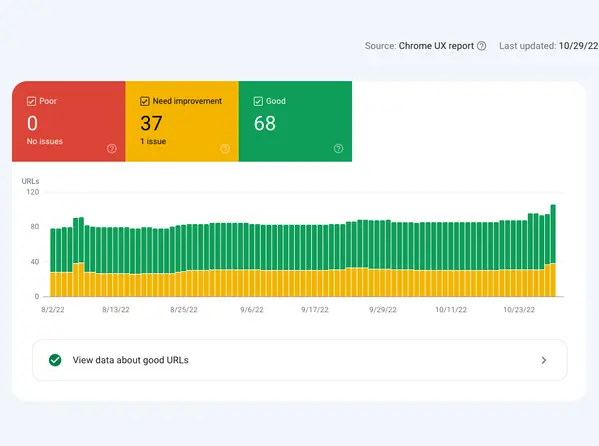
Another great thing about Google Search Console is that it shows the top pages with errors, index coverage issues, and mobile usability problems. The Core Web Vitals report exhibits your site's performance in the real world. You can identify issues slowing down your site and take necessary actions accordingly.
Google Search Console also shows you a sitemaps report, which displays the number of URLs found in your sitemaps and how many of them were indexed. There's also a Links report, which lists the top domains linking to your site and the top pages on your site with internal links.
In short, Google Search Console is quite comprehensive in its reporting. Again, the lack of branding elements means you'll need a separate tool for that if you're an agency. However, as a solo business owner or in-house marketer, it's the perfect tool to monitor your website's health.
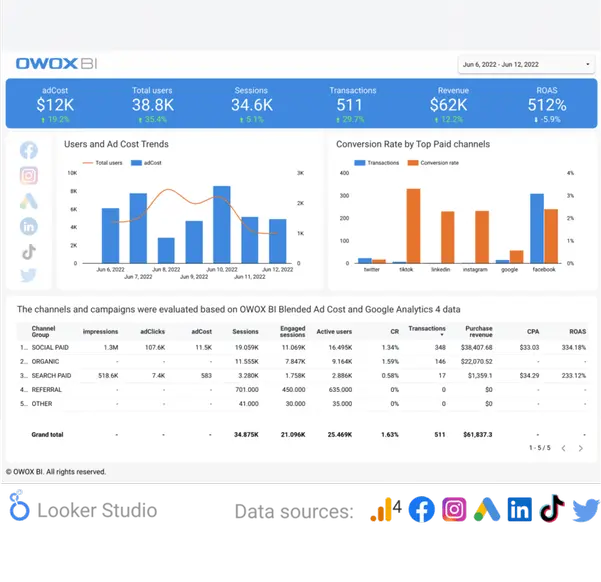
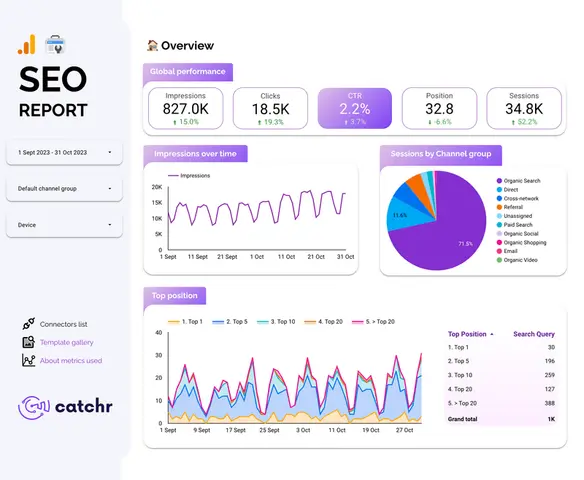
4. Looker Studio (formerly Google Data Studio)
Best For: Marketers and agencies that want to create and share visual, customized SEO reports.
Aptly named, Looker Studio lets you look at SEO data through its variety of visualization options. From tables to charts, the platform creates a visual representation of your SEO data. You can use built-in sample reports or your own, depending on how you want to display and share your data.
The free SEO reporting tool has a drag-and-drop editor that makes it easy to create any type of visual. For example, the options in the charts category range from pie charts and bubble graphs to paginated data tables and bar charts. You can also make your reports more interactive with data range and filter control.
Clickable images and links can also be added to the reports. For example, you may create video libraries to show progress over time. To further personalize reports for your own company or a client, you can select from a range of color and style themes.
Looker Studio connects to data sets from multiple sources, such as MySQL, BigQuery, and PostgreSQL. It also integrates with Google's products like Search Ads 360, Google Analytics, Search Console, Google Sheets, and more.
To share SEO data with your team or clients, you can schedule emails with links to the relevant reports. These reports can also be embedded in annual reports, marketing articles, Google websites, and blog posts. Google hasn't yet added any AI features like Semrush's AI summaries in Looker Studio, but it's still pretty comprehensive for a free tool.
5. Moz
Best For: Small agencies and in-house teams looking for an SEO reporting tool with a user-friendly interface.
Anyone who has been in the SEO space for a while would know about Moz. The tool is known for its comprehensive SEO software, but it also offers reporting features in Moz Pro.
You can create custom PDF reports from scratch within Moz. It's up to you to decide which data you want to include, such as total website visits, domain authority, desktop vs. mobile search visibility, overall search visibility, and so on.

All this information can be viewed over a date range to show clients or executives how their website's SEO has improved over time. You can also add visual aids to the reports, such as graphs and charts, to make the data easier to understand.
Moz also has a range of pre-built templates for competitive analysis, link analysis, rank analysis, campaign overview, and more. These templates come with notes to guide you through the curation process.

Moz report templates
Like all the other tools we've discussed above, you can schedule reports in Moz, too. These reports can be sent on a daily, weekly, or monthly basis, depending on how often stakeholders require them.
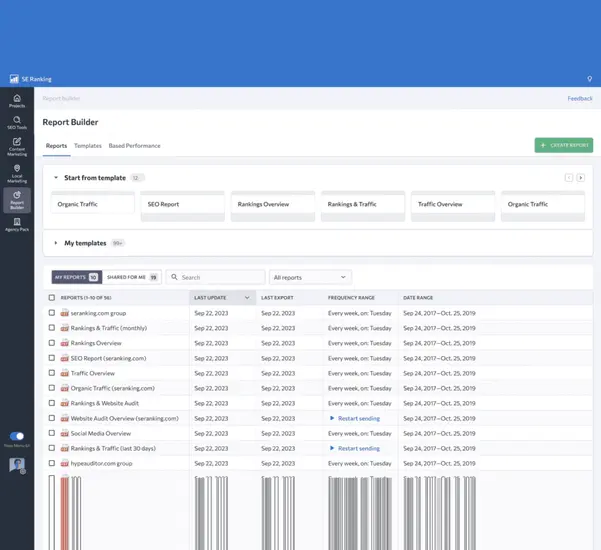
6. SE Ranking
Best For: Agencies looking for a comprehensive SEO reporting solution with straightforward customization options.
SE Ranking is an SEO tool for agencies that lets you stay on top of everything from content marketing to local SEO. Since it's agency-focused, its reporting features are just as robust. It offers a list of pre-designed report templates that you can customize with the drag-and-drop editor.
You can share the guest link with your clients, where they can see data like SEO rank reports, on-page insights, SERP reports, and more. SE Ranking's reports also contain backlink data, including information like new and lost links. The visualizations help make the reports intuitive and easier to understand.
You can also show keyword metrics in your SEO reports. The tool lets you show the most important terms for each project along with key parameters like their difficulty and search volume.
For local clients, you can share insights on their local SEO campaigns, including review reports, local citations, and profile stats for Google My Business. Plus, you can set up your reports to be automatically sent out on a regular basis, making it easier to keep clients updated on their SEO progress.
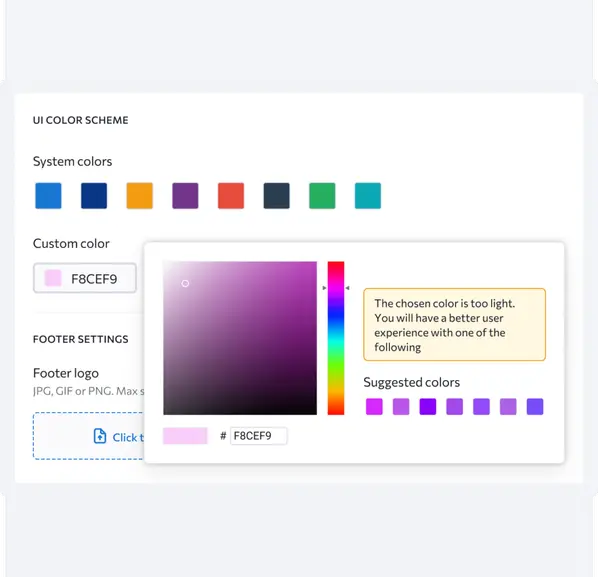
Unlike the Google reporting tools we've mentioned above, SE Ranking comes with white label features, which is a plus point for agencies. You can add your own branding and customize the reports with your logo, color scheme, and so on.
7. Raven Tools
Best For: Agencies managing cross-channel reports looking for a tool to centralize data.
Raven Tools is a dedicated client SEO reporting tool with features for multi-channel campaign management. It allows you to create custom branded reports that pull data from various sources such as Google Analytics, Google AdWords, Bing Ads, Facebook Ads, and more.
With its visual aids and customizable widgets, you can create personalized reports for hundreds of clients without an issue. It also provides connectors for Looker Studio, so you can easily import data into your own dashboards and reporting templates.
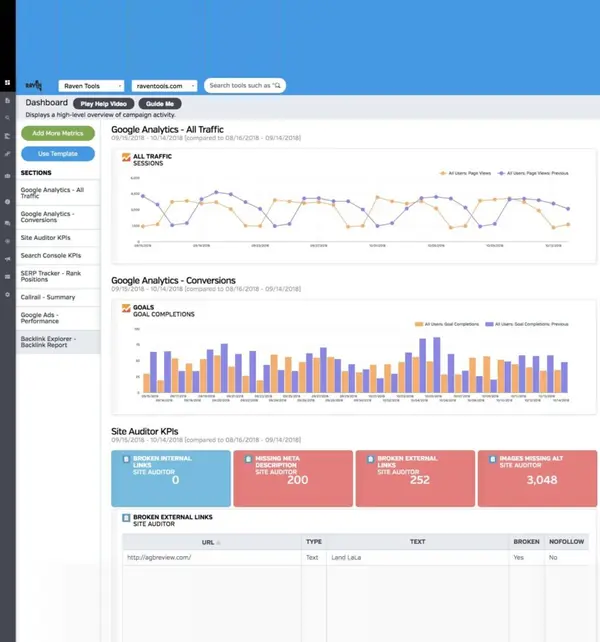
You can use this connectivity to show clients the collective impact of their SEO, email marketing, PPC, and social media campaigns. Plus, the connectors let you compare different platforms and channels in the same chart.
Even without using Looker Studio, you can use the tool itself to create visually rich reports about website analytics and SEO. Some metrics included in these reports are image optimization, mobile friendliness, total traffic, semantic issues, site structure, and site speed.
For clients that want to see their SEO and social media performance in the same report, you can pull in data from major platforms like YouTube and Facebook. Metrics like engagement and clicks can be compared to traffic and search rankings to give a comprehensive view of their online presence.
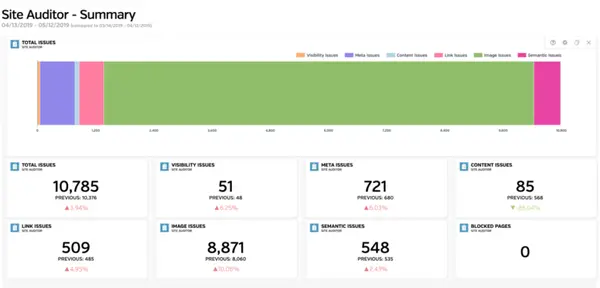
Raven Tools reporting
In addition to reporting features, Raven Tools also has white label options. So, every report you create can be branded with your agency's logo and color scheme. Simply automate these reports to be created every month and shared with clients in mere minutes.
8. AgencyAnalytics
Best For: Agencies looking for a comprehensive suite of analytics and reporting features for multi-client reporting.
Agency Analytics automates client reporting for agencies that have too much on their plate to be doing everything manually. With more than 80 integrations, you can collect data from a range of platforms, such as Google Search Console, Google Analytics, Semrush, Backlink Monitor, BrightLocal, and Google Business Profile, to show your clients a cohesive view of their SEO progress.
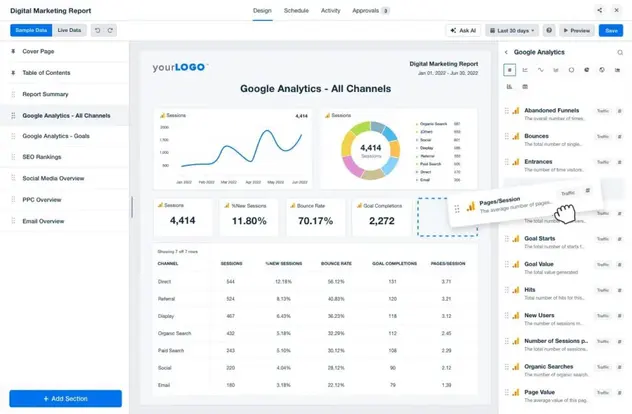
AgencyAnalytics reporting
Customization is also a breeze with a drag-and-drop report builder, which allows you to create branded reports with ease. You can also add white-labeled branding for a more professional appearance. Agency Analytics also offers customizable widgets for more in-depth data analysis, as well as custom reporting templates and a report scheduler for automatic delivery to clients.
It's the only tool on our list apart from Semrush that has AI capabilities in its reporting suite. The Ask AI feature helps you get insights from your clients' SEO performance. You can use it to highlight wins or trends and match your clients' results against industry benchmarks.
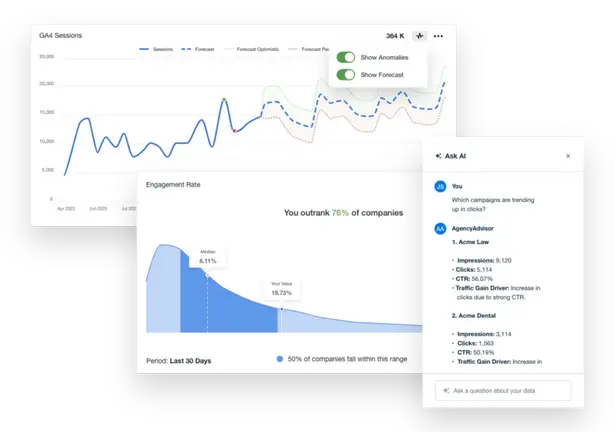
Agency Analytics AI
Once you've perfected a reporting format, you can then automate its delivery to your clients. Agency Analytics gives you the option to send regular reports via email on your desired day and time.
At a Glance: Top SEO Reporting Tools Compared
The table below offers a side-by-side comparison of key SEO reporting tools, helping you quickly identify the best option based on price, features, integrations, and ideal use cases.
Tool | Price Range | Main Reporting Features | Integration & Data Sources | Ideal Use Cases |
Semrush | Premium ($119.95+/month) with extensive features | Rank tracking, white-label options, predictive SEO, AI summaries | Google Analytics, Search Console, HubSpot, TikTok Ads, etc. | Agencies and in-house teams needing advanced reporting |
Google Analytics | Free for basic reports, but lacks advanced features | Basic traffic and user behavior reports | Google Analytics ecosystem only | Small businesses and budget-conscious marketers |
SE Ranking | Affordable ($39+/month) with scalable options | Rank tracking, backlink data, local SEO insights, white-label features | Google Analytics, Search Console, social media platforms | Agencies with a focus on local SEO and SMBs |
Agency Analytics | Moderate ($49+/month) with white-labeling options | Multi-channel integration, customizable widgets, drag-and-drop editor | 80+ integrations including Google, SEMrush, BrightLocal, etc. | Multi-client agencies needing seamless integrations |
Raven Tools | Premium ($109+/month) for cross-channel reports | Cross-channel reports, competitor analysis, visual customization | Google Analytics, Bing Ads, Facebook Ads, Looker Studio connectors | Agencies managing cross-channel campaigns and analytics |
To make the best choice, start by narrowing down two or three favorites and conducting a deeper trial run. Consider both your immediate needs, such as budget and ease of use, and future requirements, like scalability and multi-channel data integration. Take advantage of free trials, set up demo accounts, and compare how well these tools integrate with your existing tech stack.
While the table is a great starting point, exploring tool demos or documentation will provide a more comprehensive evaluation.
Turning Data Into Action: From Metrics to Meaningful Insights
All the tools we've discussed above will merely give you data. In some of them, AI features like Semrush's AI summaries may provide insightful information about the collected data, but it's still on you to decide what to do with it and how to fit it into an existing SEO strategy.
To do this, it's very important to set your objectives clearly from the start. Why are you collecting SEO data? The answer to this question depends on your business goals.
For example, if you're an eCommerce business, your objective may be to generate sales. So, you want to collect data about website traffic, conversions, purchase behavior, and revenue. Since you're focused predominantly on what you want to achieve, the data you collect and the insights you gather will be geared toward that goal.
That's exactly the approach Fattoretto agency took for its eCommerce client, MECshopping. When using Semrush for reporting, they used the Position Tracking tool to keep an eye on specific keyword cohorts. For example, when they ran a link-building or PR campaign, they only monitored the keywords those campaigns were targeting.
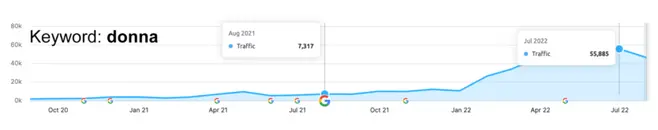
Another tactic they used was focusing on high-impact metrics rather than their vanity counterparts. In their scenario, impressions alone didn't cut it. So, they looked at traffic on the client's website during the campaign duration. With this hyper-focused insight retrieval, they were able to increase the clicks on non-branded keywords by 70%.
Besides objective-driven SEO reporting, it's also important to keep track of SEO performance over time. A linear approach to SEO reporting doesn't work because it doesn't account for changes in the market or algorithms. Instead, you must visualize SEO progress regularly to identify opportunities and give real-time reports to clients.
UR Digital, an SEO agency, uses Semrush for dynamic reports to do just this. Since the data updates in real time, they can quickly find an unusual trend or pattern that can be capitalized on. They also use the Client Portal feature, which lets their clients see the same data without the agency having to share a PDF report every time there's an update.

Semrush Client Portal feature
As you derive findings from dynamic reports, convert them into concrete actions. For example, if a page is performing well, you can transfer the link juice towards underperforming pages. Similarly, fix the issues you find in site audit reports.
When you're managing a local client with multiple business locations, keep an eye on all of them. For example, a certain location may not be ranking as well in the Map Pack compared to others. The optimal action for this insight would be to optimize the Google Business Profile for that location.
Pinnacle Treatment Centers, a local drug and alcohol addiction treatment center, uses Semrush to analyze SEO performance for 137 of their locations. They use regular reporting to improve listings and review management as required, resulting in a 100% boost in traffic.

When you're doing the same for a client, it's best to create a feedback loop. Gather data, derive insights, convert them into actions, and measure the results. Then, communicate this data to clients to keep them on the same page. Together, these tactics will make your SEO campaigns a data-driven success rather than just a data-collection exercise.
Effective Communication & Storytelling in SEO Reporting
When creating SEO reports, you should consider the recipient's SEO familiarity and understanding and not just focus on data. Presenting raw data can be overwhelming and confusing to non-technical clients.
Look at who your audience is. Are you presenting to fellow in-house marketers and SEO experts? Or is your client a business owner who has little knowledge of SEO?
Tailor your reports according to who will see them. For marketers, you can go into technical depth, but for business owners, stick to presenting the key takeaways and results. Also, add visuals to make the information easily comprehensible.
At first glance, the report should highlight the progress made or challenges faced. C-level executives are often busy and won't have time to read through a lengthy report. So, provide an overview with important stats and visuals. Show what went right in the past month (or period being reported on) and what needs improvement.
Again, keep your audience's knowledge level in mind when creating the narrative for your report. If you're adding graphs and charts, label them properly. Provide context and date ranges for the data being presented. More importantly, keep the dashboard clean and uncluttered so that your audience doesn't have to spend too much time trying to figure out what they're looking at.
Every metric you show should be connected to a real-world business outcome, such as higher revenue or more leads. For example, Universal Health Services manages its SEO in-house using Semrush. They use the Organic Positions report every month to see how their SEO content writing efforts are paying off.
Previously, the end of the year was a low-traffic season for behavioral health-related articles. However, after making certain SEO improvements using the Topic Research tool and SEO Writing Assistant, UHS saw higher visibility and greater demand.
So, they could connect their new SEO tactics and resulting metrics to a real outcome, i.e., increased demand for their services during the end-of-year period. Many of their facilities have their busiest months during November and December that year. Since the metrics were connected to a real-world outcome, the team could justify their SEO efforts and even replicate the same strategies in the following years.
When you're doing the same for your clients, you should also supplement this information with future recommendations. Share SEO next steps that will help them achieve a specific goal and how you plan to execute it for them.
Such insightful reports that actually show results rather than just numbers will show clients and stakeholders your value. They also improve transparency, which can lead to stronger relationships and more trust in your work.
Let Numbers Speak Louder Than Words With SEO Reporting Tools
As an ongoing practice, SEO needs to be continuously monitored and reported. Good thing we now have automated SEO reporting tools that save a ton of time and effort for agencies and marketers that have to present SEO results to clients or stakeholders.
With features like white labeling, scheduled reporting, pre-built templates, integrations, and more, these tools facilitate the creation of comprehensive SEO reports. But that's pretty much it.
The next step is human intervention. Here, you come in to convert the numerical information into actual insights that your clients can understand and you can work on to continue delivering remarkable results.
Frequently Asked Questions
Which SEO reporting tool is the best overall?
The best overall SEO reporting tool is Semrush. It stands out due to its robust features, including predictive SEO, AI-powered metrics, white-label reporting, customizable templates, and seamless integrations with other tools like Google Analytics, Ahrefs, and HubSpot.
Is a free tool (like Google Data Studio) enough for comprehensive SEO reporting?
Free tools like Google Data Studio (now Looker Studio) are suitable for basic SEO reporting and data visualization. However, they lack advanced features like AI insights, white-label branding, and integrations with third-party platforms, making them insufficient for comprehensive SEO reporting for agencies.
How do I automate sending reports to clients or stakeholders?
Here’s how you can automate report sending in popular SEO tools:
- Semrush: Schedule reports with custom or pre-built templates and automate their delivery via email on specified days and times.
- Google Analytics: Use the "Schedule Email" feature to regularly send pre-made reports, such as organic search traffic or engagement reports.
- Moz: Automate reports to be sent daily, weekly, or monthly based on client preferences.
- Agency Analytics: Automate delivery of white-labeled reports with more than 80 data integrations.
Can one SEO reporting tool handle local SEO, e-commerce, and SaaS all in one?
Yes, they can. Here’s a table that summarizes the capability of tools for different needs:
| Tool | Local SEO | E-commerce | SaaS |
|---|---|---|---|
| Semrush | Excellent for local citations, | Advanced reporting with keyword | Predictive metrics and AI tools |
| GMB insights, and review stats. | tracking and revenue tracking. | for SaaS strategies. | |
| SE Ranking | Local SEO campaign reports, | Backlink data and product-level | Keyword difficulty and rank |
| including review reports. | SEO insights. | tracking. | |
| Agency Analytics | GMB integration, map rankings. | Multi-client e-commerce SEO | SaaS integrations and analytics. |
| Google Analytics | Basic tracking for all three | Audience and conversion insights | Limited without integrations. |
What metrics should be included in an SEO report to prove ROI?
To prove ROI in SEO, you should include these key metrics:
- Traffic Metrics: Organic traffic, direct traffic, and new vs. returning visitors.
- Engagement Metrics: Bounce rate, average session duration, and pages per session.
- Conversion Metrics: Goal completions, revenue from organic traffic, and lead form submissions.
- Keyword Performance: Rankings, search volume, and keyword difficulty.
- Backlink Data: Number of backlinks, referring domains, and domain authority.
- Local Metrics (if applicable): Google My Business performance, map pack rankings, and local reviews.
Do I need separate tools for technical SEO audits versus ongoing rank tracking?
While some tools handle both tasks, using dedicated tools for each often yields better results. For example:
- Technical SEO Audits: Semrush, Moz Pro, and Screaming Frog are ideal for identifying site errors, Core Web Vitals issues, and indexing problems.
- Rank Tracking: SE Ranking, Moz, and Semrush excel at tracking keyword positions and SERP performance.
How do I integrate Google Search Console and Google Analytics data into a single report?
Integrating Google Search Console and Google Analytics into a unified report can be simplified with tools like Looker Studio or Agency Analytics:
- Looker Studio: Connect both tools as data sources and use visualizations to display traffic, search queries, and keyword performance side by side.
- Agency Analytics: Use its drag-and-drop report builder to combine metrics like traffic, impressions, and click-through rates into one white-labeled report.
Which tools offer white-label or branded reports for agencies?
Here’s a table summarizing white-label reporting features across tools:
| Tool | White-Label Features |
| Semrush | Custom logos, colors, and themes; AI summaries available. |
| SE Ranking | Drag-and-drop customization with branding and client logos. |
| Agency Analytics | Fully customizable branding, widgets, and scheduling options. |
| Moz | Offers branding but with limited customization. |
What’s the best way to present competitor analysis in SEO reports?
To effectively present competitor analysis:
- Highlight competitor traffic trends, keyword rankings, and domain authority.
- Use visual aids like bar graphs or pie charts to compare metrics.
- Incorporate tools like Semrush’s Domain Comparison or Moz’s competitive analysis templates.
- Provide actionable recommendations based on the analysis, such as targeting high-ranking competitor keywords.
How often should I generate SEO reports—weekly, monthly, or quarterly?
The frequency of SEO reports depends on the audience and campaign:
- Weekly: For in-house teams and campaigns with frequent changes or testing.
- Monthly: Most common for client reporting, summarizing overall progress and trends.
- Quarterly: Ideal for high-level overviews for C-level stakeholders or longer-term strategy evaluation.
Is there an easy way to show results from PPC or social channels alongside SEO data?
Tools like Raven Tools and Agency Analytics integrate data from SEO, PPC, and social media campaigns, allowing you to display cross-channel results in a single report. You can use visual widgets to compare metrics like clicks, traffic, and conversions across platforms.
How can I tailor SEO reports so that non-technical clients understand the insights?
To make SEO reports more digestible for non-technical clients:
- Use visuals like graphs, charts, and AI-generated summaries.
- Focus on actionable insights, such as what improved and next steps.
- Avoid jargon and explain metrics like "CTR" or "bounce rate" in plain language.
- Provide a high-level overview at the start of the report, summarizing key wins and challenges.