Whether selling online or through traditional stores, most brands keep a close eye on the performance of their sales channels. Online platforms have recognized this need for performance data, and most now provide some form of analytics and dashboards detailing how your products have performed on their channel. Unsurprisingly Amazon is a leader in this and offers a variety of dashboards that can assist sellers on the platform. It has relatively recently released the Amazon Search Query Performance Dashboard as part of the Brand Analytics tool, featuring in-depth analytics relating to search queries on the platform.
Amazon's Search Query Performance Dashboard:
- What is the Amazon Search Query Performance Dashboard?
- What Metrics Can You Find in the Search Query Performance Dashboard
- How to Use Amazon's Search Query Performance Dashboard to Your Advantage
- Improving Your Click-Through Rate (CTR) on Amazon
- Tie in the Keyword Data from Your Search Query Performance Dashboard with Amazon’s Product Opportunity Explorer
What is the Amazon Search Query Performance Dashboard?
Amazon launched the Amazon Search Query Performance Dashboard in 2022, alongside the Amazon Search Catalog Performance Dashboard, to give Amazon brands and sellers better insights into the search terms shoppers use on the platform. Both these dashboards form part of Amazon’s Brand Analytics, along with:

- Amazon Search Terms Report – features aggregate data on how customers find products in the Amazon store through search terms (both your and your competitors’ products)
- Demographics Dashboard – provides information about your viewers, e.g., their age, gender, household income, marital status, and education
- Item Comparison Report – presents you with data for the top five products viewed on the same days as your products, e.g., the percentage of time that each was viewed
- Alternate Purchase Report – how often viewers purchased others’ products instead of your own
- Market Basket Analysis Dashboard - provides data on what other products are purchased most frequently alongside your products, in the same purchase
- Repeat Purchase Behavior Report - shows you the number of orders placed for each product over a selected period, as well as the number of customers who placed those orders, comparing orders and unique customers to identify repeat purchasers
The Search Catalog Performance Dashboard takes a broader sweep than the Amazon Search Query Performance Dashboard, offering an overview of each relevant ASIN with how many impressions/clicks each gets for all search queries.
According to Amazon, Brand Analytics contains valuable insights to empower brand owners to make informed, strategic decisions about their product portfolio and marketing and advertising activities.
As with all the Brand Analytics, you must first own a brand to have access to the Amazon Search Query Performance Dashboard. To gain access, Amazon requires that you be internal to your brand and responsible for selling the brand in the Amazon store.
The Amazon Search Query Performance Dashboard shows brand owners how customers are searching for your brand, focusing on the search results stage.
What Metrics Can You Find in the Search Query Performance Dashboard
You can use the Search Query Performance Dashboard to discover the top search terms associated with your branded products based on customer search behavior. It provides you with data relating to query volume, impressions, clicks, add-to-cart, and buys. It includes both organic and paid search data based on actual search queries and Amazon’s first-party data. You can view your data in either Brand View or ASIN View (ASIN - Amazon Standard Identification Number). You also need to select a reporting range, i.e., dates, for your dashboard. You can set a reporting period going back two years, compared to just 90 days of data available in your Advertising Console’s Advertised Product report.
One of the first things you will notice when you open the Search Query Performance Dashboard is that it includes up to 1000 Queries (keyword terms people have searched for), one query per row. Much of the data presented are grouped under the headings of:
- Search Funnel Impressions
- Search Funnel Clicks
- Purchases and Add-to-Carts
Some of the specific metrics you can find from the report include:
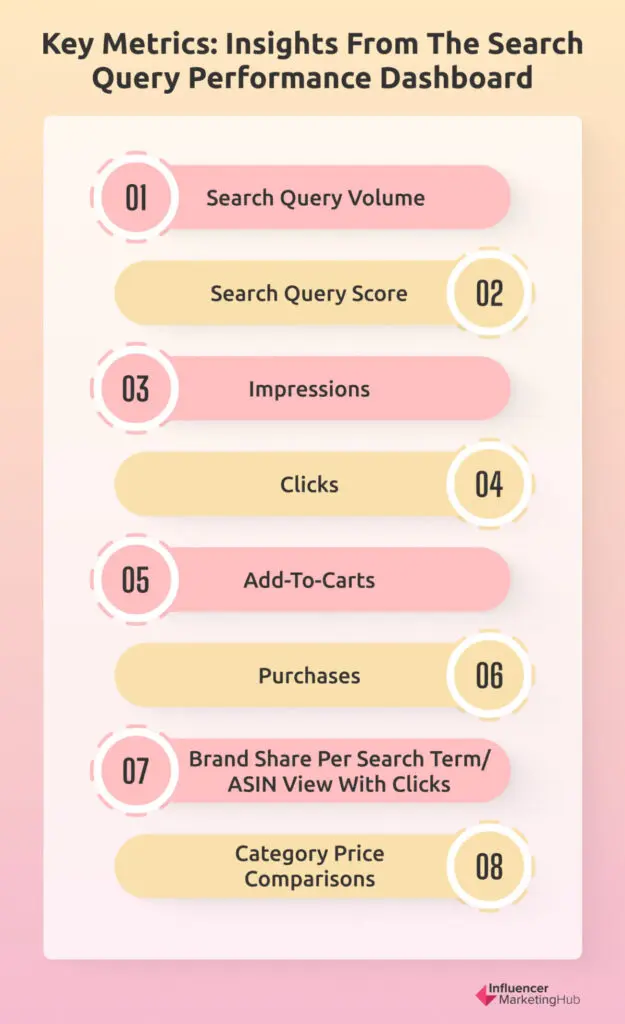
- Search Query Volume (the total number of search queries for each keyword term)
- Search Query Score (1-1000)
- Impressions (the number of products that appear on the Amazon search page when shoppers search using the query – both organic and paid)
- Clicks (the number of times a customer clicks on products appearing on the search result page after searching by the query – both organic and paid)
- Add-to-carts (the number of times buyers added the appropriate product to their carts after searching by a query on Amazon)
- Purchases (the number of times shoppers ordered the product after using the search query)
- Brand share per search term/ASIN view with clicks
- Category price comparisons
You can find data relating to each relevant keyword for your brand, providing much useful information to help you at all stages of the sales funnel. This can be particularly useful when searching for terms to include in your PPC ads.
How to Use Amazon's Search Query Performance Dashboard to Your Advantage
The most common use of the Search Query Performance Dashboard by Amazon sellers is typically by ASIN view. This tells you about the precise keywords for which your products rank, along with the search volume, and gives you a good indication of the search terms where it is worth focusing your marketing efforts on. Search volume is vital, as ranking highly for a keyword term is only relevant if sufficient potential buyers search for that term.
However, there is one noticeable omission from the data supplied in this dashboard by Amazon. It doesn’t tell you your search ranking. For example, you might notice that you score well for quite a few popular keywords in your niche – but your Search Query Performance Dashboard doesn’t indicate how this compares with your main competitors.
You can gain some indication of your brand’s relative performance by looking in the Impressions section for each keyword. In this section, you can order your keywords by Impressions, Brand Count, or Brand Share.
Amazon defines Impressions as being the number of different ASINs from your catalog that were “impressed”, after the search query was performed, Brand Counts are how many times one of your brand’s ASINs was impressed, and Brand Share is the percentage of impressions for your brand’s ASIN versus overall impression count. Brand Count recognizes that you may have multiple products ranking for a particular keyword, particularly if you are a market leader for a type of product.
You can use all the data you find here to discover which of your products rank most often on searches on Amazon, along with the terms that people use. You will probably find that you currently gain most of your conversions from a relatively small number of search terms. By a combination of adjusting the copy on your sales pages and creating targeted PPC ads, you can hopefully increase your conversions for a selection of other promising keyword terms that show up in your Search Query Performance Dashboard. You can learn more about how to make the most of these promising keywords in our Definitive Guide to Amazon Search Terms Optimization.
It is important to remember that the data shown in your Amazon Search Query Performance Dashboard reflects search engine results pages (SERPS). it does not include any data relating to customers who go directly to a product page without a search. It also ignores sales generated through detail pages or widgets.
Improving Your Click-Through Rate (CTR) on Amazon
Most Amazon sellers aim to improve their CTR on the platform. You can calculate CTR as being:
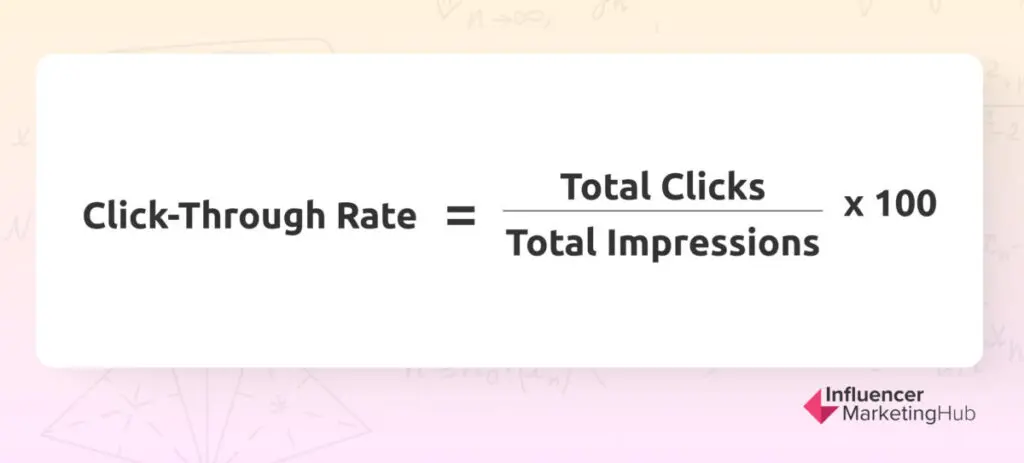
The higher the CTR for a product, the more interest consumers have in it. A low CTR suggests that people have little interest in a product or listing. As the Amazon Search Query Performance Dashboard includes both clicks and impressions for each query (keyword term) you should be able to calculate the relevant CTR for each term, for each relevant ASIN, product, and even brand.
Although factors vary, you can consider a CTR of over 0.5% as being good. CTRs below 0.3% indicate that you might need to reconsider your advertising and other copy on Amazon.
The best way to improve the overall CTR for your products on Amazon is to ensure that your product listings correspond to the terms people use to search on the platform. Use the top-performing keywords (as shown in the Search Query Performance Dashboard) in your product title, descriptions, and advertising campaigns.
However, don’t just go for the high-volume keywords – you have many potential sales from people using long-tail search terms. Use a mix of high and low search volume terms. With your PPC ads, you can also negate any search terms receiving a high number of impressions but a low number of clicks. Likewise, negate search terms that may have high CTRs but low sales – they are most probably irrelevant to your needs.
Every time you run your Amazon Search Query Performance Report, put the data through a spreadsheet (or whatever other tool you may use) to calculate the current CTRs and look for new terms to feature in your advertising campaigns, possibly starting with manual campaigns to test their performance.
Using the Brand Share Data
You can use Brand Share data in the Purchases section to determine how likely people are to click on your product listings in their search results. For example, if your Brand Share for Purchases is low, it may indicate that people are reluctant to click on your search listings and ads, and you need to improve your product titles and images. If your Brand Share for Add-to-Cart is low, it may indicate that people are not sufficiently interested in your product description (or pricing) to push the Buy Now button.
Tie in the Keyword Data from Your Search Query Performance Dashboard with Amazon’s Product Opportunity Explorer
Over the last year, Amazon has made huge strides in improving the analytics and reporting tools it offers its sellers. Another useful tool they released in 2022 was the Product Opportunity Explorer, which gives sales data and search volume for search queries.
Product Opportunity Explorer helps Amazon sellers generate new product ideas by better understanding customer demand. It takes a broader picture than your Search Query Performance Dashboard because it doesn’t restrict itself to data related to you alone. It provides up-to-date data and insights on customer needs and existing products available in Amazon’s store, and you can use it to help you find opportunities for expansion on the platform.
Product Opportunity Explorer uses niches, a collection of search terms and products representing a specific customer need. Amazon groups these search terms into niches based on the types of products customers view or purchase. Each niche has a details page providing additional information like current products within the niche, top search terms, and statistics about new product launch potential.
You will also find Customer Review Insights in the Product Opportunity Explorer. These convert millions of Amazon reviews into product development insights, indicating the features customers love or don’t love about current products, how those features impact your star rating and potential feature and performance gaps in your current selection. They can give you a good insight into customer pain points.
The third component of Product Opportunity Explorer is Insights (not to be confused with Customer Review Insights) which can help you understand specific dynamics in a niche, including how many products are already available, the launch potential for new products, and overall customer experience.
Wrapping Things Up
Amazon now supplies a steady stream of data to its sellers, particularly those who can claim ownership of a brand. Amazon’s Brand Analytics now provides a plethora of information that you could previously have only obtained using a third-party product. Of course, those platforms haven’t sat back on their laurels, and have continued to add additional data and dashboards to improve and add value to their Amazon seller customers’ experiences.
The jewel in Brand Analytics’ crown is undoubtedly the Amazon Search Query Performance Dashboard. This effectively provides data for your full funnel at ASIN and brand level (excluding users who don’t make specific queries while on Amazon). You can adapt your listings and PPC ad campaigns to reflect the top-ranking relevant keywords and ensure you don’t waste your funds and energies on irrelevant terms or those that nobody uses.

