Brands are encouraged to use multiple marketing channels. However, with that comes the tough challenge of ensuring that the message you’re sharing is consistent.
So, what are brands to do?
The answer — integrate integrated marketing services into their approach.
From benefits to brands using it effectively, here’s an in-depth exploration into integrated marketing.
What Is Integrated Marketing?
Integrated marketing is the practice of delivering the same core messaging by aligning all your marketing channels such as:
- Your business website
- Paid search and social ads
- Emails
- In-store display
- TV ads
- Billboards
The result — a unified and consistent brand experience and message, irrespective of the channel customers use to interact with your brand.
You’ll essentially need to:
- Maintain the same visual aesthetic
- Deliver the same promotional messages
- Use the same tone across all those channels
Integrated vs. Digital Marketing: What’s the Difference?

There are two main differences between integrated and digital marketing.
Firstly, digital marketing focuses on only digital channels. Integrated marketing, on the other hand, aligns both online and offline channels.
Secondly, a digital marketing strategy doesn’t necessarily prioritize delivering the same core messaging through different channels. Your messaging can be as disjointed or as consistent as you want it to be.
However, the main purpose of integrated marketing is to ensure consistency in messaging across all the channels you use.
So, not all digital marketing campaigns will be integrated. However, it’s safe to say that integrated marketing will always have an element of digital marketing.
What are the Benefits of Integrated Marketing for Businesses?
Integrated marketing may seem like a lot of (more) work. Here’s what’s in it for your business:
1. Top-of-mind awareness
The marketing landscape is noisy. Consumers are constantly exposed to advertising and marketing messages from brands, making brand recall difficult.
Integrated marketing addresses this challenge by delivering the same message consistently through multiple channels. This means you’re constantly reminding the audience about your message, making your brand more memorable to them and creating top-of-mind awareness.
2. More opportunities to connect
In integrated marketing, your audience will come across your messaging through various channels. From offline channels such as billboards on their way to work to online channels like email newsletters, Google search results pages, social media, and more – you’ll be creating multiple opportunities for them to connect with your brand, whether they’re commuting, at work, in store, or relaxing.
Basically, from the minute they wake up to when they go to bed, integrated marketing allows you to build and grow connections.
It also increases the likelihood of them interacting with your brand. The easier it is to connect with you, the more likely your audience will take action.
For instance, maybe they came across your in-store display while they were running errands but were too busy to follow up. After a couple of days, they find your ad promoting the same offer, while scrolling through Instagram. This ad then becomes a powerful reminder to check out your online store and likely make a purchase.
3. Fewer marketing costs
With integrated marketing, marketing teams can optimize their resources which could result in fewer marketing costs. Instead of having to develop a separate creative completely from scratch for each channel, you just have to make some adjustments and format certain elements based on the medium, like the multimedia or font.
For example, the video that you’ve used for a social media post will have to be replaced by a photo when creating a billboard. However, the messaging can essentially stay the same.
4. Analytics
Integrated marketing allows you to collect customer data from multiple sources. This gives you a comprehensive view into your audience so you can understand their preferences and buying behavior.
More specifically, you can compare platforms to identify which channels generate better results and adjust your marketing efforts (and budget) accordingly.
How Do You Create an Integrated Marketing Strategy?
Before you can create your first campaign, you need a strategy. Here’s how:
Step 1: Start with a defined goal and target audience
Raising brand awareness, driving more sales, and increasing store visitors are all examples of marketing campaign goals. Not all campaigns are created to push a sale. A clearly defined will give you a sense of direction.
Then, to know which path to take, identify your target audience. Put simply, which type of people do you want to reach?
Your target audience will determine which marketing channels and types of creative will deliver the most impact. For example, if you’re mostly targeting Generation Z, YouTube, Instagram, and TikTok are must-use channels.
Here’s how Gen Z’s social media platform usage compare to the general population:
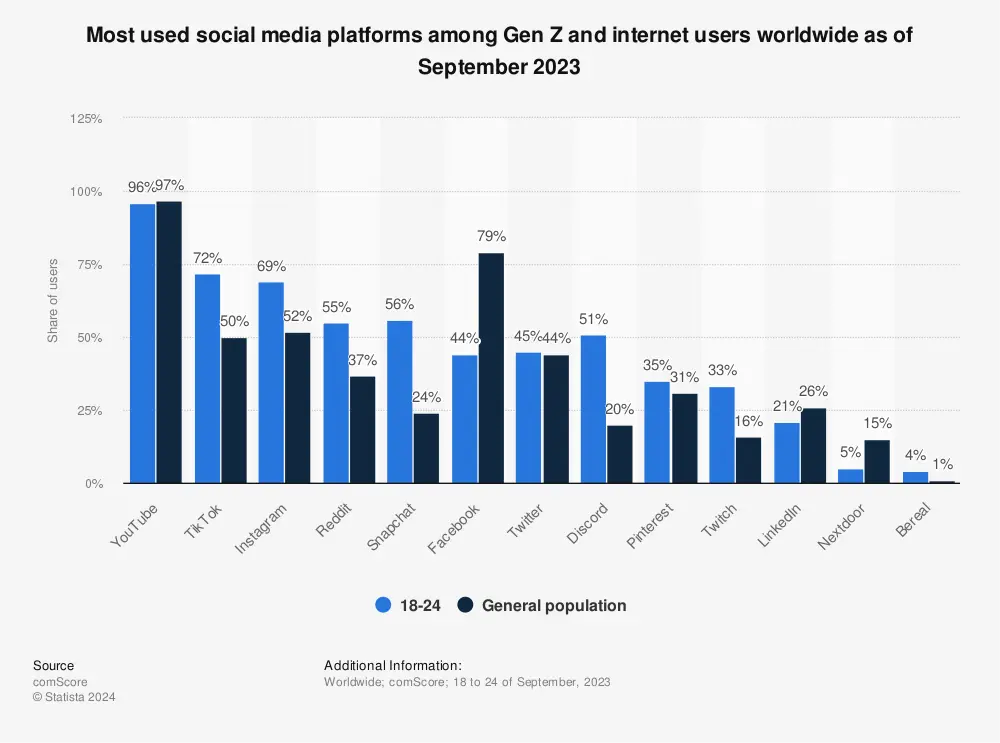
You can then divide your broad target market into smaller groups of consumers based on common characteristics like needs, priorities, and interests. This allows you to personalize your messaging accordingly.
Step 2: Finalize your core messaging and branding
With what you have so far, it’s time to come up with the core messaging that you want to promote through this campaign. This can include a campaign slogan or tagline that will be pushed consistently across all your marketing channels. It has to be simple, yet creative. That’s the formula for leaving an impact on your target audience.
For example, Old Spice’s award-winning “Smell Like a Man, Man” campaign, one of the most successful marketing campaigns to date, promoted the messaging that their product is what people need to smell like a man.
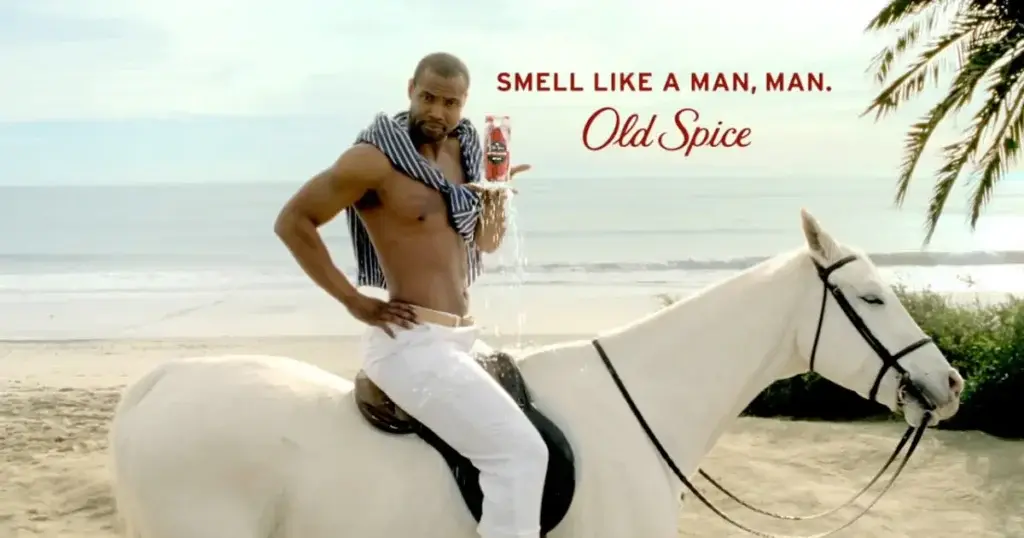
Source: adweek.com
Your brand messaging should also summarize your:
- Brand values
- Its mission
- Unique selling propositions (USPs)
For example, for Mailchimp productivity and positivity are core company values.
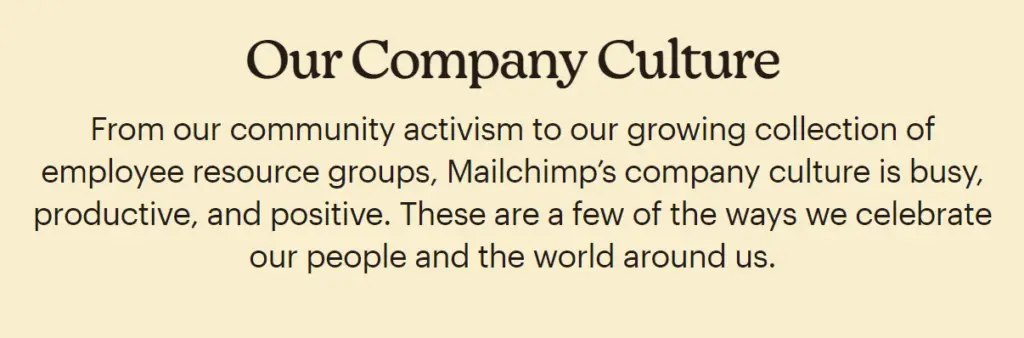
Source: mailchimp.com
You’ll use this to create your brand’s voice and tone.
To use the example of Mailchimp again, they use a conversational voice that incorporates offbeat humor. That said, nothing is more important than clarity. It’s more important that their message is clearly understood.

Source: styleguide.mailchimp.com
This information can be saved in your branding kit. Here, you can also keep other elements, like fonts, colors and logos, that need to remain visually consistent.
You can, for example, use a tool like Canva. It has a Brand Kit feature where you can upload and save:
- Logos
- Colors
- Fonts
- Brand voice
- Photos, graphics, and icons

This helps to ensure brand recognition and message continuity.
Step 3: Decide on Your Marketing Channels
As mentioned earlier, the marketing channels that you’ll use will largely depend on the type of audience you want to target. You want to reach them where they are.
Here are a few options that you can consider including in your integrated marketing mix:
- Social media
- Display advertising
- Search engine marketing
- Events
- Billboards
- Television advertising
- Podcasts
- Radio advertising
- Print advertising
For example, if you’re targeting teens, social media is a must. More specifically, you’ll want to be on YouTube and TikTok. Pew Research Center reveals that nearly 20% of teens admit that they’re almost constantly on these two platforms.

Source: pewresearch.org
When selecting your channels, you’ll also need to consider which type of content they engage with more. For example, if they prefer interactive content like quizzes, select channels that allow you to add this type of content.

Source: semrush.com
A third consideration is the channel’s potential return on investment (ROI). Our Digital Marketing Benchmark Report 2024 found that social media and email are two of the marketing channels that deliver some of the highest ROI.

Each channel will need a dedicated manager. It will be the channel manager’s responsibility to post the content, monitor activity, and track the campaign’s performance on this channel.
Not only is it too much workload for one person to oversee all the different channels, but each channel has its own trends and best practices that continuously change. For example, on TikTok behind-the-scenes videos and duets are popular content types, while meme marketing and live content will generate better results on Instagram.
Step 4: Plan Your Content
You’ll need a content plan. Semrush suggests that you list the following:
- Type of content
- Plans for distribution
- How you’ll repurpose it for the identified channels
Use the idea for the campaign and outline on your marketing calendar which type of content will cover which topic. By plotting these ideas on a calendar, you’ll also have a timeline.
You can, for example, use a tool like Trello that has several calendar templates. It uses intuitive, drag-and-drop features which make it easy to modify a template to fit your needs.

Step 5: Track, Analyze and Adjust
Finally, once your campaign has launched, you’ll want to keep a close eye on its performance to see how well it’s working and whether you need to make any adjustments. This would involve using analytics tools to keep track of relevant performance metrics such as:
- Reach
- Impressions
- Engagement rate
- Conversions
If your numbers are below channel benchmarks, you might need to make adjustments in some areas of your campaign. For example, you can consider running paid promotions on social media if your organic reach is on the lower side. Or, if you’re already using paid social ads, you might want to adjust your budget and spend it on other channels that are delivering a better return.
Then, once an integrated marketing campaign has ended, you want to break down its overall performance. While you can’t use this information to make real-time adjustments, you can still use it to improve your next campaign. Plus, you’ll probably need a report to share with your client or manager.
Integrated Marketing Success Stories
Here are some of the top integrated marketing examples to serve as inspiration:
Coca-Cola: “Share a Coke” Campaign
The “Share a Coke” campaign from Coca-Cola is undoubtedly one of the most successful integrated marketing campaigns of all time. First launched in Australia, it has since been launched in over 70 countries.
For this campaign, the brand introduced new labeling that replaced the brand name with people’s names to build that human connection. The core message was to urge people to share a coke which was then adapted across multiple channels.
This integrated marketing communication strategy was able to maintain branding consistency by sticking to the brand’s iconic red and white color, along with the typography.
Offline channels included:
- Billboards
- Print ads
- Point-of-purchase displays

Source: thebigad.com

Source: coca-cola.com
Their campaign also relied heavily on online channels which included videos on YouTube and static social media posts on Facebook.
Additionally, customers were encouraged to create user-generated content with a photo of their personalized cans along with the hashtag #ShareACoke.
GoPro: Be a Hero Campaign
GoPro’s “Be a Hero” campaign encouraged users to share their unique experiences, whether they’re going on a skydiving adventure or picnicking with the kids. The brand’s integrated marketing communication was promoted through multiple mediums including:
- In-store displays
- Billboards
- Magazines
- Digital advertising
- Social media
- TV advertisements
These channels showcased different experiences but consistently maintained a single core messaging – that of personal heroism.
It focused on the idea that everyone can be a hero in spite of their interests and experiences. The campaign and messaging continued even during the height of the pandemic, where the brand encouraged people to “be a hero” by staying at home and shared creative photos and videos taken at home using a GoPro.
Not all heroes wear capes.
Somedays, they wear robes.Be a HERO. Stay home. ?
Read more about GoPro's efforts on the Inside Line. ?https://t.co/XA9QiIkOcg
? GoProFamily member Ryan Kontra#WorldHealthDay pic.twitter.com/rJZ2b96vZb
— GoPro (@GoPro) April 7, 2020
Barbie: “Did we do ‘Kenough’”

Source: shortyawards.com
For an example of a more recent integrated marketing campaign, there’s the award-winning work PHD UK to help Warner Bros. Discovery with Barbie the Movie’s release. The goal was to make Barbie omnipresent across digital and physical spaces. This included offline channels, like window displays, to popular social media channels such as Pinterest and TikTok. All these communication touchpoints incorporated its trademark pink and a positive tone.
The campaign ran for eight months, proving that integrated marketing often takes a long-term approach.
It also serves as a great example of why it’s important to identify your target audience. The target audience for the movie wasn’t the same as for the doll. While the movie didn’t target young girls, it had a much broader appeal. If they were to target it at preschoolers, it would’ve been a complete failure as the actual movie carries an age restriction of PG-13.
Key Takeaways
Integrated marketing is both an art and a science. By weaving together different marketing channels into a cohesive strategy, you can deliver a consistent and compelling message to your audience.
One of the critical takeaways is the importance of maintaining visual consistency and using the same tone across all your marketing materials. Whether it's your social media posts, email campaigns, or website content, the unified look and feel helps in building brand recognition and trust.
Another key aspect is selecting the appropriate channels for your integrated marketing campaign. Not all platforms will serve your objectives equally well. It's essential to understand where your target audience spends their time and which channels are most effective for delivering your message.
Implementing an integrated marketing strategy might seem daunting at first, but the rewards are well worth the effort. By focusing on consistency and choosing the right channels, you can create a powerful, unified brand presence that resonates with your audience wherever they go.
Frequently Asked Questions
How do you create an integrated marketing campaign?
Here are the steps to creating an integrated marketing campaign:
- Identify your campaign goals
- Research your target market
- Select your marketing channels
- Assign channel managers
- Create content for the different channels
- Track analytics
What are examples of successful integrated marketing campaigns?
The following brands have created some of the best integrated marketing campaigns:
- Coca-Cola
- Casper
- Spotify
- Warner Bros. Discovery
- GoPro
- Domino’s
- Dove
- Old Spice
Which common mistakes do brands make with integrated marketing?
Common integrated marketing mistakes include:
- Message inconsistency
- Failing to combine data from various channels
- Misaligning timelines and priorities
- Overcomplicating the campaign
- Ignoring mobile optimization
- Overlooking the customer journey


