eCommerce was already taking on a significant role in the marketplace before the arrival of Covid-19 in 2020. However, the onset of the pandemic and its resulting lockdowns forced eCommerce to become the shopping method of choice for many people. Covid-19 led to a surge in eCommerce and the rapid development of new systems to cope with the change.
Even computer-illiterate Baby Boomers took to new digital devices to order their groceries and virtually everything else imaginable. Postal services worldwide, many of whom had previously downsized because of reduced letter-writing, suddenly found themselves drowning in an avalanche of packages. New Zealand Post, for example, has had to place a short-term moratorium on collecting mail for delivery within Auckland for a while – they simply don't have the capacity to collect and store it, thanks to massively increased demand for at-home delivery. Similarly, some supermarkets have no spaces left in their delivery schedules for a month and are asking even the sick and elderly to find somebody to come in-store and collect their groceries.
Yet as we approach 2022, the world is beginning to reopen. Covid isn't defeated yet, but much of the world is learning to live with it around them. As a result, bricks and mortar stores are reopening, and people are returning to work. However, that hasn't meant a return to the pre-Covid ways of doing business. Sure, eCommerce's rapid growth has slowed over the last year, but it is still increasing in popularity and is never likely to revert to the old (pre-Covid) days. Most businesses, even many small neighborhood traders, had to develop an online presence to survive Covid. Now they have webpages and online marketplaces, and they aren't going to shut them down, even when they open their physical stores. Moreover, it is no longer a case of eCommerce OR physical trading. Many businesses now offer customers a choice and operate both systems side-by-side.
Our eCommerce Benchmark Report 2022 has collated statistics and data relating to eCommerce, predominantly over the last 12 months. We also look at some of the trends of the Covid era and look towards the future.
eCommerce Benchmark Report 2022:
- eCommerce Average Order Value
- Transaction Path Length
- eCommerce Traffic Source
- eCommerce Conversion Rates
- Cart Abandonment Rate
- Google Ads
- Google Shopping
- Annual eCommerce Growth Rate
- Customer Retention by Vertical
- eCommerce Margins by Business Model
- Average Page Views Per Consumer
- Mobile vs. Desktop Purchases
- Consumers Who Research Online and Then Purchase In-Store
- What do Consumers Most Value from Online Retailers?
- Impact of Covid 19 on eCommerce
- Trends for 2022
- eCommerce Opportunities
- European-Only Statistics
- External Sources
eCommerce Average Order Value
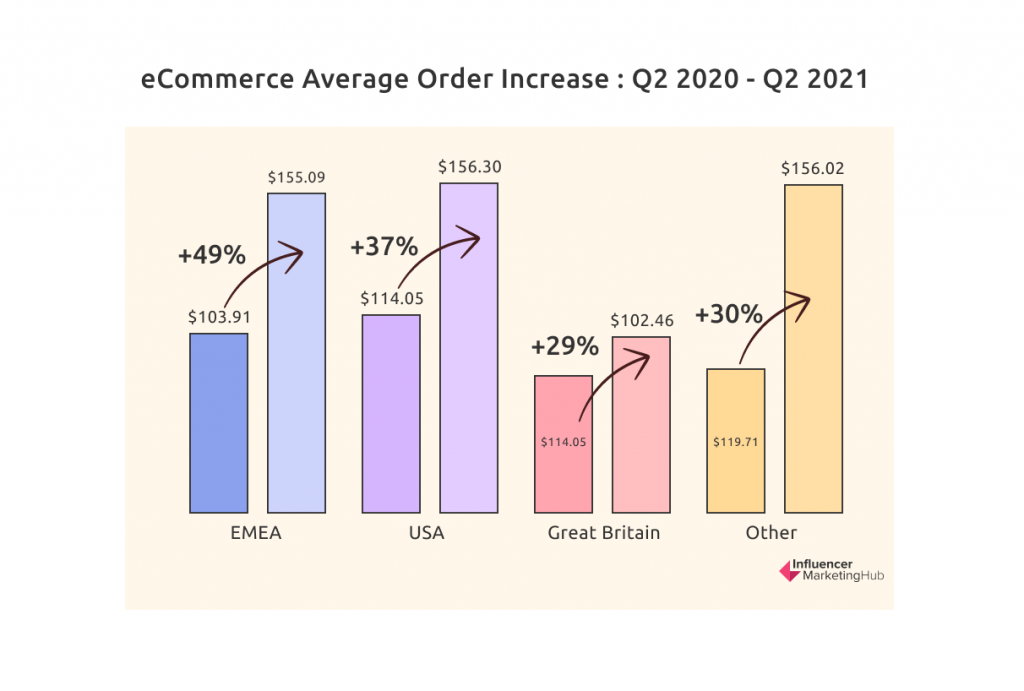
Sizable Increase in the Average Order Value in Most Places Over the Last Year
KIBO separates its statistics by region into the USA, GB (Great Britain), EMEA (Europe, the Middle East, and Africa), and Other. All four regions saw a sizable increase in average order value between Q2 2020 and Q2 2021.
The most significant increase was in the EMEA countries, with the average order value increasing 49% from $103.91 to $155.09. In the US, the average order value rose 37% from $114.05 to $156.30. In Other, there was a 30% rise from $119.71 to $156.02, and in Great Britain, it was up 29% from $79.59 to $102.46.
The USA saw the highest rise between Q1 and Q2 2021 (22%), probably due to that region opening back up considerably during that quarter. Concert venues, hotel bookings, and flight bookings contributed to this increase.
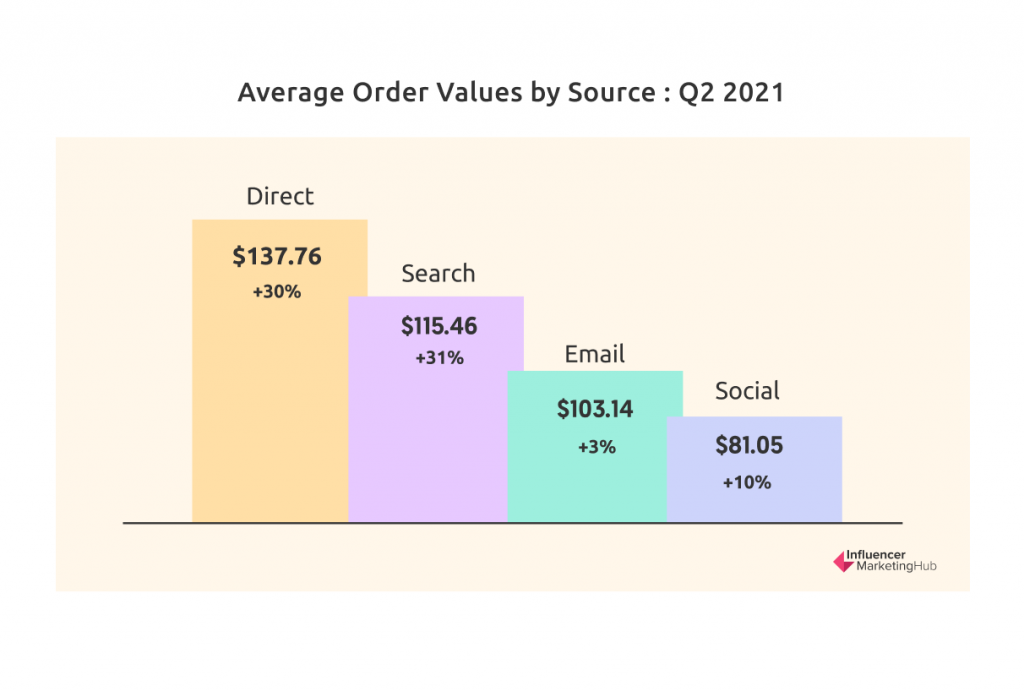
Direct Traffic Brings the Highest Average Order Value by Source
The four main channels bringing traffic to eCommerce stores are Direct, Email, Search, and Social. All channels saw an increase in the average order value over Q2 2020 to Q2 2021, although Direct and Search saw the most significant percentage increases. Email saw the smallest increase since email clicks often generate more revenue than organic search traffic and weren't affected during the pandemic.
By Q2 2021, the average order values by source were Direct $137.76 (+30%), Email $103.14 (+3%), Search $115.46 (+31%), and Social $81.05 (+10%).
Greatest Growth Sector for eCommerce Average Order Value is Electrical and Commercial Equipment
IRP collects a range of eCommerce market data and eCommerce benchmarks each month. They found that the average order value grew by 14.94% in the year to August 2021.
The Electrical and Commercial Equipment market saw an increase in average order value of 76.21% (alongside a 104.49% increase in the average sale price per item). The second-highest growth in average order value was Baby & Child (a 35.99% increase).
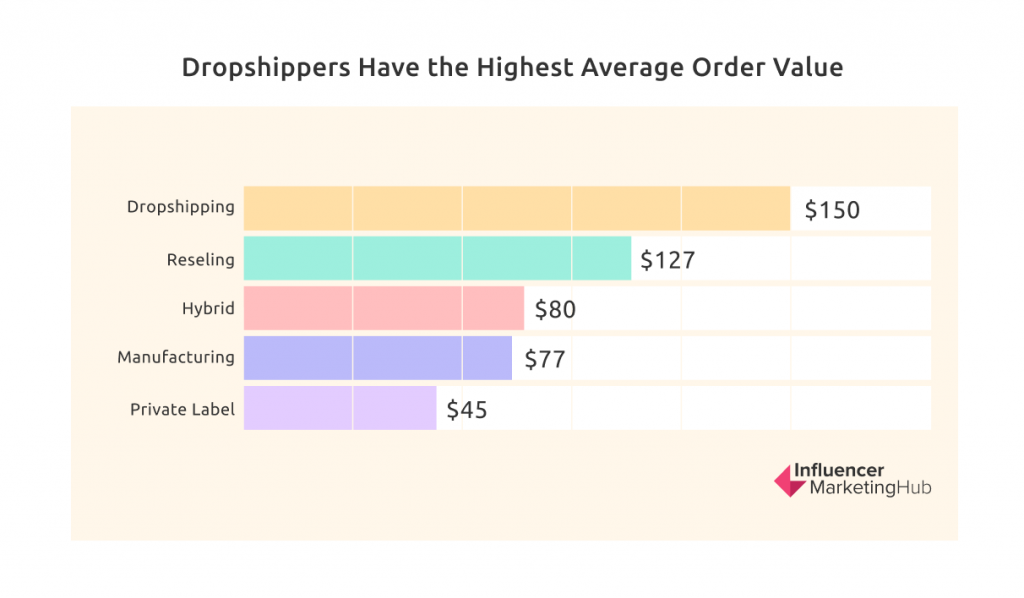
Dropshippers Have the Highest Average Order Value When Analyzing by Business Models
When we look at average order value by business model, dropshipping tops with an AOV of $150. This is followed by Reselling ($127), Hybrid ($80), Manufacturing ($77), and Private Label ($45).
Sellers on Amazon Have Considerably Smaller Average Order Value Than Those Using Their Own Store
There is a notable variance between those firms predominantly selling on Amazon and those using their own store. For example, those brands primarily selling on Amazon's platform have an average order value of $37, compared to $115 for those using their own store.
Transaction Path Length
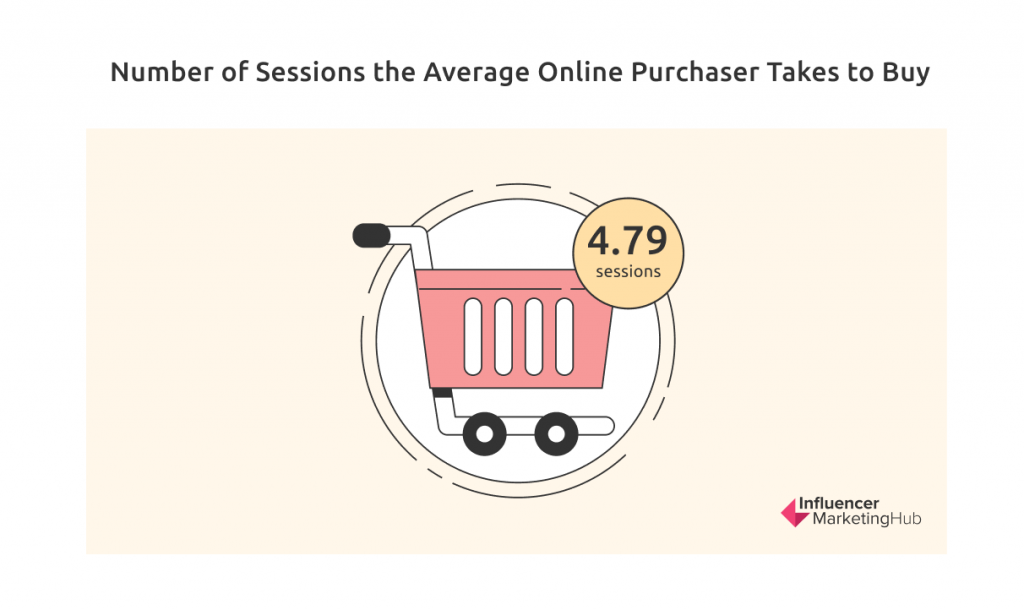
The Average Online Purchaser Takes 4.79 Sessions Before Buying
Wolfgang Digital collated a range of website engagement metrics for their 2020 KPI Report, including the Average Sessions Per User. You can gather this information for your eCommerce site deep within your Google Analytics.
They found that the average online purchaser requires about 2.5 times as many clicks as the average visitor before purchasing. The best-performing websites can attract a user back repeatedly, increasing their Average Sessions per User. Wolfgang found that higher Average Sessions per User is a key differentiator for high-performance websites.
Overall, purchasers averaged 4.79 sessions, compared to just 1.7 for the average site user. This increased to 5.21 for online-only stores, 5.71 for retailers, and 5.94 for multi-channel sites. The figures for the travel sector were considerably lower, averaging just 2.90 sessions/purchaser overall, with 3.14 for those buying tickets and 2.75 for people booking into hotels.
Shoppers Use a Variety of Online Sources During Their Shopper Journey
Online shoppers use a range of sites as they go through their purchasing journey. They shop using retailer eCommerce stores, along with traditional search engines and social media platforms. Kantar surveyed 500 online purchasers and 200 industry professionals and found that 50% of the purchasers searched for inspiration on Instagram, 50% discovered new products or brands on Google, 63% did their initial product research on Amazon, and 63% compared products or prices on Walmart.com.
Online Shoppers Most Likely to Visit Retailer Websites/Apps (37%) Than Any Other Touchpoint
Most online purchasers say they are influenced primarily by online touchpoints. However, nearly one-third say that offline touchpoints helped them make their purchase decision. According to Kantar's respondents, the most common pre-shop touchpoints for online purchasers are:
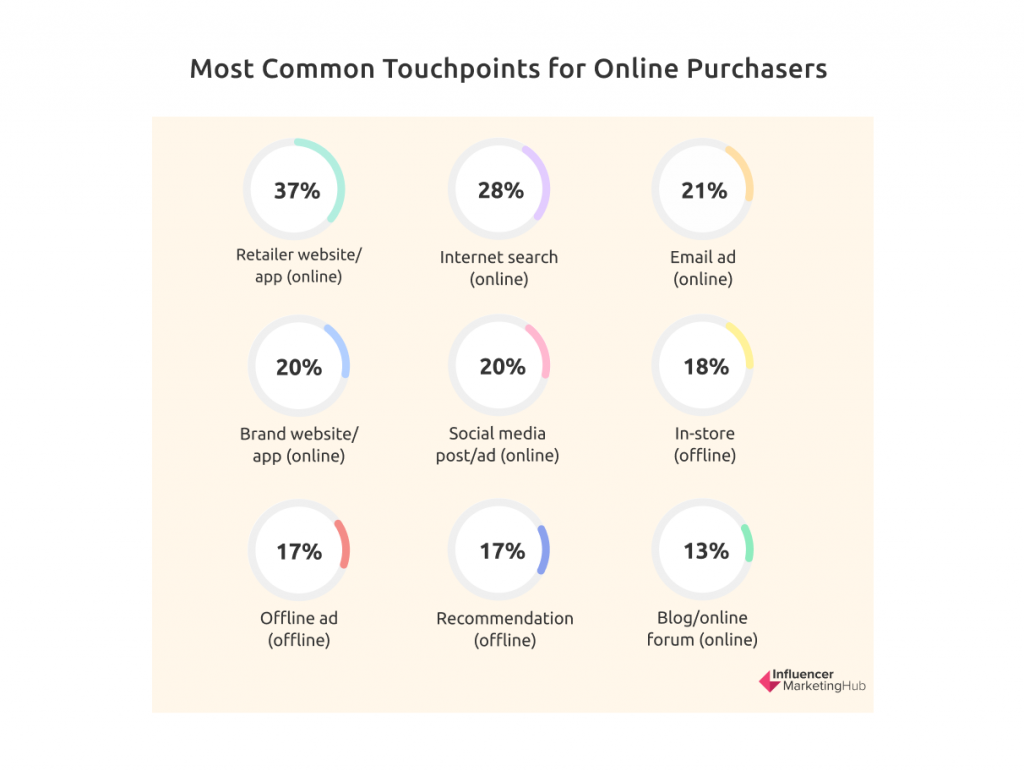
- Retailer website/app (online) – 37%
- Internet search (online) – 28%
- Email ad (online) – 21%
- Brand website/app (online) – 20%
- Social media post/ad (online) – 20%
- In-store (offline) – 18%
- Offline ad (offline) – 17%
- Recommendation (offline) – 17%
- Blog/online forum (online) – 13%
eCommerce Traffic Source
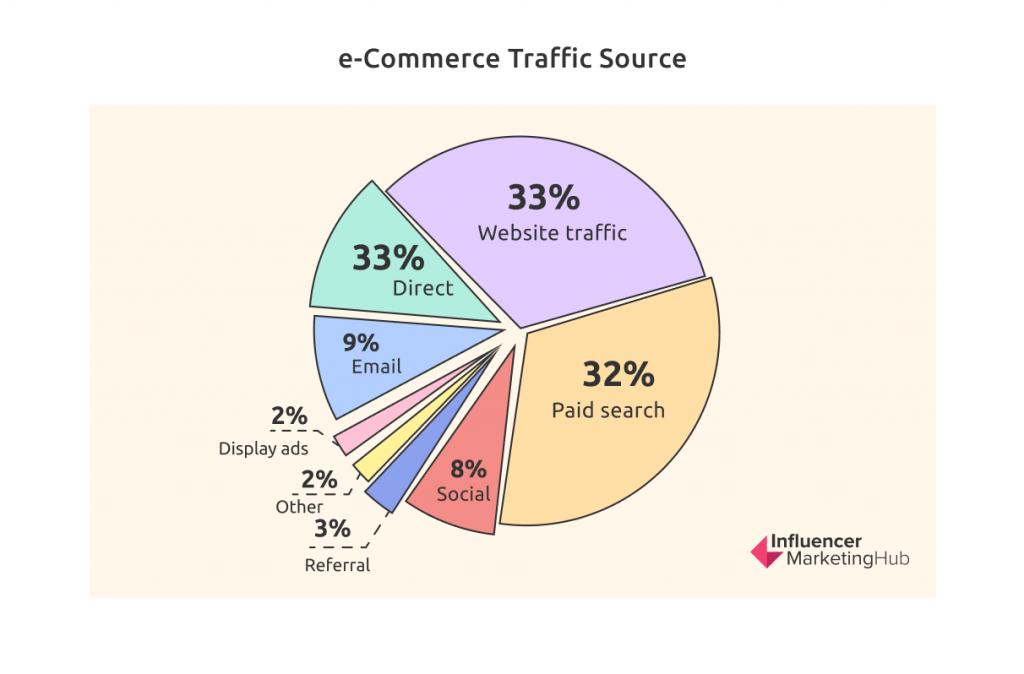
Search Generates 65% of Website Traffic
Most eCommerce firms receive a large percentage of their traffic from a combination of organic and paid searches. Overall, 33% of their website traffic comes from organic search, 32% from paid search, 12% direct (e.g., people typing in the website's URL into their browser), 9% from email, 8% through social, 2% from display ads, 3% from referral, and 2% from other sources.
These percentages vary depending on your industry – it is far harder to gain top organic search rankings in some sectors than others, and there is also greater competition for key paid search terms in certain industries. For example, travel firms gained 54% of their traffic from organic search, but only 19% from paid search. On the other hand, online-only eCommerce retailers saw only 24% of their traffic from organic search, compared to 46% from paid search.
Multi-channel firms gain more traffic from more traditional sources; for example, 13% of traffic came from people directly entering a website URL, and 13% came from email marketing.
Search Generates 67% of Website Revenue
Search also generates about 2/3 of the revenue for eCommerce firms. Overall the figures for organic and paid search are relatively similar, with 33% of revenues coming through organic search and 34% coming from paid search. These numbers indicate how important paid search has become to many firms in recent years, particularly online-only firms that gain 46% of their revenue due to paid search.
eCommerce Conversion Rates
Conversion Rate by Region
Conversion Rate in Great Britain Double That of EMEA Countries
According to KIBO, EMEA and GB experienced an increase in conversion rate YoY between Q2 2020 and Q2 2021, while the US experienced a decrease. In Q2 2021, the conversion rates were GB (4.4%), US (2.8%), EMEA (2.1%), and Other (1.6%).
Conversion Rate by Channel
Search Brings Highest Conversion Rate for Main Traffic Sources
The conversion rate from all channels stayed relatively flat from Q1 2021 to Q2 2021, following from small falls for most channels throughout 2021. By Q2 2021 the conversion rate for search was 3.0% (down 10% over the year), direct 2.8% (unchanged), email 2.2% (down 6%), and social 1.0% (down 19%).
Conversion Rate by Business Model (Dropshipping, Reselling, etc.)
Private Label Business Model Gives Highest Conversion Rate
Unfortunately, eCommerceFuel hasn't yet updated their 2019 eCommerce Trends Report, so we can't compare these statistics with post-Covid data. At the time of their 2019 report (released May 2020), the average conversion rate was 3.02%. However, there were some evident variations by business model.
Private label averaged 3.98%, manufacturing 3.15%, hybrid 2.69%, reselling 2.45%, and dropshipping 2.33%.
Conversion Rate by Industry
Growcode has collated information from 12 studies, most of which were published over the last four years. Their most recent update was in January 2021. They observe how conversion rates vary considerably across verticals.
Arts & Crafts has the Highest eCommerce Conversion Rate
Growcode discovered that the Arts and Crafts industry has the highest eCommerce conversion rate at 3.79%. This was followed by:
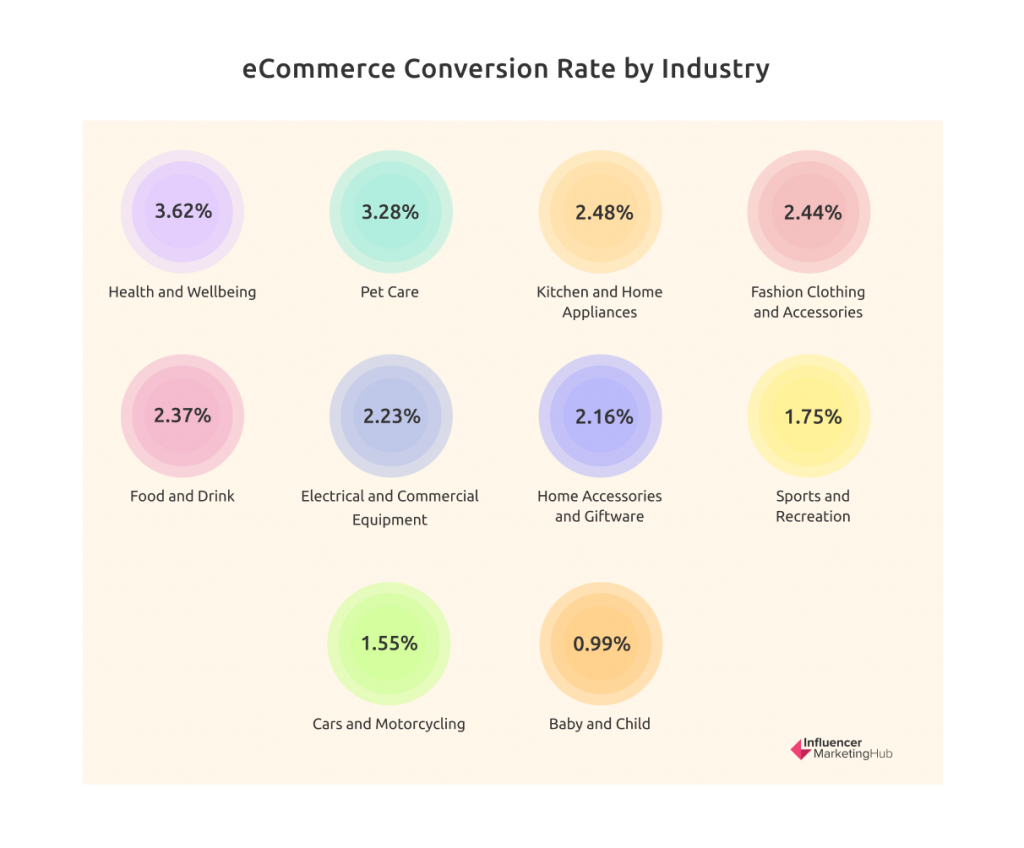
- Health and Wellbeing (3.62%)
- Pet Care (3.28%)
- Kitchen and Home Appliances (2.48%)
- Fashion Clothing and Accessories (2.44%)
- Food and Drink (2.37%)
- Electrical and Commercial Equipment (2.23%)
- Home Accessories and Giftware (2.16%)
- Sports and Recreation (1.75%)
- Cars and Motorcycling (1.55%)
- Baby and Child (0.99%)
Conversion Rate by Country
Growcode lists conversion rates for a selected range of major countries. As they sourced the data from eCommerce Europe, the countries selected are predominantly European.
Germany Has the Highest eCommerce Conversion Rate
Germany leads with an average conversion rate of 2.22%, while Italy lags behind at 0.99%. The conversion rates for the countries reported by Growcode are:
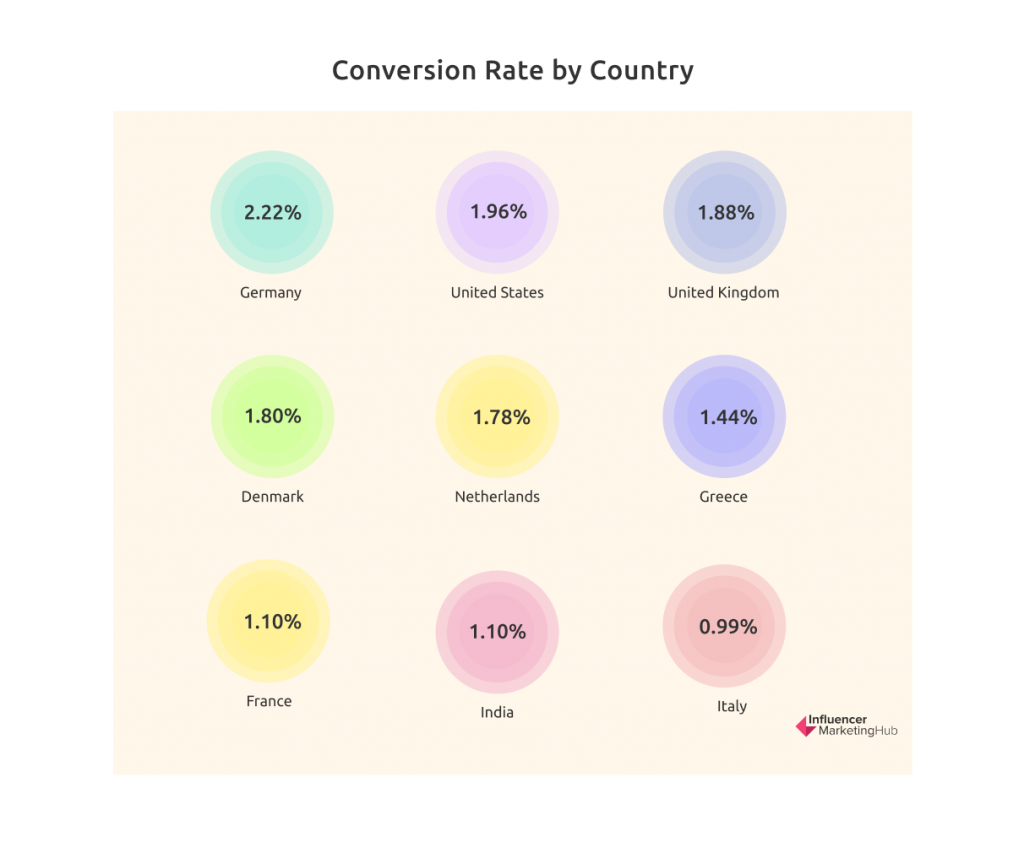
- Germany (2.22%)
- United States (1.96%)
- United Kingdom (1.88%)
- Denmark (1.80%)
- Netherlands (1.78%)
- Greece (1.44%)
- France (1.10%)
- India (1.10%)
- Italy (0.99%)
Cart Abandonment Rate
Cart Abandonment Rate High, But Steady to Falling Depending on Location
KIBO looked at the abandoned cart rate by region. The highest abandoned cart rate in Q2 2021 (82.1%) was in the regions they called Other, a drop of 3% in a year. This was followed by EMEA (81.7%, -3%), USA (75.5%, no change), and GB (75.4%, -4%).
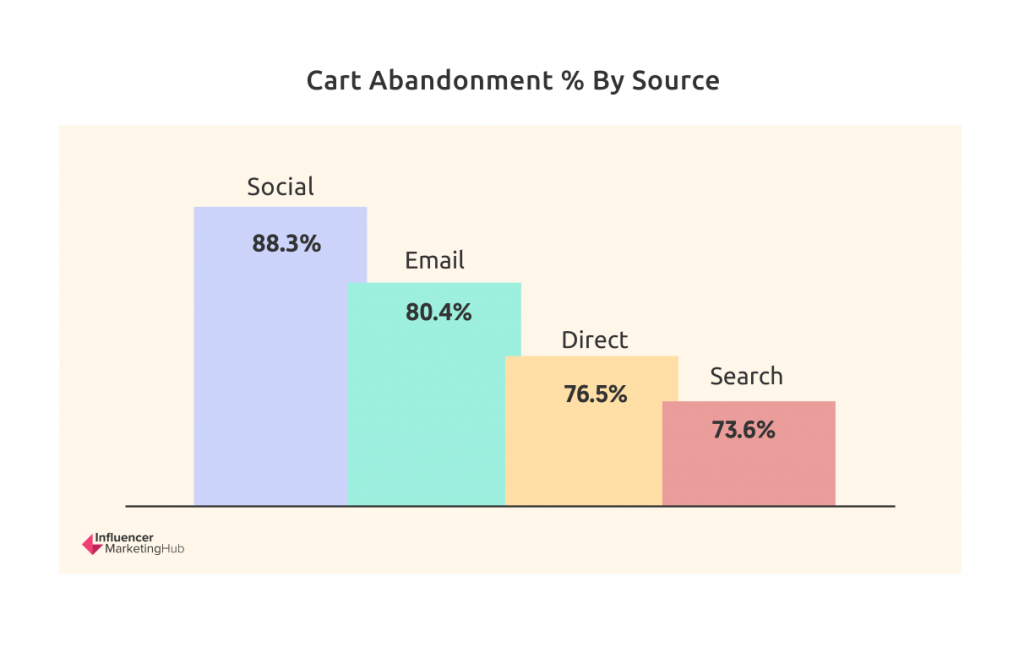
Social Traffic Led to Highest Cart Abandonment, Search Least
All traffic sources saw minor falls in the abandoned cart rate between Q2 2020 and Q2 2021. For example, Social ended that period with an abandoned cart rate of 88.3%, followed by Email (80.4%), Direct (76.5%), and Search (73.6%).
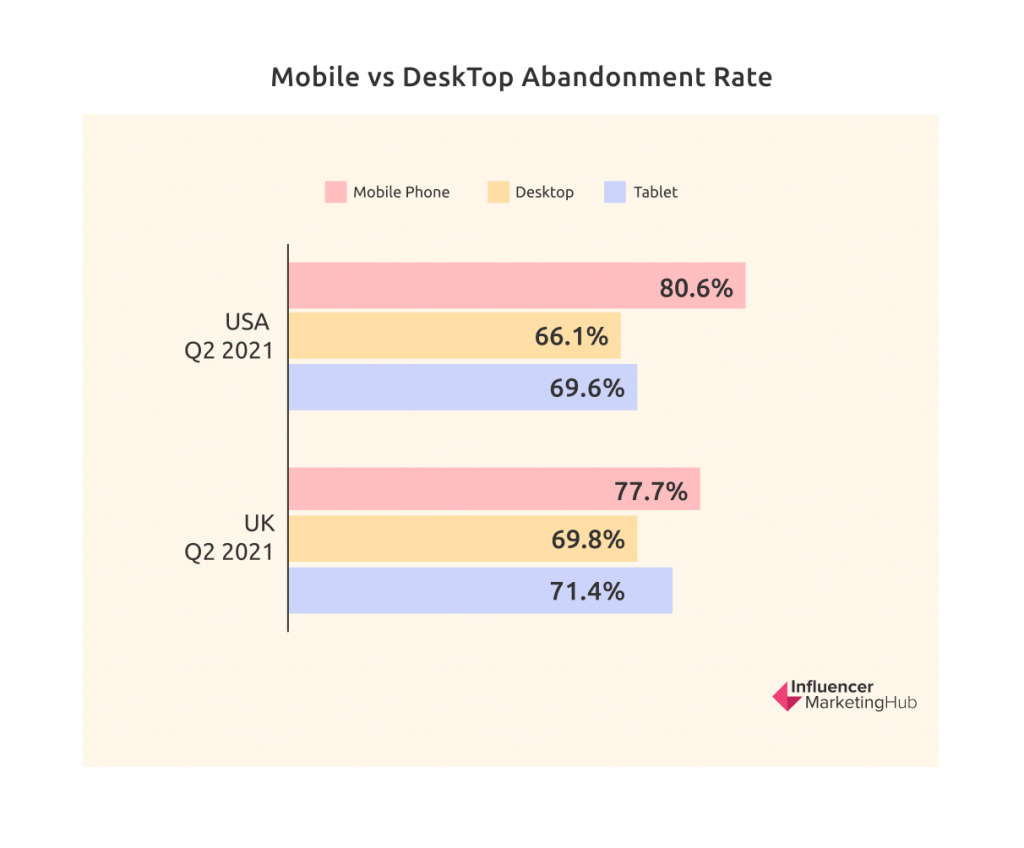
Substantially Higher Cart Abandonment by People Using Mobile Phones
One obvious statistic from KIBO's study was that mobile phone users everywhere are much more likely to abandon their carts than users of desktops or tablets.
For example, in the USA, in Q2 2021, the abandonment rate for mobile phones was 80.6% compared to 66.1% for desktop and 69.6% for tablets. On the other hand, although less clear-cut, a similar trend applied in Great Britain: mobile phone (77.7%), tablet (71.4%), desktop (69.8%).
Google Ads
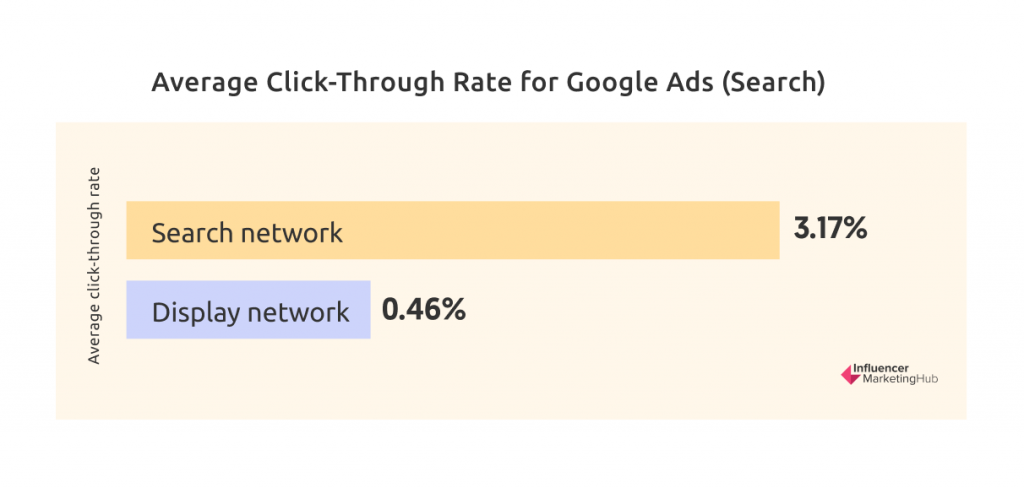
Average Click-Through Rate (CTR) for Google Ads (Search) is 3.17%
The average click-through rate (CTR) in Google Ads across all industries is 3.17% on the Search network and 0.46% on the Display network, according to data collected by Wordstream.
The vertical with the highest CTR on the Search network is Dating & Personals (6.05%), probably due to the success of emotional copy. On the other hand, real estate ads perform best on the Display network (1.08%). However, lovers of technology must be more cynical about advertising, with the Technology sector having the lowest CTR for both Google Ad Networks: 2.09% Search and 0.39% Display.
Average Cost Per Click (CPC) for Google Ads (Search) is $2.69
The average cost per click (CPC) in Google Ads across all industries is $2.69 on the Search network and $0.63 on the Display network.
The vertical with the highest CPC on the Search network is Legal ($6.75), with terms like "Lawyer" and "Attorney" being amongst the most expensive keywords on Google. Consumer services aren't too far behind, with a CPC of $6.40. Dating & Personals ads have the highest CPCs on the Display network ($1.49). eCommerce phrases have the lowest CTR for Google Search ($1.16). Their $0.45 CTR on the Display network is narrowly higher than the $0.44 CTR for the travel & hospitality sector.
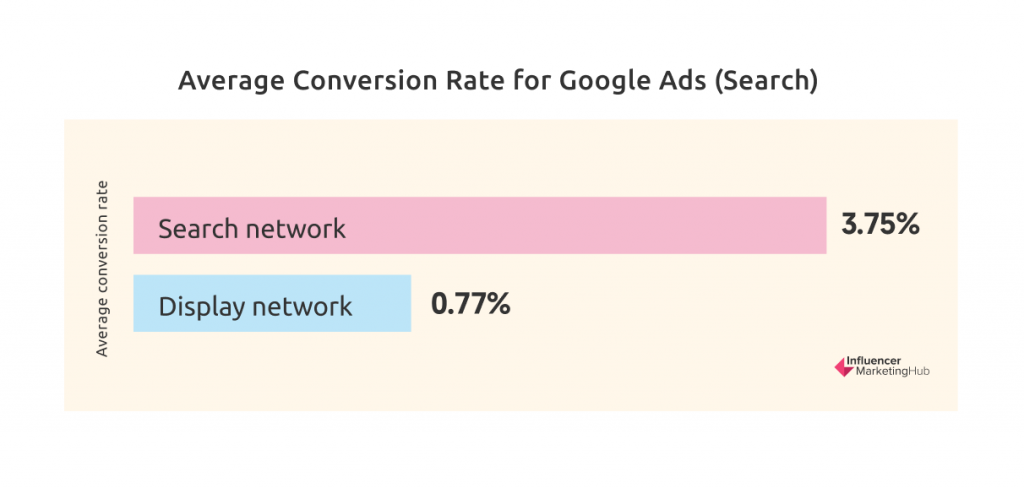
Average Conversion Rate (ACR) for Google Ads (Search) is 3.75%
The average conversion rate in Google Ads across all industries is 3.75% on the Search network and 0.77% on the Display network.
The vertical with the highest ACR on the Search network is Dating & Personals (9.64). Dating & Personals ads also have the highest ACRs on the Display network (3.34%). Advocacy terms have the lowest ACR for Google Search (1.96%). However, their 1.00% ACR on the Display network is considerably better than the 0.43% for home goods.
eCommerce Firms have Comparatively Low Average Click-Through Rates, Average Cost Per Click, and Average Conversion Rates
If you separate eCommerce as a sector, you can see that it has relatively low Google Ads stats compared to the other verticals collected by Wordstream. eCommerce businesses have an average click-through rate (CTR) of 2.69% on the Google Search network and 0.51% on the Display network (compared to averages of 3.17% and 0.46%, respectively). The average cost per click (CPC) for eCommerce businesses is $1.16 on the Search network and $0.45 on the Display network (compared to the overall averages of $2.69 and $0.63). And the average conversion rates for eCommerce businesses work out at 2.81% (Search network) and 0.59% (Display network), compared to 3.75% and 0.77%.
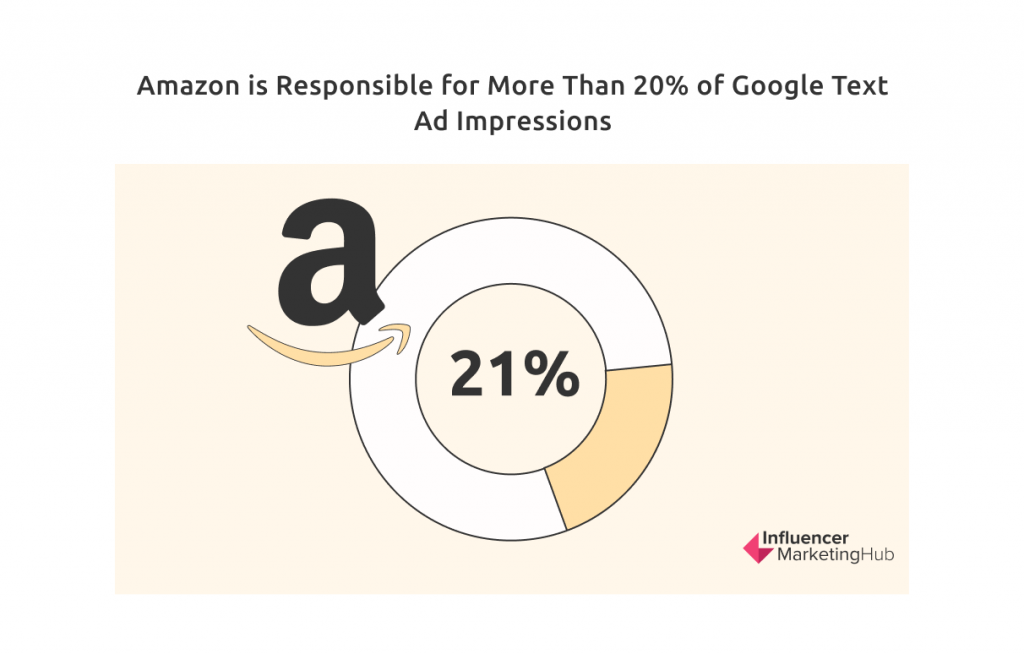
Amazon is Responsible for More Than 20% of Google Text Ad Impressions
Amazon's text ad impression share on Google was 21% in June 2021. Amazon's share of Google text ads has remained relatively static throughout 2021, although many consider Walmart and Target more aggressive than Amazon in the search space.
Amazon was Responsible for More Than 60% of Google Shopping Ad Impressions Around Google Prime Day
Amazon is even more dominant when it comes to Google Shopping ad impressions. It has exceeded 40% of all Google Shopping impressions every week during 2021, peaking at 62% in June in the run-up to their Prime Day sale.
Google Shopping
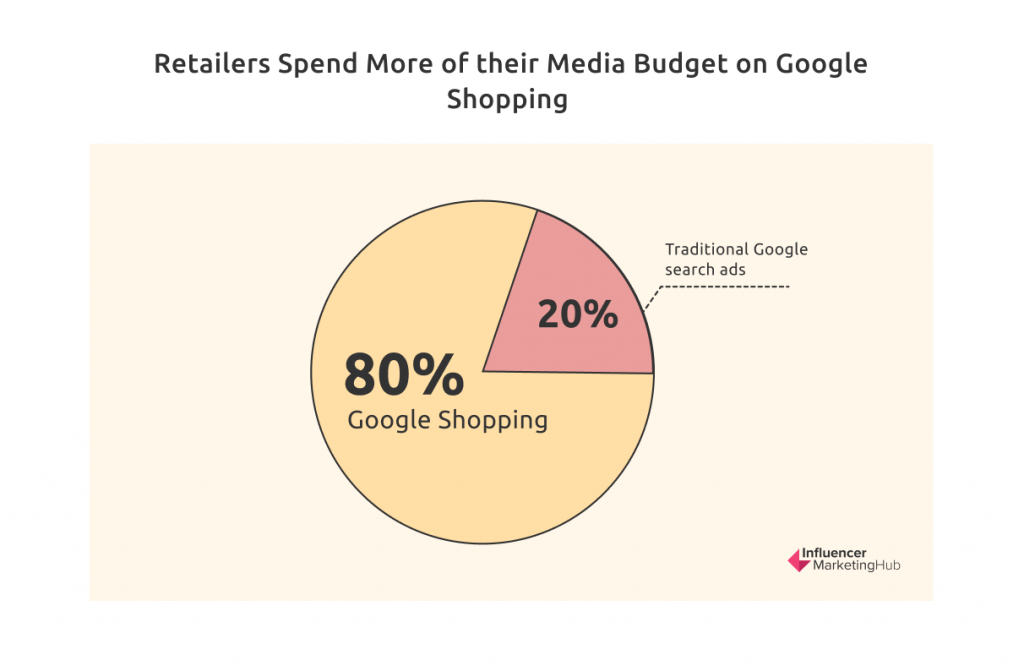
Brands Now Spend Considerably More on Google Shopping Than Other Types of Google Ads
With Google Shopping, consumers can search for, view, and compare products. Google Shopping ads are those strips of similar-type products you often see in a Google search. Retailers can advertise their products to searchers in a visually appealing way, although they will appear beside competitors' products. If a user clicks on your ad, Google takes them directly to your product page. Critically, Google Shopping Ads now appear at the top of a search engine results page, above both traditional search ads and organic results.
Retailers have come to recognize the importance of having their products included in Google Shopping comparison lists. Therefore, they now allocate 80% of their Google media budget to Google Shopping and only 20% to more traditional Google search ads.
Advertisers Spend an Average of $770.41 per month on Google Shopping
The average monthly budget for Google Shopping Ads is $770.41. This amount varies considerably by vertical, ranging from $1,815 for health & beauty firms and $1,472 for computers & technology businesses, down to $273 for travel & luggage brands and $296 for educational supplies.
Interestingly, although the average monthly budget for Bing Shopping Ads is lower at $392.53 (probably reflecting Bing's lower reach), there is a notable exception for firms who sell office & business needs. While they average $836 per month on Google, they spend $2,273 on average on Bing Shopping Ads.
Average Click-Through Rate (CTR) for Google Shopping is 0.86%
The average click-through rate (CTR) for Google Shopping across all industries is 0.86%.
The vertical with the highest CTR on the Search network is Automotive Supplies (1.20%). However, as with other forms of Google Ads, the technology sector has the lowest CTR for Google Shopping at 0.55%.
Average Cost Per Click (CPC) for Google Shopping is $0.66
The average cost per click (CPC) in Google Shopping across all industries is $0.66.
The vertical with the highest CPC is Office & Business Needs ($1.09). Arts and music products have the lowest CTR for Google Shopping ($0.34), closely followed by child & infant care (0.36%).
Average Conversion Rate (ACR) for Google Shopping is 1.91%
The average conversion rate in Google Shopping across all industries is 1.91%.
The vertical with the highest ACR on Google Shopping is HVAC & climate control (3.30%). Chemical & industrial ads have the lowest ACRs on Google Shopping (0.83%).
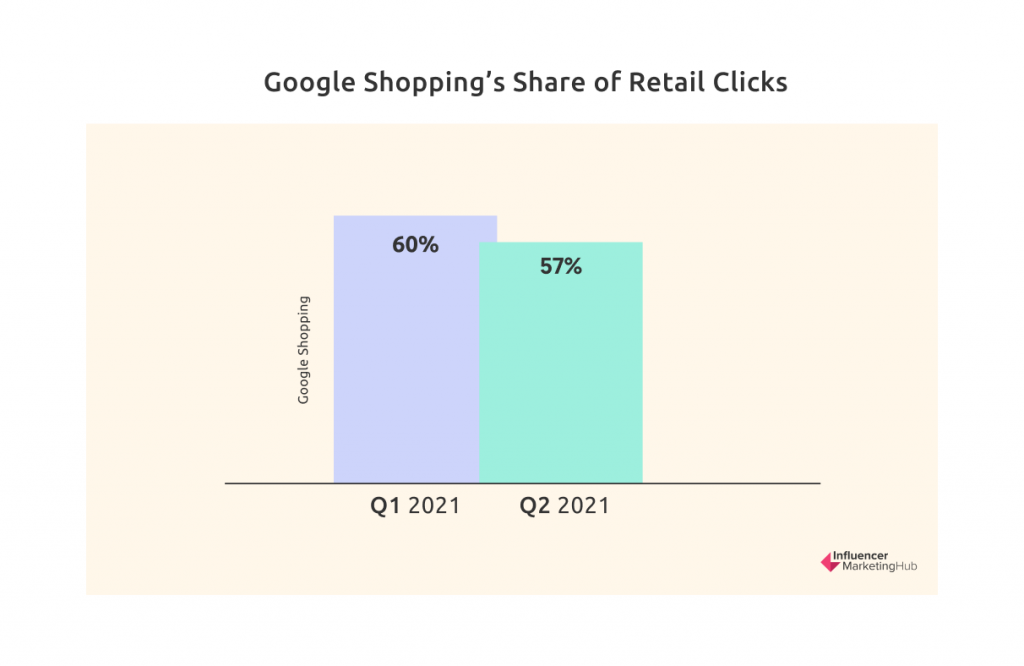
Google Shopping Now Takes 57% of Google Paid Search Clicks
Merkel reports that Google Shopping's Share of Retail Clicks in Q2 2021 was 57% of all Google paid search clicks. This was a slight fall from 60% in Q1 2021.
Spending on Google Shopping ads grew 15% year-on-year to Q2 2021, while text ads saw a significant drop in clicks, down 21%.
Annual eCommerce Growth Rate
Retail eCommerce Sales Expected to Grow by 14% in 2021
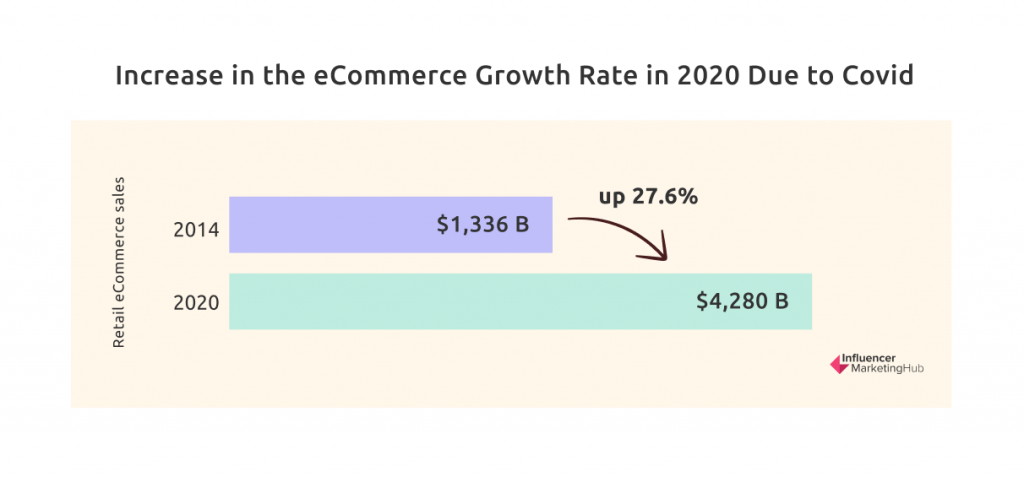
Statista has collected data relating to retail eCommerce sales worldwide between 2014 and 2020, with forward projections covering 2021 to 2024. Back in 2014, there were $1,336 billion of retail eCommerce sales. Since then, this has risen every year, with a notable jump in 2020, Covid's first year, to $4,280 billion, up 27.6%. Numbers are expected to increase at a more typical 14% in 2021, followed by 10.9% in 2022, 8.9% in 2023, and 8.1% in 2024.
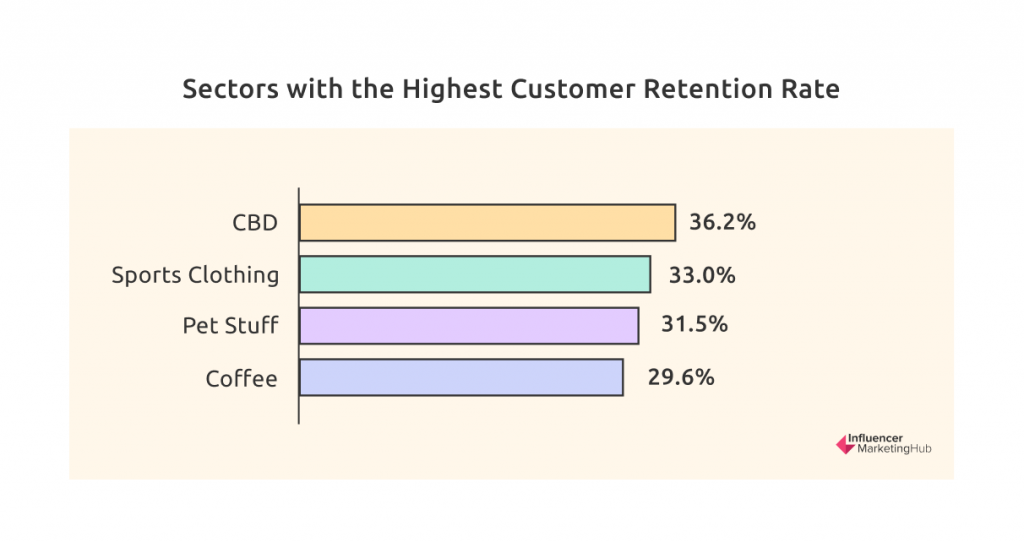
Customer Retention by Vertical
The average Retention Rate is 28.2%
Metrilo has analyzed the customer retention rate, i.e., the share of customers who shop more than once from an eCommerce website compared to the total number of customers. From a sample of 65 businesses, they found that the average retention rate was 28.2%, i.e., on average, 28% of customers place more than one order with a particular shop.
CBD (Cannabidiol) Has Highest Retention Rates
Of all sectors, (legal) CBD has the highest retention rate of 36.2%. Clearly, users of cannabis-related products like to come back for more. Other sectors with high retention rates are high-performance sports clothing (33.0%), pet stuff (31.5%), and coffee (29.6%).
Average Retention in the Apparel Sector is 26%
The first order is significant for online apparel retailers. If the first batch of clothes doesn't fit, few customers are likely to make a repeat purchase. As a result, the sector's retention rate at 28.0% is a couple of percentage points lower than the average retention rate overall. However, their average revenue from returning customers is 59.1%, indicating that once a new customer of an online apparel store feels satisfied by the store's service, they are likely to make repeat purchases.
eCommerce Margins by Business Model
Average Gross Margin is 45%
Although the average gross margin for eCommerce businesses is 45%, this varies considerably depending on your business model. For example, manufacturers charge the highest gross margin of 53%, followed by Private Label (45%), Hybrid (45%), Reselling (36%), and Dropshipping (32%).
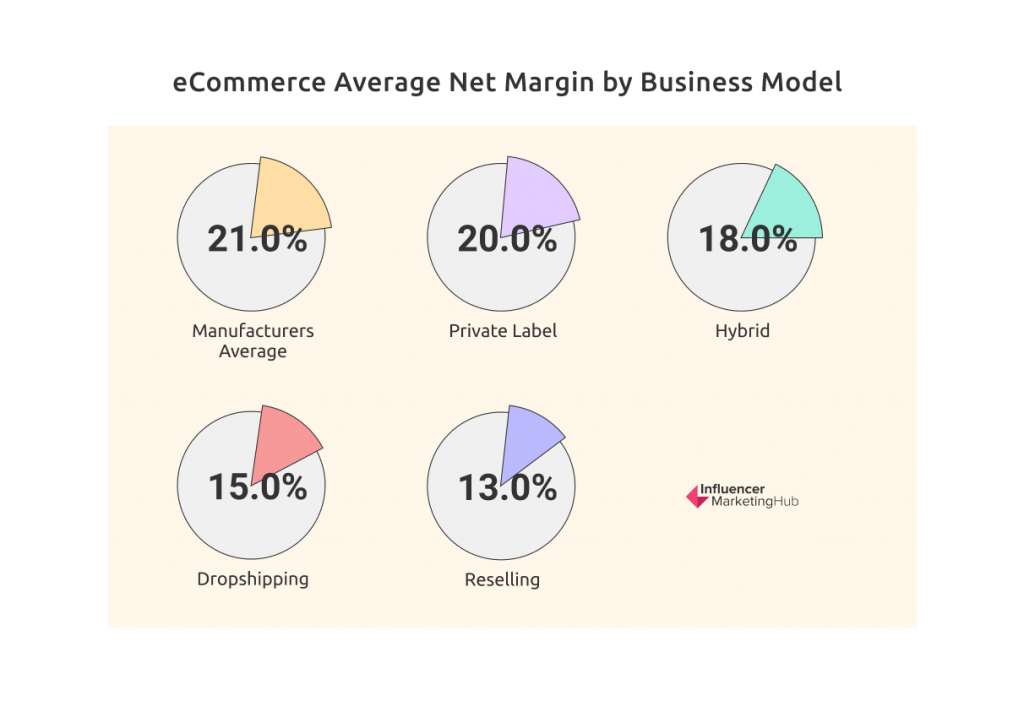
Average Net Margin is 18.2%
A similar trend to the above follows through to the net margin, although dropshippers manage to charge a higher net margin than their reseller counterparts. Manufacturers average a 21% net margin, followed by Private Label (20%), Hybrid (18%), Dropshipping (15%), and Reselling (13%).
The pattern in Average Gross and Net Margin by business model shouldn't surprise anybody. Dropshippers tend to be the smallest eCommerce businesses and manufacturers the largest. Large firms can take advantage of economies of scale and increased efficiencies, reducing their margins compared to smaller firms.
Margins Smaller for Firms Selling Primarily on Amazon
Although the differences aren't huge, it is nonetheless clear that firms that predominantly sell through their own store manage higher margins than those that focus their sales through Amazon. Sellers primarily selling on Amazon average a Gross Margin of 42.3% and a Net Margin of 17.5%. In comparison, sellers who mainly use their own store for online sales average a 46.0% Gross Margin and an 18.4% Net Margin.
Average Page Views Per Consumer
Average Page Views Falling
KIBO found that average page views fell worldwide over 2020-2021. In Great Britain, average page views dropped 18%, from 11.7 in Q2 2020 to 9.6 in Q2 2021. The fall was less significant (14%) in the USA, based on smaller numbers, however: 7.3 Q2 2020 to 6.3 Q2 2021. KIBO believes that Great Britain has a higher average page views count than the US due to a different composition of industries.
Search Results in the Most Page Views, Social the Least
There is a clear pattern when you look at the average page views (globally) based on traffic sources. Although average page views dropped over the 2020-2021 year, there was a consistent order of page views by source each quarter: Search – Email – Direct – Social. The figures in Q2 2021 were Search (9.3, down 12% in a year), Email (7.8, -10%), Direct (7, -17%), and Social (4.6, -27%).
Mobile vs. Desktop Purchases
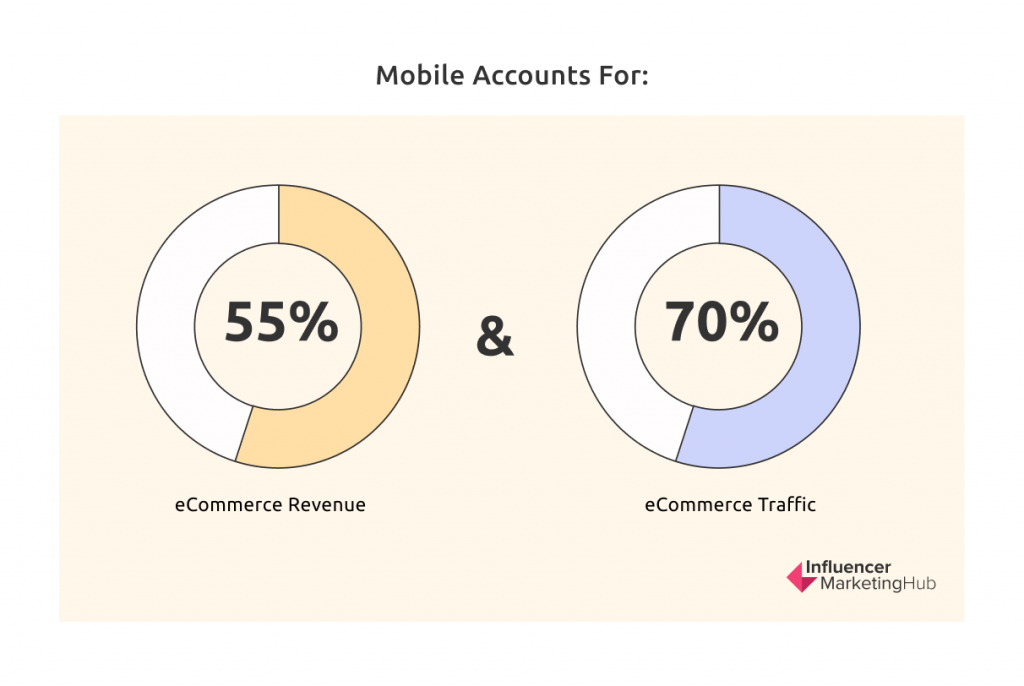
Mobile Accounts for 55% of Revenue
People are increasingly purchasing on their mobile phones, with Wolfgang Digital finding that mobile now accounts for 55% of eCommerce revenue and 70% of traffic. Allowing for the 9% of revenue and 8% of traffic generated on tablets, that just leaves 36% of revenue and 22% of traffic coming from desktop computers.
These figures are even more mobile-centric when looking at online-only retailers. In their case, 69% of revenue and 77% of traffic comes from mobile devices, 7% of both revenue and traffic from tablets, and 24% of revenue / 16% traffic from desktops.
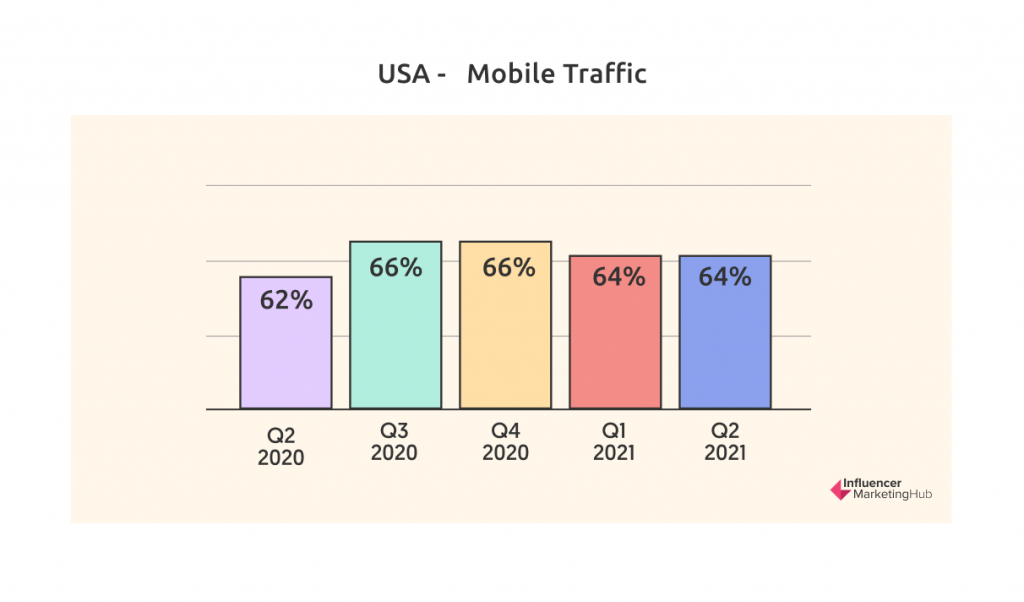
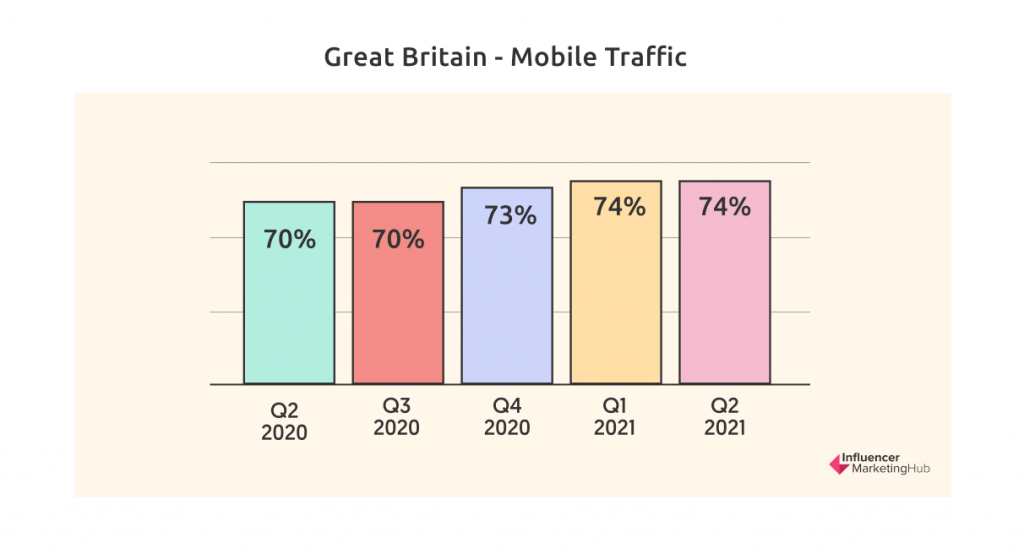
Mobile Has Flattened in the USA But Continued to Rise in Great Britain
More recent data from KIBO shows that mobile has stayed relatively static in the USA as a percentage of total traffic – rising from 62% in Q2 and Q3 2020 to 66% in Q4 2020, but falling back to 64% in Q1 and Q2 2021. However, mobile traffic in Great Britain has continued to increase its overall percentage, from 70% in Q2 and Q3 2020 to 73% in Q4 2020 and Q1 2021, to 76% in Q2 2021.
Multi-Channel Retailers Experience Research Online, Purchase Offline
Multi-channel retailers, who operate in both physical and online environments, see somewhat different proportions in device usage. Many consumers carry out their research at home and then go in-store to make their purchases. As a result, while their traffic statistics are not that different from other eCommerce stores (67% mobile, 9% tablet, 24% desktop), the online revenue percentages have much less of a mobile skew compared to dedicated online retailers (43% mobile, 13% tablet, 45% desktop).
Phone and Tablets Combined Make up 71% of All Paid Search Clicks
According to the Merkle Digital Marketing Report, phones and tablets combined made up 71% of all paid search clicks. Phones increased to 68% of total paid search clicks in Q2 2021, increasing one point over Q1. Tablets continued a decline down to 2.7%, having peaked at about 18% in 2014 (which was almost identical to phone's share at that time).
Phones Account for 71% of Google Search Clicks But Only 24% of Those on Microsoft
Intriguingly, the use of phones to click on search ads is very different between Google Search and Microsoft Bing. In Google's case, phones generated 71% of Google search clicks in Q2 2021, compared to desktop's 27%. On Bing, however, phones only generated 24% of Microsoft Ad clicks, compared to 71% desktop. The remaining clicks in each case represent tablet use.
Consumers Who Research Online and Then Purchase In-Store
Consumers Spent an Additional 168% In-Store as a Result of Their Online Research
Wolfgang analyzed data from Google Ads showing 'research-online purchase-in-store' activity. Because this data has only recently been collected by Google, it is based on a relatively small sample set. However, the results clearly show the value to retailers of people who 'research-online purchase-in-store.'
Google found that people who carried out online research generated an additional 168% revenue in "in-store" transactions over and above their online sales, along with an additional 84% conversions.
The Average Order Value (AOV) of 'Research-Online Purchase-in-Store' Sales is Three Times Higher Than That of Online Sales
Clearly, when it comes to big-ticket items, while many people carry out research online, they still prefer to purchase in-store. Google found that the Average Order Value (AOV) of research-online purchase-in-store sales is 199% greater than the AOV for online-only retailers.
What do Consumers Most Value from Online Retailers?
Free Shipping is the Top Reason Consumers Prefer to Shop Online
Jungle Scout surveyed more than 1,000 US consumers to learn about motivations for shopping online. The respondents' top reasons for shopping online in Q1 2021 were:
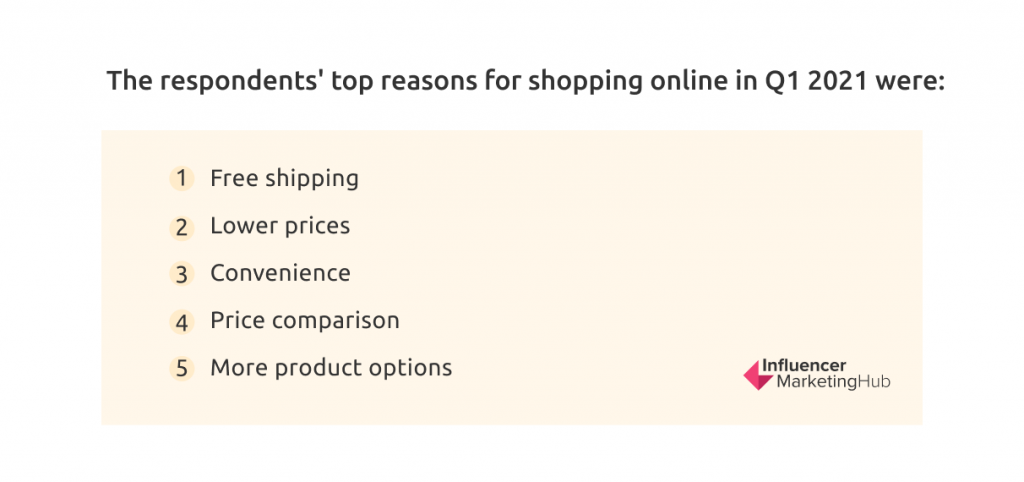
- Free shipping
- Lower prices
- Convenience
- Price comparison
- More product options
Kantar's survey has somewhat different results. They ranked the top reasons for online purchase as being:
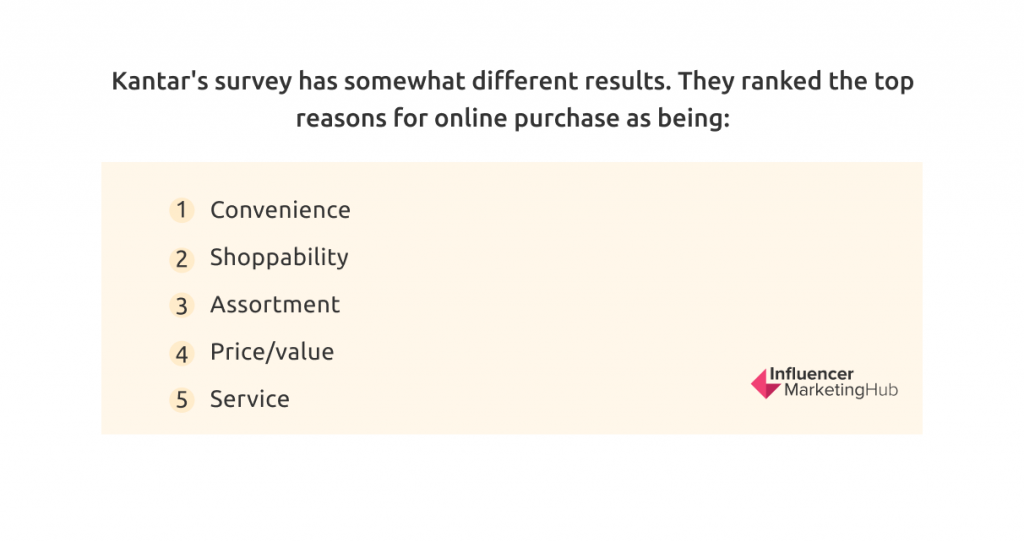
- Convenience
- Shoppability
- Assortment
- Price/value
- Service
Impact of Covid 19 on eCommerce
eCommerce Greatly Benefitted From Covid 19
While many people have suffered the ravages of Covid-19, and many traditional businesses have had to change their entire business model or fail, eCommerce has dramatically benefited from changes forced by the pandemic. Consumers have been forced by necessity to shift their spending from bricks and mortar to online. Indeed, people are now ordering virtually every product online, including some that would have been unimaginable a year or two ago.
eCommerce Grabbed a Greater Share of Retail Sales at the Start of Covid Before Partially Backtracking Later
In Q1 2010, eCommerce made up 4.2% of total US retail sales. This figure gradually rose each quarter, reaching 11.4% in Q1 2020. However, the onset of Covid saw an initial surge of eCommerce sales, with eCommerce's share jumping to 15.7% in Q2 2020.
Since then, countries have opened up in stages, and eCommerce's share has begun to decline again. However, at 13.3%, eCommerce still accounts for a more significant proportion of total retail sales than before the pandemic. In fact, from April to June 2021, retail eCommerce sales in the United States surpassed $222 billion, the highest quarterly revenue in history. In comparison, the value of retail eCommerce sales had totaled $578 billion over the entirety of 2019.
Many Small Local Businesses Quickly Established an eCommerce Presence
An unexpected windfall of Covid 19 is that many small local businesses that had never previously worried about eCommerce had to quickly create an online presence to survive. Thousands of local retailers, shops, and restaurants responded to an urgent need, transferring part of their business online.
B2B Firms Needed to Change Their Operations
B2B firms were just as affected by the effects of Covid as their B2C counterparts. They were forced to change from the typical model of having field representatives traveling from business to business taking orders and displaying new products. In many cases, representatives had to operate from their homes, as did call center operators. As a result, B2B companies had to become more agile in their operations.
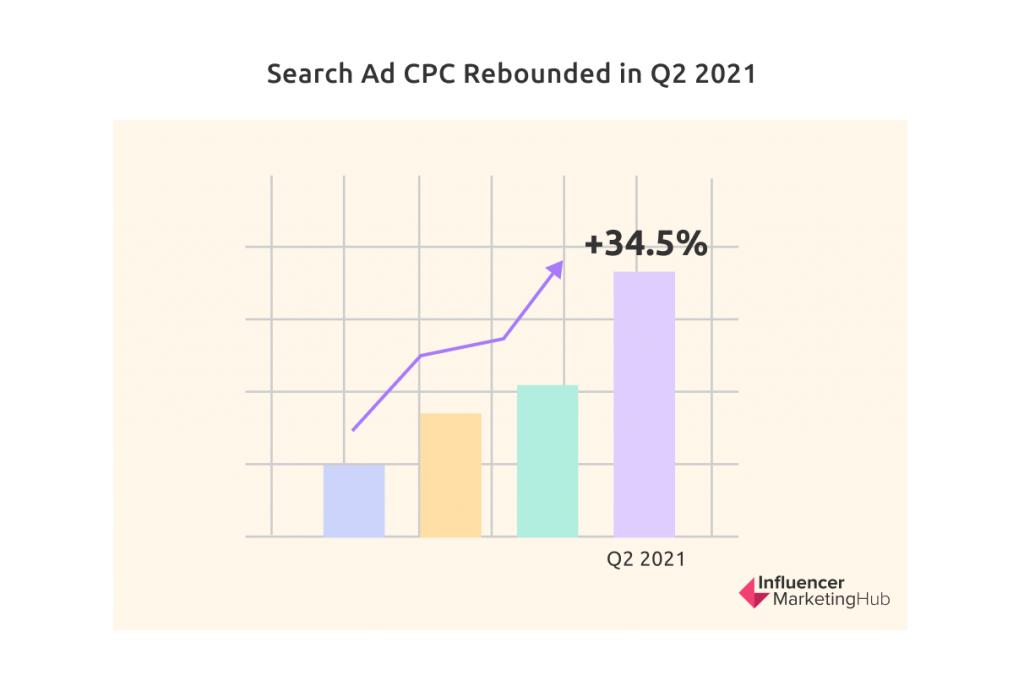
CPC Surged 35% in Year to Q2 2021 Following 20% Fall a Year Previously
Merkle's Digital Marketing report showed much more significant variation in quarterly CPC figures since the arrival of Covid-19. Throughout 2019, the annual % change in Average CPC on Google search ads didn't change much, only about 5%. However, the CPC declined by 21% in the first full quarter within the pandemic in 2020. Microsoft reported a similar pattern with Bing.
However, overall search ad CPC rebounded in Q2 2021, growing by 34.5% year on year, recovering by much more than it had fallen 12 months previously.
Google Ad Clicks Continue to Fall Despite the Increased CPC
Google paid search clicks fell 19% year-on-year to Q2 2021, despite the 34.5% increase in CPC. The overall result was an 8.7% increase in ad spending. Covid is still clearly having a noticeable impact on all retail, including eCommerce.
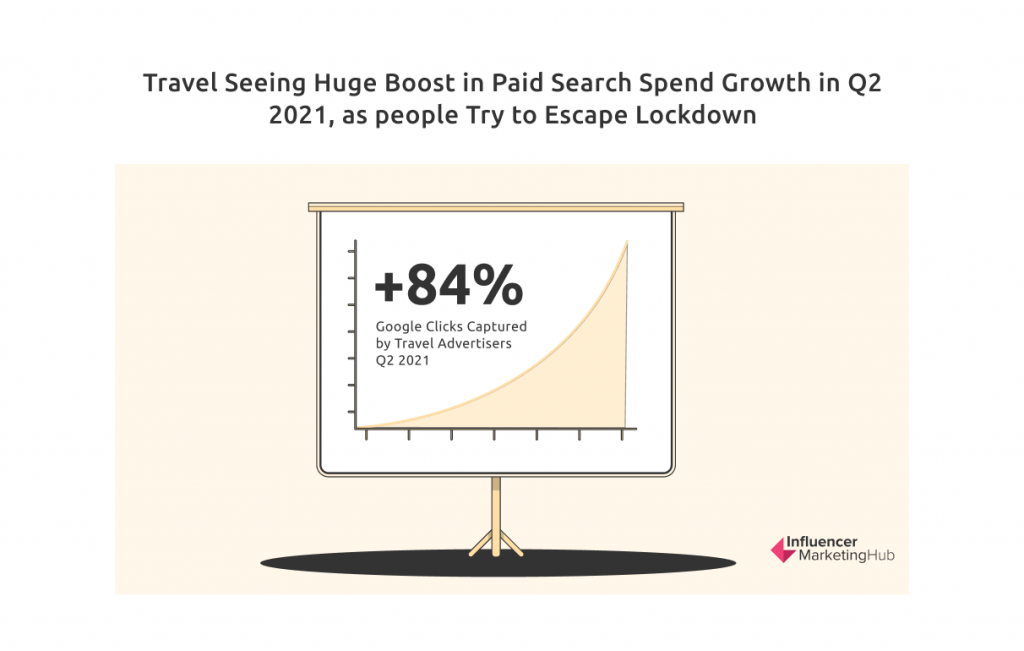
Travel Seeing Huge Boost in Paid Search Spend Growth in Q2 2021, as people Try to Escape Lockdown
With many countries coming back to life after extended lockdowns, we are now seeing a reversal in the trends of 2020. For approximately a year from April 2020, people were forced to do most of their shopping online, so there was a massive increase in retail paid search clicks. However, these statistics have reversed in most sectors a year later. For example, retail paid search clicks were 14% lower in April 2021, 26% in May, and 19% in June.
Some sectors that had suffered during Lockdown have begun to bounce back to life. Google clicks captured by travel advertisers increased by 84% year-on-year in Q2 2021, as consumers looked to get out once restrictions were lifted. Ad spend by the travel sector rose by 85% in the same period.
Travel Sites Experienced a 140% Increase in Visits in the Year Ending Q2 2021
Covid devastated much of the travel sector, with visits to travel websites declining markedly over 2020 and early 2021. However, they have had something of a rebound since then, with a tremendous 140% increase in visits year-on-year during Q2 2021. This is to be expected, a year on, as last year's traffic figures were so low. The most significant amount of year-on-year growth, 263%, occurred in April.
Overall Organic Search Increased in the First Year of Covid, But is Now Falling
Overall organic search increased for four quarters from Q2 2020, at a rate exceeding 30% for each of Q2-4 2020. However, it has dipped again now that we have passed Covid's first anniversary. Total year-on-year organic search visits decreased 9.7% in Q2 2021. Phone traffic fell 0.9% year-on-year, but tablet traffic experienced a larger 29.5% year-on-year decrease.
Facebook Ad Spend Grew 68% in Year to Q2 2021
Facebook Ad spending never fell during the Covid pandemic, but the rate of year-on-year increase dropped to about 5% in Q2 2020, before gradually rising to 18% in Q1 2021. However, Q2 2021 is a watershed point, with a massive 68% increase in year-on-year spending. Increased Facebook advertising has increased competition on the social platform, increasing the CPC in most sectors.
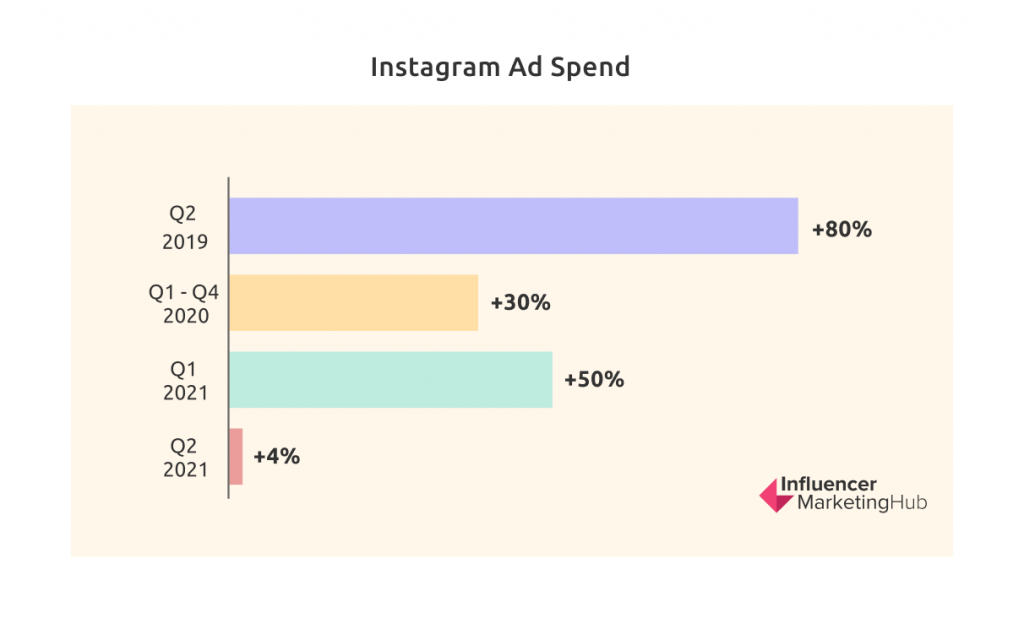
Instagram Yet to See the Same Increase in Ad Spend as its Big Brother
Despite Q2 2021 being a watershed for Facebook ad spending, there is no similar pattern on Instagram. 2019 was a significant year of growth for Instagram spending, with more than 80% growth in the year to Q2 2019. Instagram's ad spend consistently grew at around 30% during 2020, reaching 50% growth by Q1 2021. However, Instagram ad spend dropped dramatically in Q2 2021, meaning year-on-year growth to Q2 2021 was just 4%.
Facebook currently offers placement options via the Dynamic Placement Optimization tool not yet available for Instagram ads. Perhaps advertisers are prioritizing their budget towards Facebook to try out the new features.
Trends for 2022
Travel and High-Tech / B2B Sectors Should Expect Sizable Growth in 2022
As we mentioned above, travel experienced continued growth through Q2 2021. High tech/B2B experienced growth in organic visits too. These patterns will likely continue (albeit at lower rates) into 2022 as world economies reopen.
Voice Search Will Continue to Grow in Popularity
Voice search is rapidly becoming the norm for many eCommerce shoppers, particularly those in the younger generations. Nearly 40% of all internet users in the US and a third of its total population are voice search users. Siri dominates among adult Gen Zers, with 60% of US voice assistant users ages 18 to 24 using the software from Apple. However, Alexa is most popular with older people, with 41% of those ages 65 and older favoring Amazon's product.
Survey results show that online shoppers use voice assistance more extensively in the pre-checkout stages than when making the actual purchase. However, 30% of online shoppers use voice search to track their packages, 20% leave reviews or ratings, and 17% use voice search to repurchase items.
Kantar asked its respondents about their reasons for using voice devices. The main reasons were:
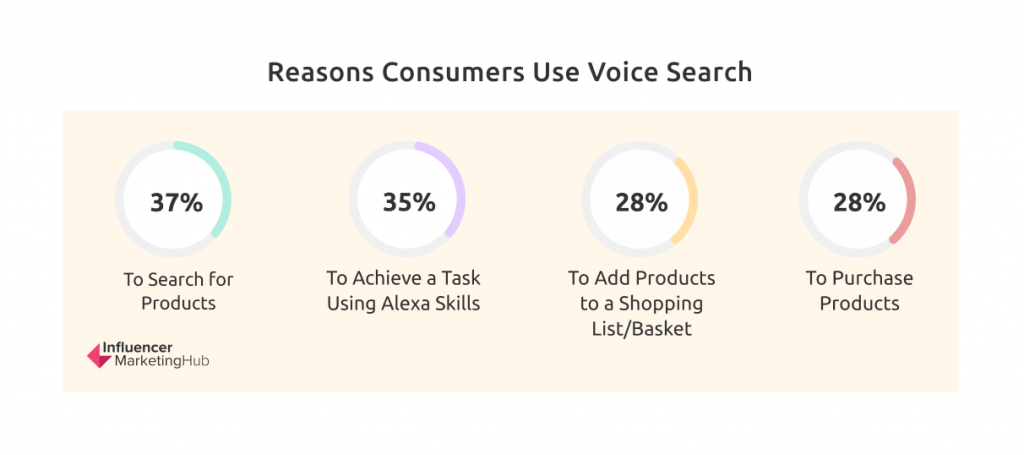
- To search for products (37%)
- To achieve a task using Alexa Skills (35%)
- To add products to a shopping list/basket (28%)
- To purchase products (28%)
Increased Use of Augmented Reality to Visualize Purchases
One of the initial reasons some people were reluctant to participate in eCommerce was that they felt they needed to physically sight products they could potentially buy. However, some firms now offer forms of augmented reality (AR) that enable people to visualize products in their home environment. AR increases user engagement by 66%, conversions by 40%, and reduces returns by 35%. For example, the IKEA Place app uses AR to let furniture shoppers view furniture in their homes, and paint company Dulux lets shoppers see how more than 1,200 paint colors would look on their walls.
Online Purchasers Intend to Make Greater Use of "Last Mile" Delivery Services
The online purchasers surveyed by Kantar have expressed a clear opinion that they intend to increase their use of "last mile" delivery services over the next year. Among those online purchasers who have previously used Instacart, 63% plan to use the service more in the future. Users of many of the other delivery services have expressed similar intentions:
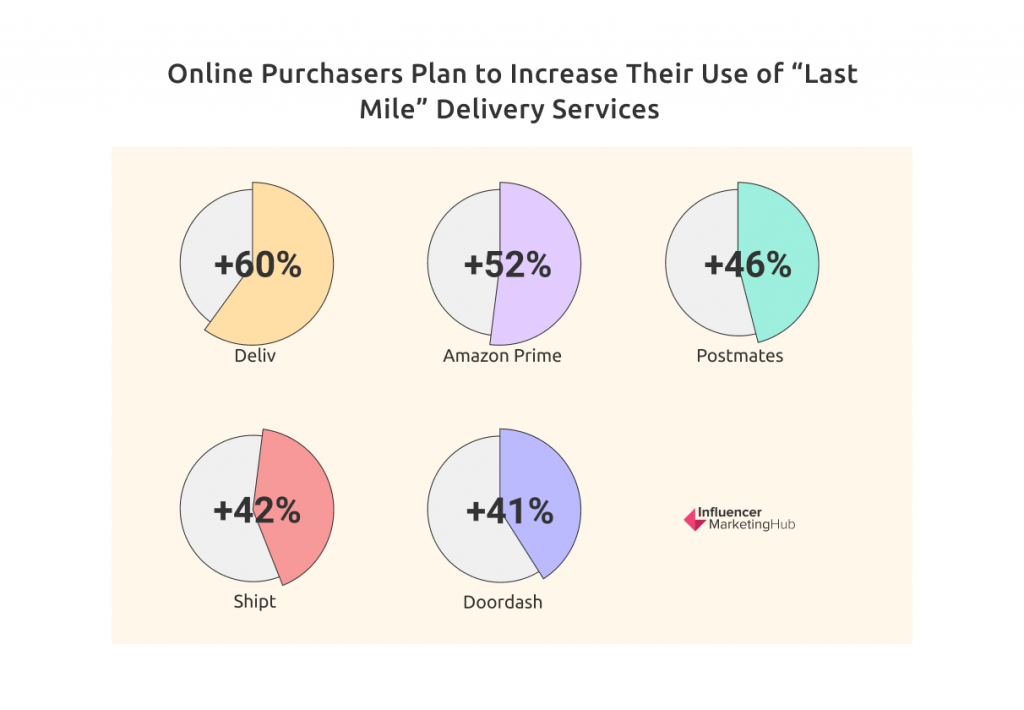
- Deliv (+60%)
- Amazon Prime (+52%)
- Postmates (+46%)
- Shipt (+42%)
- Doordash (+41%)
eCommerce Opportunities
Agency Professionals Consider Performance Tracking, Measurement, Reporting, and Analytics Biggest Opportunity for Partnering With eCommerce Retailers
29% of the agency professionals surveyed by Kantar considered performance tracking, measurement, reporting, and analytics the biggest opportunity for partnering with eCommerce retailers. Other opportunities considered noteworthy included:
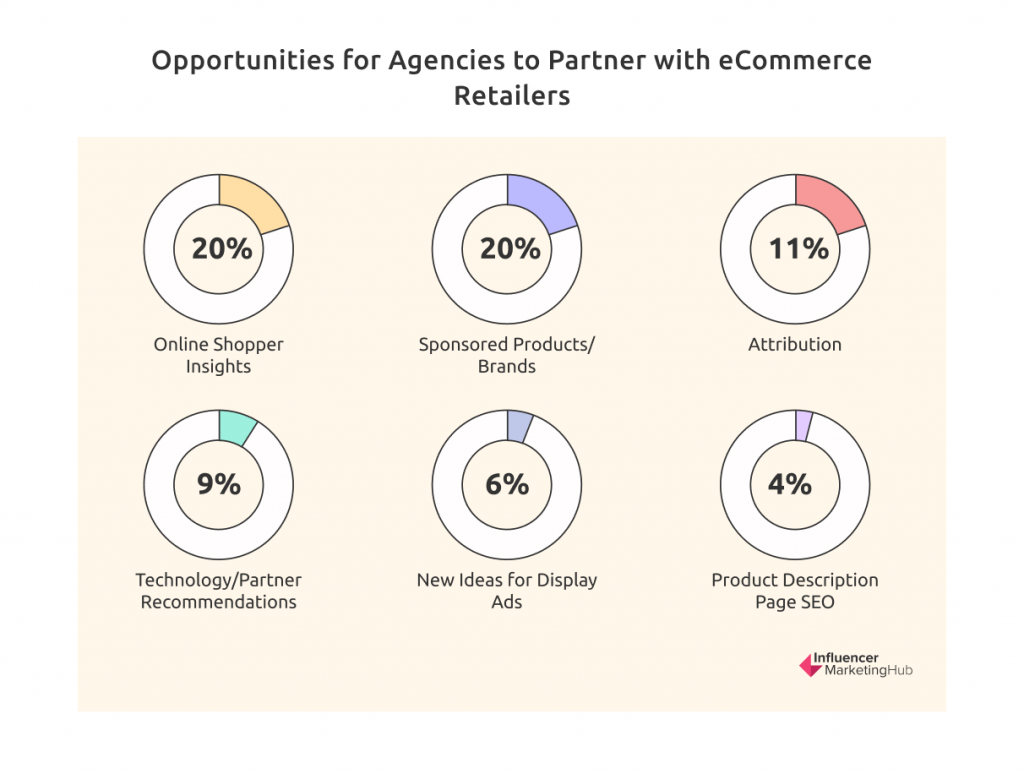
- Online shopper insights (20%)
- Sponsored products/brands (20%)
- Attribution (11%)
- Technology/partner recommendations (9%)
- New ideas for display ads (6%)
- Product description page SEO (4%)
Industry Professionals Consider an Improved User Experience as the Biggest eCommerce Opportunity
40% of industry professionals say that improving the user experience is the biggest opportunity in eCommerce marketing in the next five years.
Other potential eCommerce opportunities that the industry professionals envisaged include:
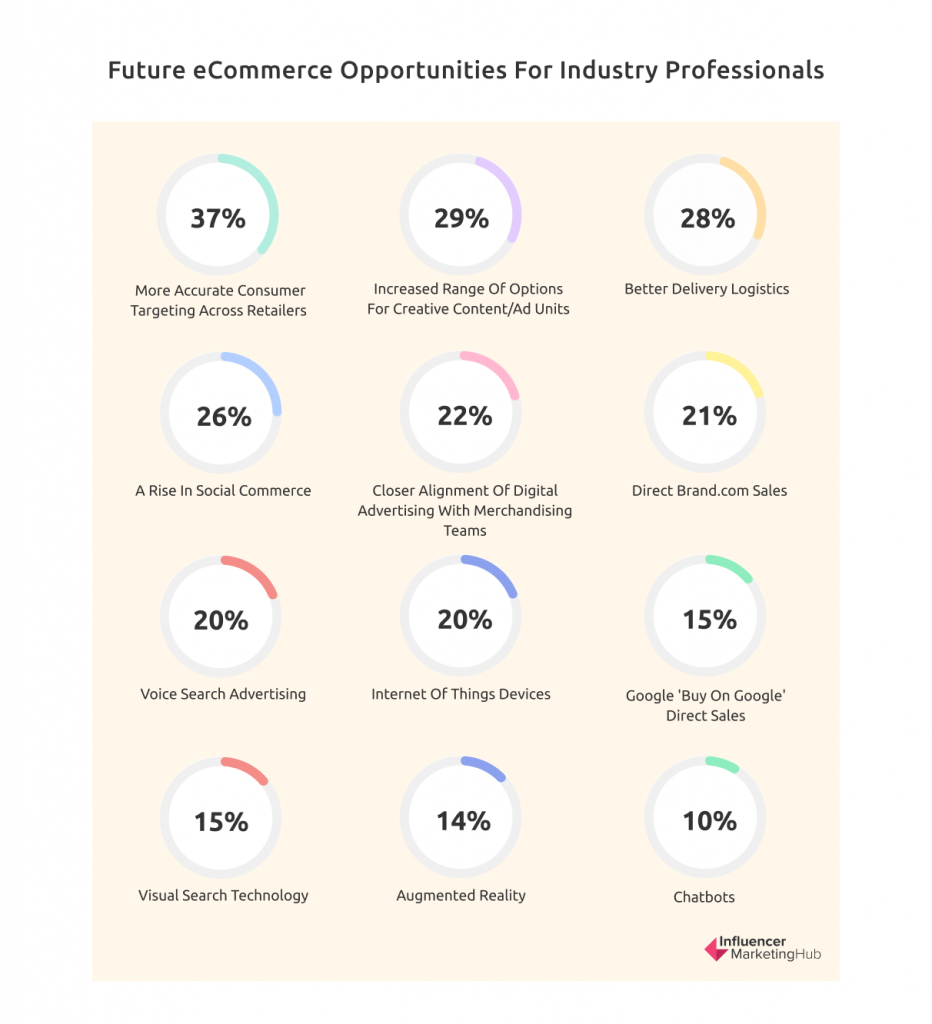
- More accurate consumer targeting across retailers (37%)
- Increased range of options for creative content/ad units (29%)
- Better delivery logistics (28%)
- A rise in social commerce (26%)
- Closer alignment of digital advertising with merchandising teams (22%)
- Direct brand.com sales (21%)
- Voice search advertising (20%)
- Internet of Things devices (20%)
- Google 'Buy on Google' direct sales (15%)
- Visual search technology (15%)
- Augmented reality (14%)
- Chatbots (10%)
European-Only Statistics
eCommerce Europe has released its 2021 European eCommerce Report. The following statistics come from that report. For eCommerce purposes, they split Europe into five regions: Western Europe, Central Europe, Northern Europe, Eastern Europe, and Southern Europe. The report includes data from 37 European countries (the EU-27 and ten neighboring digital economies.) The 2021 figures cover up until May 2021.
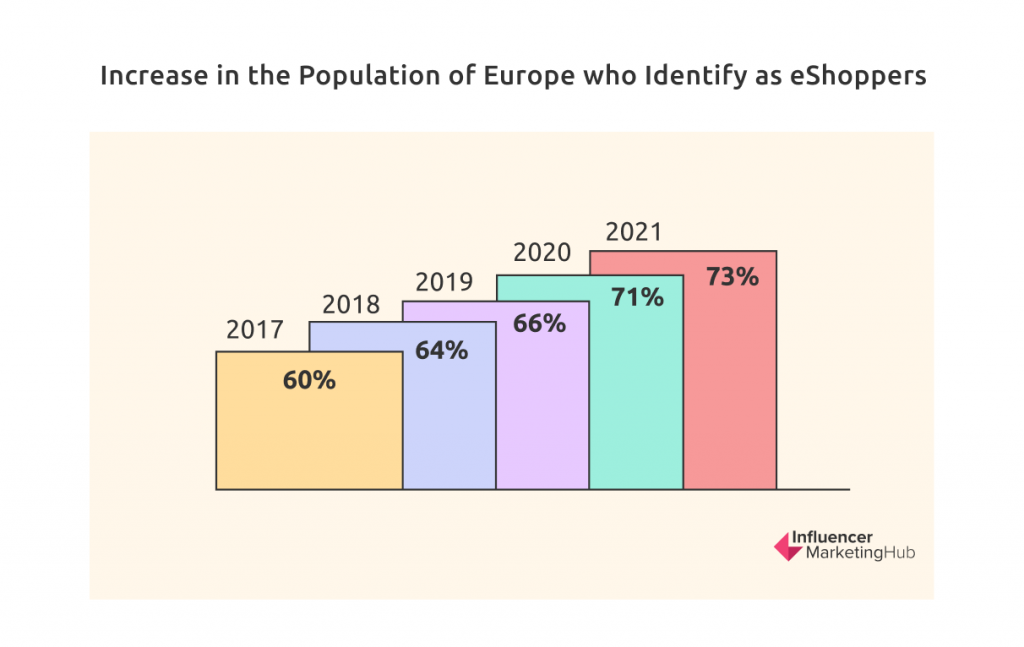
The Percentage of eShoppers in Europe Has Reached 73% in 2021
Throughout Europe, eCommerce use is on the rise, with the number and share of eShoppers increasing every year. Back in 2017, 60% of the European population identified themselves as eShoppers. This increased to 64% in 2018, 66% in 2019, 71% in 2020 and 73% in 2021.
E-GDP Grows Each Year
E-GDP is the share of GDP made up by eCommerce. In 2017 it was 3.11%. This rose to 3.53% in 2018, 3.93% in 2019, 4.29% in 2020, and 4.60% to date in 2021.
Western Europe Has Highest Share of European eCommerce
Western Europe was able to boast by far the highest share of total European eCommerce turnover for 2020 at 64%. Southern Europe came in second (16%), followed by Central Europe (8%) and both Eastern and Northern Europe at 6%.
Northern Europe Has the Highest Penetration of Internet Users, But Western Europe Has More eShoppers
All of Europe has comparatively high internet penetration, led by Northern Europe (96%), followed by Western Europe (95%), Central Europe (88%), Southern Europe (85%), and Eastern Europe (77%).
However, there is more variation in the percentage of each population who admit to being eShoppers. Western Europe led with 86% in 2020, followed by Northern Europe (82%), Central Europe (75%), Southern Europe (60%), and Eastern Europe (41%).
Despite Eastern Europe being less developed for eCommerce than the rest of Europe, it is catching up. Eastern Europe boasted a 36% growth rate in B2C eCommerce turnover in 2020, followed by Central Europe (28%), Southern Europe (24%), Western Europe (4%), and Northern Europe (3%).
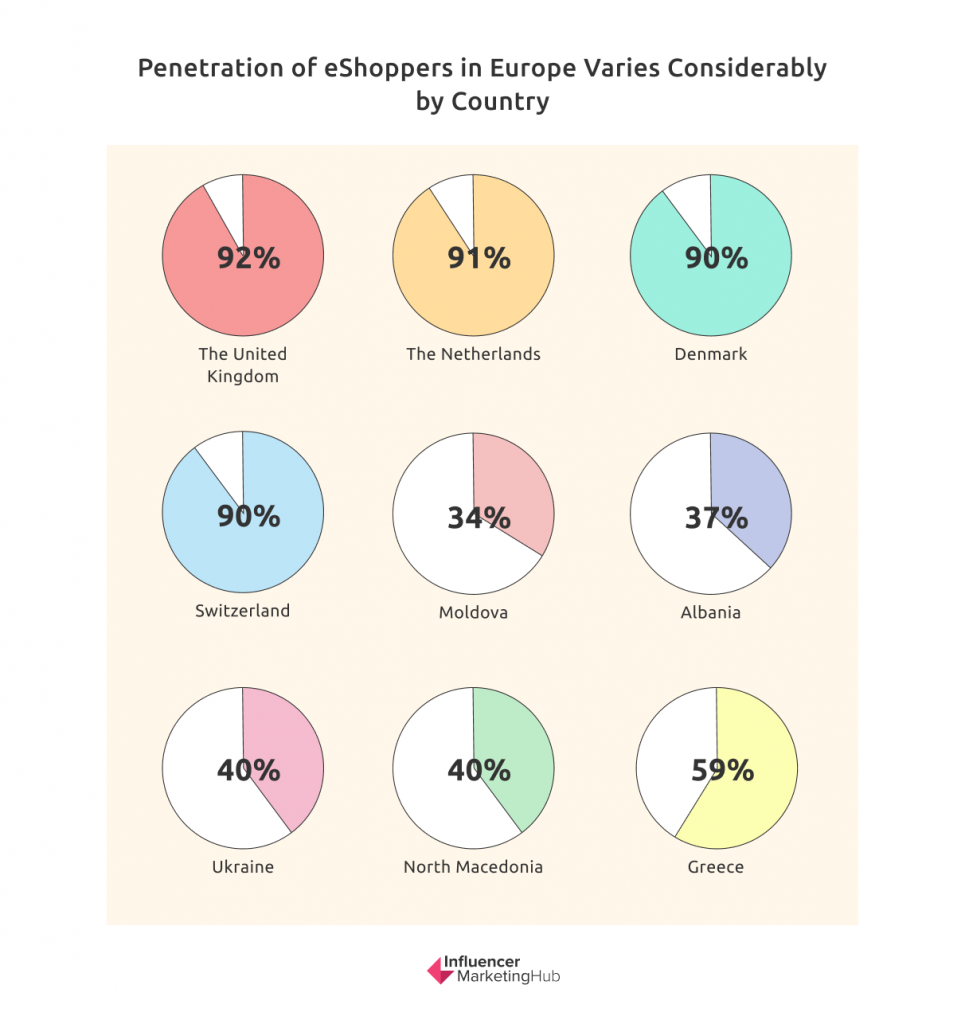
The UK Has the Highest Percentage of eShoppers in Europe
The United Kingdom has the highest eCommerce penetration in Europe, with 92% of its population eShopping. This is followed by the Netherlands (91%), Denmark (90%), and Switzerland (90%).
The country with the least eCommerce is Moldova (34%), followed by Albania (37%), Ukraine (40%), and North Macedonia (40%).
Greece saw the greatest growth in eCommerce in 2020, with a 77% increase, although they still only have 59% of their population using eCommerce overall.
Nearly 10% of UK's GDP Comes From eCommerce
Unsurprisingly the UK can claim that eCommerce contributes most to its GDP (9.92%). Other countries with comparatively high eGDP include Denmark (7.29%), Estonia (6.78%), Greece (6.65%), and the Czech Republic (5.71%).
External Sources
Youwe – The State of E-commerce 2021
Kantar – The State of Ecommerce 2021
Wolfgang Digital – KPI Report 2020
KIBO Q2 2021 Ecommerce Quarterly Benchmarks
IRP Commerce Ecommerce Market Data and Ecommerce Benchmarks
eCommerceFuel eCommerce Trends Report
Merkle Digital Marketing Report