Video may already be an important aspect of your social media strategy, as it should. But are you really getting the most out of your videos? You need to keep track of how your audience is interacting with each video, and use the information to determine tactics for increasing views and engagement.
This is exactly why you need YouTube Analytics. Through YouTube Analytics, you can gain insights about your video viewers, find out who they are, what they like, etc. And based on this information, you’ll understand what type of content you need to create in order to further engage your audience. In other words, YouTube Analytics can help you optimize your video marketing strategy.
This guide will be able to help you understand YouTube Analytics better so that you can enhance your video strategy for social media.
A Guide to YouTube Analytics for Social Media Marketers:
YouTube Analytics Basics
There are two ways to access YouTube Analytics. One way is to go to YouTube.com/analytics. You can also log into your YouTube account, and click on the account icon. After you login, select “Creator Studio” and then “Analytics” on the right.
Under Analytics, you’ll find that there are several categories – Overview, Realtime, Watch Time Reports, Audience Retention, Demographics, etc. Let’s take a look at some of the most important categories so you can use them for your social video strategy.
Overview
The Overview report provides you with a detailed summary of how your video has been performing on YouTube over the past 28 days. You’ll be able to see how different performance metrics such as watch time, average view duration, etc. have been changing within that period. The report also shows your audience demographic data to help you understand how well you’re reaching your target audience.
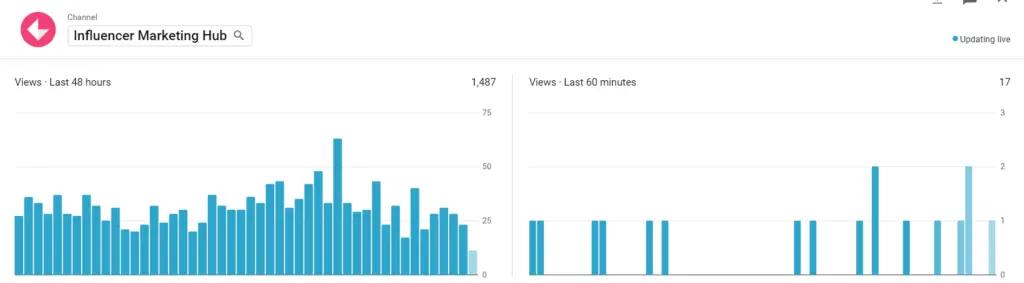
Realtime
With the Realtime report, you can get the estimated view data of your five most recent videos. This can help you understand how your latest content is performing, and whether your current promotion strategy is working. If, for example, a certain video isn’t performing well, you might want to check if there’s any issues with your targeting or your cross-promotion efforts.
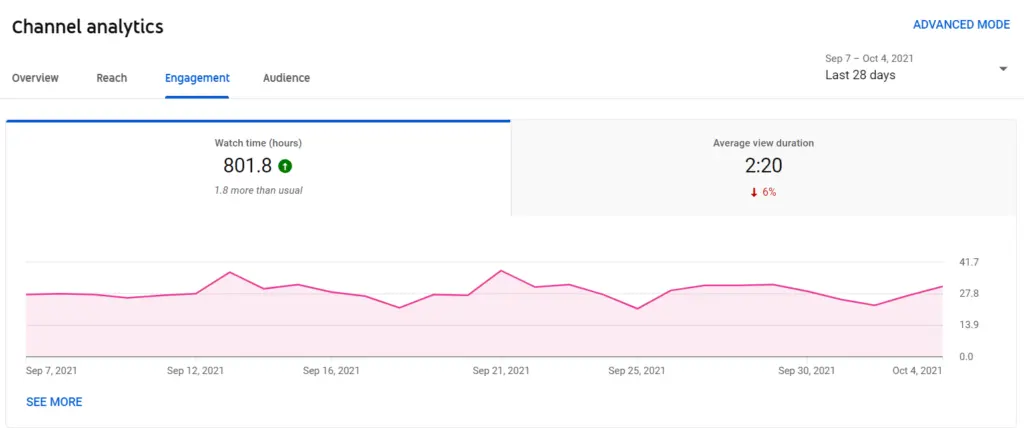
Watch Time Reports
When you create videos, you do so with the intention of getting people to watch them. So it’s only natural that watch time is one of the most important metrics that you’ll be tracking.
But in addition to that, you’ll have to track other metrics that determine how well your videos are engaging your audience. YouTube Analytics provides you with insights such as audience retention, playback location, traffic sources, etc.
Watch Time
The Watch Time report gives you highly accurate insights into how your video is being watched. It collects data from mobile YouTube apps and the embedded player in addition to YouTube.com.
Under this category, you can view several important metrics such as the average view percentage, average view duration, number of unique viewers for a particular video, estimated minutes watched, etc.
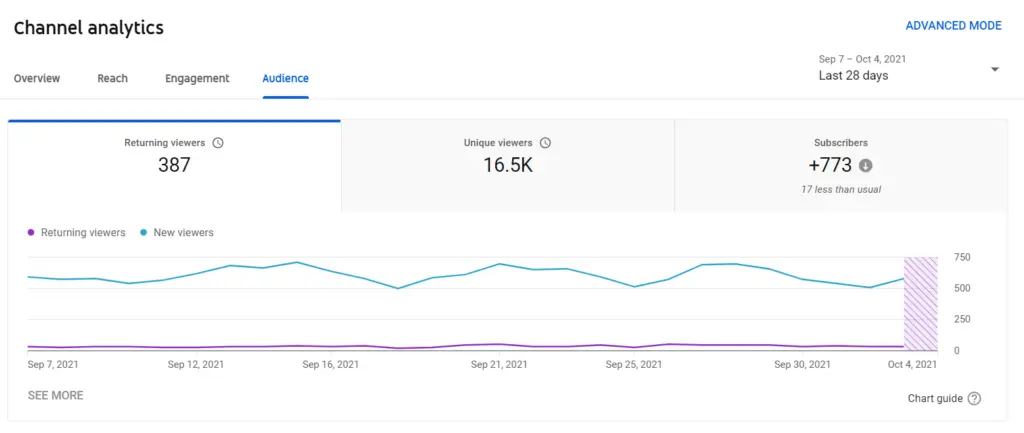
Audience Retention
As the name suggests, the Audience Retention report helps you measure how well your video can retain your audience. You can use it to understand whether your viewers finish watching your videos before leaving. If not, how much of it did they watch before they decided to leave?
And if you find that your videos aren’t retaining your audience well, it would be wise to consider freshening things up a bit. Are your videos too long? Maybe your intro isn’t captivating enough. Or maybe your copy isn’t really useful.
Try to change things up a bit based on videos that have the highest retention rate and see how things work out.
There’s an absolute audience retention report, which you can use to discover the most popular parts of the video. According to YouTube, you must prioritize improving the first 15 seconds of your videos because users tend to drop off around that time.
You can also use the relative audience retention report to compare how your video fares against similar videos on YouTube in retaining viewers.
In addition to this, you can even view audience retention based on traffic type. This involves viewing how well the audience retention is for organic traffic and paid traffic. Even among paid traffic, you can view the differences in retention rate of traffic for both paid display ads and paid skippable video ads.

Demographics
You can use the Demographics report to understand the gender distribution and age group of your audience. You’ll be able to further filter the data based on the viewing habits of the specific demographics that you’re most interested in.
For example, you’ll be able to see which of your videos seem to be the most viewed for female viewers between the ages of 13 and 17.
This information can help you figure out what type of content you should create to appeal to a certain demographic. You’ll also be able to find out which types of videos seem to perform well across all demographics.
Playback Locations
This report gives you insights about the pages and sites on which your videos are being watched. This report is especially helpful if you’re working with partners or collaborators. It gives you a clear idea how many views you’re getting directly on YouTube, through other websites, and through embedded videos. You’ll also be able to determine how many of the views on YouTube occurred on the specific page of the video or on a channel page.
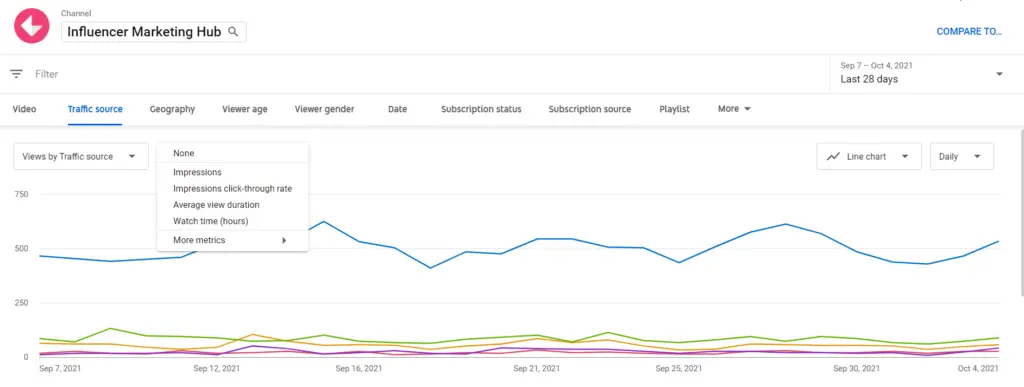
Traffic Sources
As you can tell from the name, the Traffic Sources report gives you information about which sites and YouTube features your viewers used for finding your content. This information can help you understand the different ways in which viewers find videos.
For example, you’ll be able to see whether your audience is finding your content by conducting a direct search on YouTube or through the video suggestions. You can also find out how much traffic you’re driving through social networking sites.
This is very useful for social media marketers, as you’ll be able to enhance your efforts in case you discover low social traffic to your YouTube videos.
The different traffic sources you can track include YouTube search, video suggestions, browse features, playlists, channel pages, YouTube ads, video cards/annotations, notifications, campaign cards, end screens, etc. And these are only the internal traffic sources. Besides these, you can also keep track of external traffic sources.
Devices
Another important report is the Devices report, which lets you see which devices your audience is using to view your videos. You’ll be able to see how many views are coming from different devices such as computers, mobile phones, gaming consoles, TVs, etc. And you can see the watch time for each of these devices.
This is crucial for understanding how your videos are performing across various devices. And if you notice that the watch time is much lower on mobile, for example, it might be a sign that you need to shorten your videos for easier viewing.
Interaction Reports
Aside from simply looking at how many people are viewing your videos, it’s also important to understand how those viewers are interacting with the videos. YouTube Analytics helps you with this by providing you with Interaction Reports.
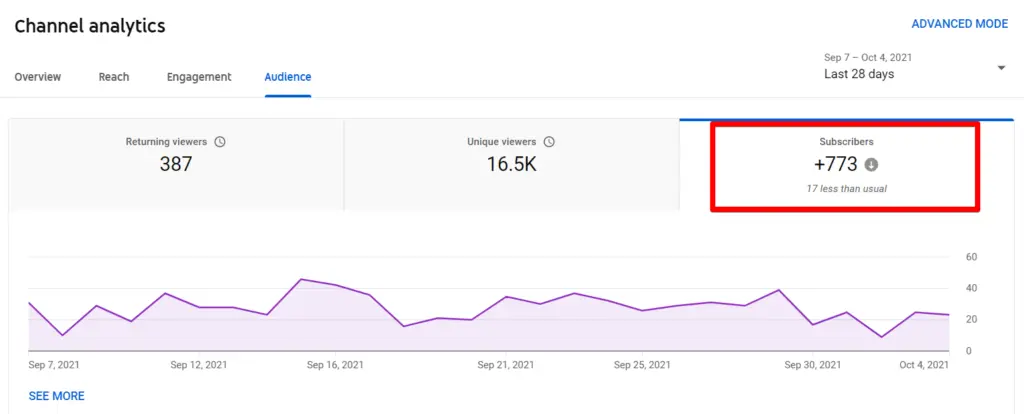
Subscribers
The Subscribers report helps you understand how you’re losing and gaining subscribers across various content, dates, and locations. This means you’ll be able to see which videos were able to drive subscriptions more effectively. So you could try and create more similar content to drive more subscribers.
In addition to this, you can also view which videos lost you the most subscribers. This will help you understand which types of content to avoid in the future. You’ll also be able to identify the locations in which your content has a large number of subscribers. You can then create content that will cater to viewers from these locations.
Likes and Dislikes
A great way to understand how well your content is performing is by looking at the Likes and Dislikes report. It helps you discover the net change of likes and dislikes your videos are getting. Although getting a high amount of likes is desirable, there’s no reason to worry if you’re not getting the desired amount. It could be that people are keener on viewing, sharing, and/or commenting.
At the same time, you need to pay close attention when your video is getting an unusually high number of dislikes. It might be a good idea to review the video that’s consistently getting a lot of dislikes and see what kind of changes you can make.
Comments
You can use the Comments report to see how people are commenting on your videos. It’ll be able to show you how many people are commenting and which videos are getting the most comments.
If possible, try to find the time to respond to these comments to show that you’re listening. It’s an excellent way to engage with your audience on a personal level.
Sharing
The Sharing report gives you accurate insights regarding how many times your videos have been shared. This means it doesn’t just show you the number of shares made through the YouTube Share button. It also helps you discover which sites people are sharing your video to such as Facebook, Twitter, Blogger, etc.
Try to find out which of your videos are getting a lot of shares on social media. See what you’re doing right in the video and create similar videos to drive even more social shares.
Annotations
The Annotations report helps you understand how your video annotations are performing in terms of click-through rates, close rates, etc. You’ll be able to see the number of times your annotation was displayed, number of times a clickable annotation was displayed, number of times a closeable annotation was displayed, number of clicks on the annotation, and more.
Annotations are a great way to encourage your viewers to take action during or after they watch your videos. Depending on how you implement them, you can significantly increase your viewership and engagement rate. Based on the Annotations report, you’ll be able to gain a clearer idea how to incorporate annotations more effectively.
For example, you might notice that the click-through rates and close rates of your clickable annotations are much higher than with non-clickable ones. This might encourage you to implement more of these annotations for your future videos.
Conclusion
These are some of the most important ways you can use YouTube Analytics to optimize your social media and video strategy. As you can see, all of these insights have some purpose. They give you clear information about how your current video strategy is performing, and what opportunities you have for improvement.
SUGGESTED

The 5 Best Free YouTube Analytics Tools You Should Try in 2026
Need to get a better understanding of how your YouTube videos are performing? Check out...

Game-Changing Video Content Creation Strategies in 2026
Explore game-changing video strategies for 2026 from storytelling and AI personalization...

YouTube’s New Analytics Just Made Data-Digging 10× Faster (Here’s How)
Discover how YouTube’s revamped Analytics helps creators quickly hone in on the data...