Influencer Marketing Hub is excited to bring our readers the latest insights from NeoReach's latest report on the creator economy.
The creator economy, a burgeoning sector characterized by monetizing digital content creation, has reached an impressive valuation of $250 billion, underscoring its rapid growth and the pivotal role it plays in the modern digital landscape.
Within this vibrant ecosystem, the nuanced processes and relationships between audiences and their favorite creators form the cornerstone of economic exchange and influence. Understanding these intricate dynamics—how audiences engage with content, the factors driving their purchasing decisions, and the nature of their relationship with creators—is not just beneficial but essential. It enables creators, platforms, and marketers to navigate the creator economy more effectively, optimizing strategies to foster loyalty, drive engagement, and enhance revenue generation.
As this sector continues to expand, such insights become invaluable, offering the keys to unlocking the potential of personalized, authentic connections between creators and their communities.
Questions we aim to answer:
- Is there a relationship between the amount of creator viewership and the likelihood of buying products? Do consumers trust the opinion of the recommended products (sponsorships) by creators?
- What is the relationship between creator influences and audience’s influenced purchases/downloads made in a month?
- In a piece of sponsored content, what encourages or discourages people from purchasing products?
Summary:
- Methodology
- Demographics
- Age Distribution
- Age Distribution & Average Time Spent on Social Media
- Gender Identity Distribution
- Location
- Buying Habits
- Platform People Feel Most Drives Their Purchases
- Encouraging Reasons to Buy
- Discouraging Reasons to Buy
- Foundations of a Good Ad
- Buying Relationships
- Age Group Summary
- Age Range & Sponsored Content Preference
- Age Range & Sponsored Content Preference
Methodology
NeoReach conducted and distributed a time-sensitive survey to gather information on the creator economy, catered towards understanding the viewing habits and effects on the audience of online creators such as its impact on their buying habits.
Over 1,000 fans of creators were surveyed to compile sufficient data to analyze the relationship between audiences and creators. Neoreach collaborated with creators to place surveys on their Instagram surveys for their audiences to fill out. The following data comes from diverse audiences largely located within the United States.
As the creator economy continues to grow and become more integrated into people’s lives, we hope the conclusions gathered will showcase the prominence of creators and their effects on consumer buying habits
How does the individuality of the audience impact the buying relationship between audience and creator? By exploring the makeup of the creators’ fans, we can highlight the most important data collected from our survey.
Demographics
Here, viewers told us how many hours pers day they spend watching their favorite creators.

A clear trend begins to form here where as the amount of time spent watching their favorite creators increases, the amount of viewers responding thus decreases, indicated by the smallest group of viewers being those that spend 8 or more hours per day watching content.
With this data, we are able to highlight that a significant portion of viewers dedicate a moderate amount of their days to watching their favorite content.
According to our survey, respondents viewing more than 5+ hours a day primarily used TikTok and Twitch as their main platforms. Indicating a relationship between watch time and video content.
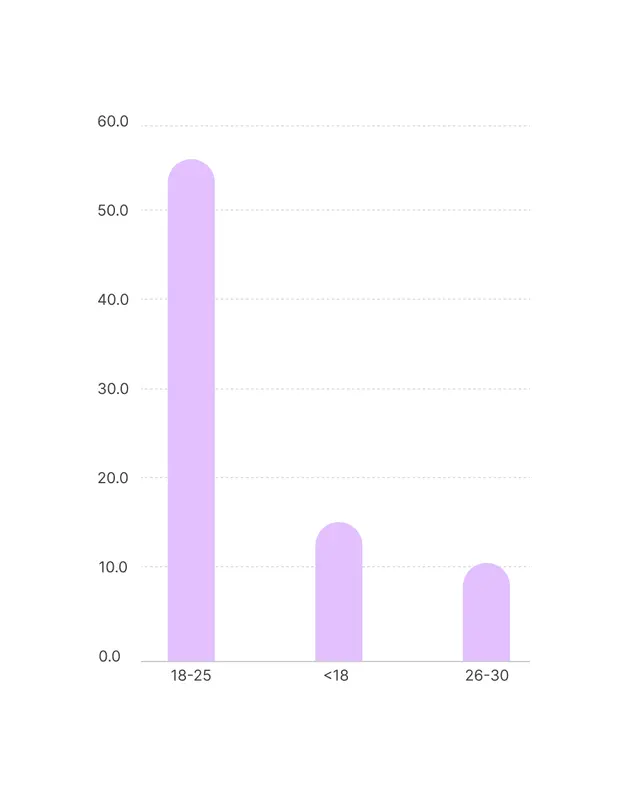
Age Distribution
18-25 years old: 55.77% - With the majority of viewers falling into this age group, it shows that a younger demographic of users are more engaged with the content they’re watching.
<18 years old: 15.63% - Further showing that the younger demographic of viewers are more engaged with the content they watch, a significant portion of them are also below 18.
26-30 years old: 10.34% - A much smaller percentage of viewers represent early career professionals.
The remaining age groups (31 and above) collectively make up less than 20% of those that responded to this survey, with a decreasing trend in representation as age increases.
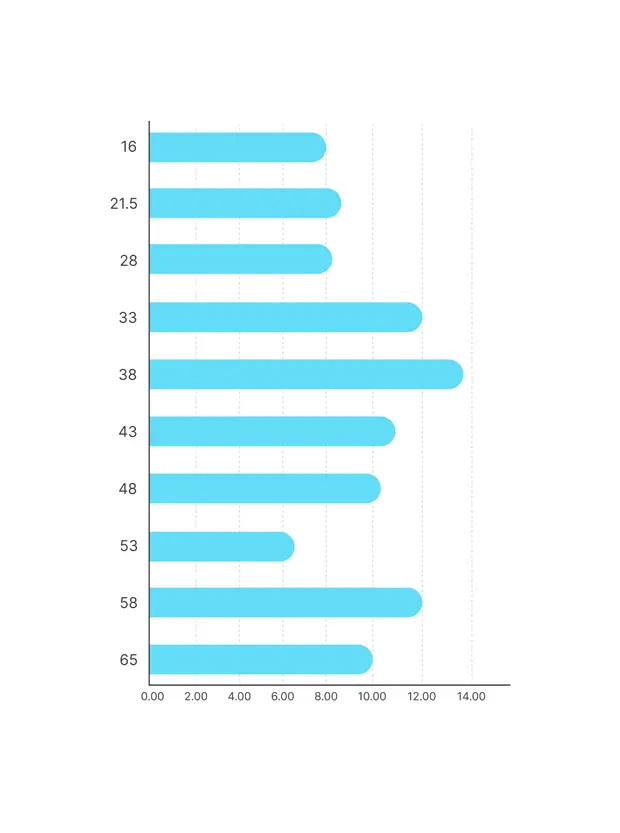
Age Distribution & Average Time Spent on Social Media
Gender Identity Distribution
Female: 75.24% - The majority of viewers identify as female, highlighting a predominantly female perspective within creators’ audiences.
Male: 22.60% - Those that identify as male represent a smaller portion of viewers.
Other: 2.16% - A small fraction of viewers identify as other gender identities.

Location
Yes: 80.87% - The majority of viewers surveyed are based in the US, giving a strong US perspective to the data collected.
No: 19.13% - Viewers based outside of the US represent a smaller portion of those surveyed.

Buying Habits
Where They Buy:
Here are the top digital locations and platforms that viewers seek out shopping items suggested by their favorite creators:
AMAZON STOREFRONT | CREATOR’S WEBSITE | LINKTREE | SWIPE-UP INSTAGRAM STORY |
33% | 17% | 15% | 35% |
Platform People Feel Most Drives Their Purchases
Instagram leads as the platform that most influences viewers’ purchases, followed by TikTok, with YouTube to a higher extent than Facebook, and Pinterest also being significant, but to a lesser extent. Twitch and Twitter and have the least influence on purchases among the platforms mentioned.

Encouraging Reasons to Buy
Viewers highlighted a variety of factors for what types of ads ultimately make them make a purchase; these were the most frequently mentioned:
"Funny" ads - Several viewers said that ads that use humor grab their attention, stating that funny ads make them more inclined to make a purchase.
"Clothes" ads - Some viewers indicated that ads focused on clothing also seem to resonate well, encouraging purchases.
"idk" (I don't know) - Similar to the discouraging factors, a number of viewers are unsure about what specifically makes them want to buy something, indicating varied personal preferences.
"Videos" - Video ads are specifically mentioned as encouraging, suggesting that the format of the ad (video in this case) can significantly impact its effectiveness.
"None" - A note-worthy amount of viewers mentioned that nothing specifically about any ad makes them want to buy the product. This could indicate a general indifference to advertisements.
These responses suggest that while some viewers are generally indifferent or unsure about what encourages them to make a purchase, specific content like humor and certain product categories like clothing, as well as the format of the advertisement, play significant roles in influencing purchasing decisions for others.
Discouraging Reasons to Buy
The viewers surveyed gave many reasons on why they may be discouraged from buying items from different types of ads, however, these were the top reasons mentioned:
“Boring” - A portion of the audience responded that boring ads put them off from purchasing products. Likely indicating that they become disinteresed and would rather be not watching the ad then being exposed to a beneficial product offering
“Nothing,” “idk” - Many viewers responded in a non-specific way, seeming unsure of what would discourage them from purchasing an item from any ad. These responses suggest that there isn’t a specific type of ad that discourages them, or that they don’t pay close attention to ads to be sure of their preferences.
"All" ads - A portion of viewers said that all ads discourage them from making a purchase, suggesting their general distaste for media monetization.
"YouTube ads" - A small portion of viewers mentioned being particularly put off by YouTube ads.
These responses suggest an interesting range of opinion and tolerance level for advertisements. Importantly, most viewers surveyed responded generically when asked for their opinion on what discourages them from purchasing from an ad; this could suggest that viewers were unsure about what they dislike in advertisements. Other viewers cited a complete distaste for ads, meanwhile, another portion suggested that they get put off a product specifically by the platform it is advertised on. This could suggest that advertising strategies among platforms as a whole are in need of a shift to become more eye-catching and engaging to the viewer and less of something they can’t wait to hit to get “skip ad,” for.
Foundations of a Good Ad
Focus on Authenticity and Engagement: Aim for genuine interaction rather than direct selling. Authenticity fosters a stronger connection with the audience.
Incorporate Humor: Use humor to grab attention. A lighthearted approach can make your ad more memorable and shareable.
Utilize Real People: Feature real individuals in your advertisements to provide authentic testimonials. This approach adds credibility and relatability.
Showcase Everyday Use: Demonstrate your product in common, relatable situations. Highlighting how the product fits into daily life can increase its appeal.
Prioritize Creativity: Design your ad to blend in with organic content on social media feeds. It should highlight the product's value creatively without overt selling.
Seamless Integration: Ensure your ad appears as engaging content rather than a disruptive advertisement. This strategy encourages organic interest and engagement.
Avoid Boring Content: Keep the content engaging and relevant to the product's daily application. Avoid content that doesn't effectively showcase the product in real-life scenarios.
Buying Relationships

Approximately 55.53% of the respondents find sponsored posts by creators convincing or influencing their purchases, while about 44.47% do not. This indicates that a slight majority of the audience surveyed is influenced by sponsored content when making purchasing decisions.
About 72.29% of the respondents indicated they are more willing to buy something suggested by a close friend, compared to 27.71% who would prefer a recommendation from a creator. This suggests a significant majority values the recommendations of close friends over creators when it comes to making purchasing decisions.
Of the sample, approximately 48.12% of them had purchased creator merch at least one time. Thus leaving a slight majority of 51.88% respondents having never purchased any merch from creators.

The pie chart visualizes a distribution of responses to our question about the effect of sponsored posts/content on consumer behavior. Based on this illustration:
- 60% of respondents feel that sponsored posts/content show new brands/products, indicating that a significant portion of the audience discovers new items through
- 30% of respondents believe sponsored content pushes them to purchase products they already know about, suggesting that for some consumers, sponsored posts reinforce existing preferences and
- 10% of respondents feel that sponsored content does both equally, showing a balance between discovering new products and reinforcing existing preferences.
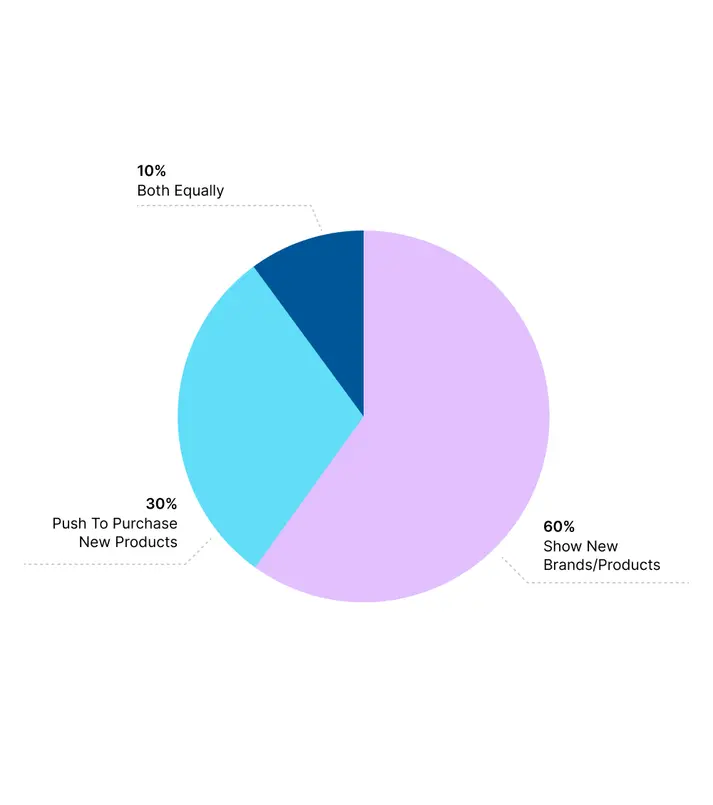
This visualization helps to convey how consumers perceive the role of sponsored posts in their purchasing journey, highlighting the the amount of times viewing an ad before purchasing the product.

Age Group Summary
With Correlation Analysis Findings

Age Range & Sponsored Content Preference
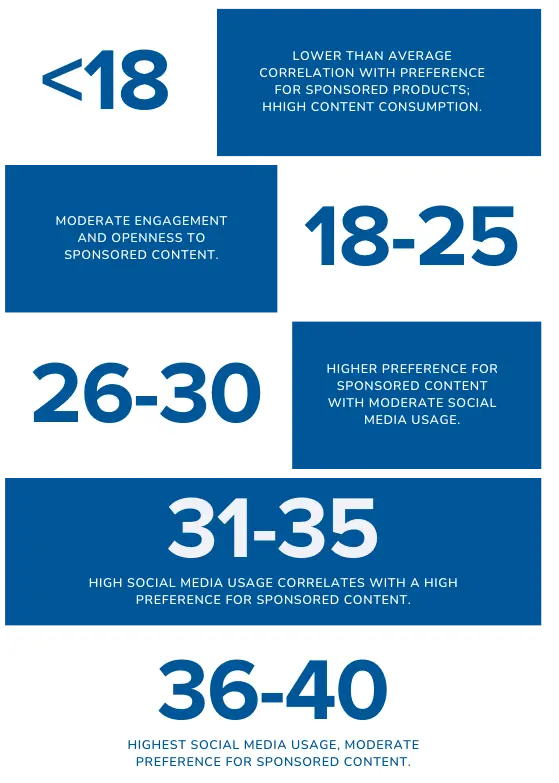
Age Range & Sponsored Content Preference
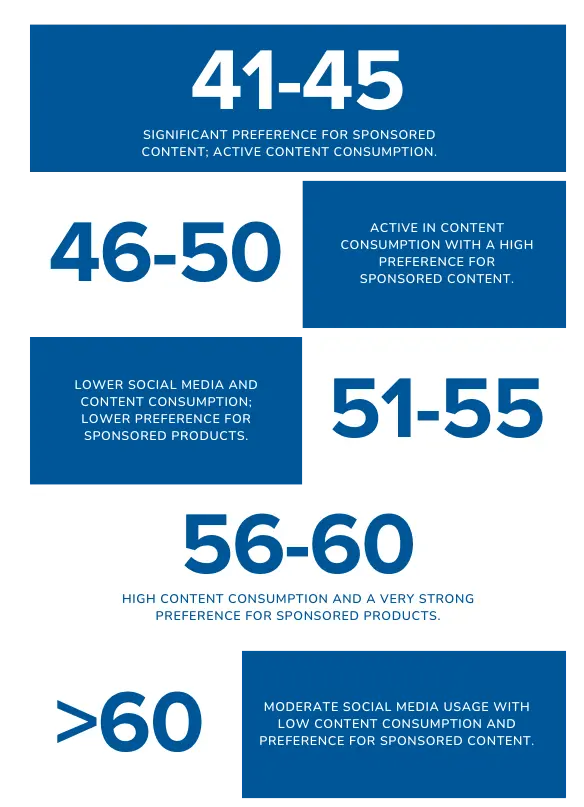
Significate
- The correlation analysis helps contextualize the age group data, showing that while there is a general trend of higher engagement leading to a greater openness to sponsored content, the strength of this relationship varies. The age group that shows the highest preference for sponsored products (56-60) does not necessarily spend the most time on social media, suggesting other factors at play in determining this preference.
- The data underscores the importance of demographic targeting in marketing strategies, particularly when leveraging sponsored content. Marketers and content creators should consider not only the quantity of social media usage and content consumption but also the nuanced preferences of different age groups towards sponsored content.
Integrating the correlation analysis findings with the age group summary highlights the complex interplay between social media engagement, content consumption, and consumer openness to sponsored content, offering strategic insights for tailored marketing and content creation.
Summary of Findings
Our analysis of the survey data provides valuable insights into consumer behavior concerning social media use, the influence of digital creators, and the impact of advertising on purchasing decisions. Here are some key findings:
Correlation Between Time on Social Media and Purchases Influenced by Creators:
A weak to moderate positive correlation (approximately 0.408) was found between the time respondents spend on social media and the number of monthly purchases/downloads influenced by creators. This suggests that higher social media engagement is slightly associated with an increased likelihood of making purchases or downloads based on creators' recommendations, though other factors also play significant roles in purchasing behavior.
Effectiveness of Sponsored Content:
Respondents indicated that sponsored posts/content plays a significant role in introducing new brands/products and influencing purchases of known products. The survey responses suggested that sponsored content effectively impacts consumer purchasing behavior, either by showcasing new brands or by reinforcing existing preferences.
Advertisement Views Before Purchase:
The distribution of responses to how many times an advertisement needs to be seen before making a purchase decision revealed that the majority of respondents (nearly 32%) require viewing an advertisement between 2 to 4 times. This is followed by the 1 to 2 times and 4 to 6 times view ranges, each capturing about 19% of the total responses. A smaller portion of respondents (13.46%) requires more than 10 views before deciding to purchase, indicating laggard buyers.
Conclusion
The survey data underscores the significant role of social media and digital creators in shaping consumer preferences and purchasing decisions. The positive correlation between time spent on social media and purchases influenced by creators highlights the importance of social media engagement in marketing strategies. Additionally, the findings regarding advertisement views before purchasing underscore the need for marketers to optimize the frequency of their ad placements to align with consumer behavior effectively.
The insights into how sponsored content influences consumer behavior further emphasize the dual role of such content in both introducing new products and reinforcing preferences for known products. This dual impact provides a strategic advantage for brands looking to leverage digital creators and sponsored content to enhance their marketing efforts.
In conclusion, understanding these dynamics can help brands and marketers design more effective strategies to engage with their target audience, leveraging the power of social media and the influence of digital creators to drive consumer purchasing behavior. This analysis aims to offer a glimpse into the digital age, focusing on the changing dynamics of digital marketing and consumer behavior within the realm of social media.
Let Us Run Your Next Campaign!
Ready to launch your most lucrative influencer marketing campaign ever? Are you prepared to go viral with the biggest powerhouse influencers on social media? Let NeoReach and our talented team of experts bring your campaign to life!

