The Racial and Gender Inequalities Influencer Report 2022 is our inaugural overview of racial and gender inequalities in the influencer marketing industry. It summarizes the thoughts of more than 2000 influencers, along with additional data and research from our partners and reliable third parties. In addition, we asked questions relating to diversity, equality, and inclusion and whether the influencer marketing industry today reflects these values.
Racial and Gender Inequalities Influencer Report 2022:
Notable Highlights
- 58.3% of influencers feel they have faced discrimination
- 47.73% believed they had suffered from gender discrimination
- 58.4% of respondents who faced discrimination had it occur on TikTok
- 80%+ of Macro-Influencers face discrimination
- 21.75% of influencers claim discrimination based on their physical features. This is highest for macro- and mega-influencers, e.g., fat-shaming and personal abuse in comments on their videos and posts
- There is a strong belief that social media platforms ask their moderators to suppress particular views and content, particularly those that diverge from what they consider the norm, and as a result, more than 70% of influencers feel that some of their posts failed to get the expected exposure
Diversity, Equity, and Inclusion (DEI) in Influencer Marketing: Survey Methodology
We surveyed over 2000 influencers from various backgrounds, ensuring we catered for diversity, equality, and inclusion in our subject selection. Of the influencers, 72.1% considered themselves micro-influencers, with fewer than 15,000 followers. 9.5% were regular influencers, with between 15,000 and 50,000 followers. 5.5% classify as rising influencers (50,000 – 100,000 followers) and 4.8% qualify as mid-influencers (100,000 – 500,000 influencers). 2.7% were macro-influencers (500,000 – 1 million followers), and a surprisingly high 5.5% can call themselves mega-influencers, with more than 1 million followers.
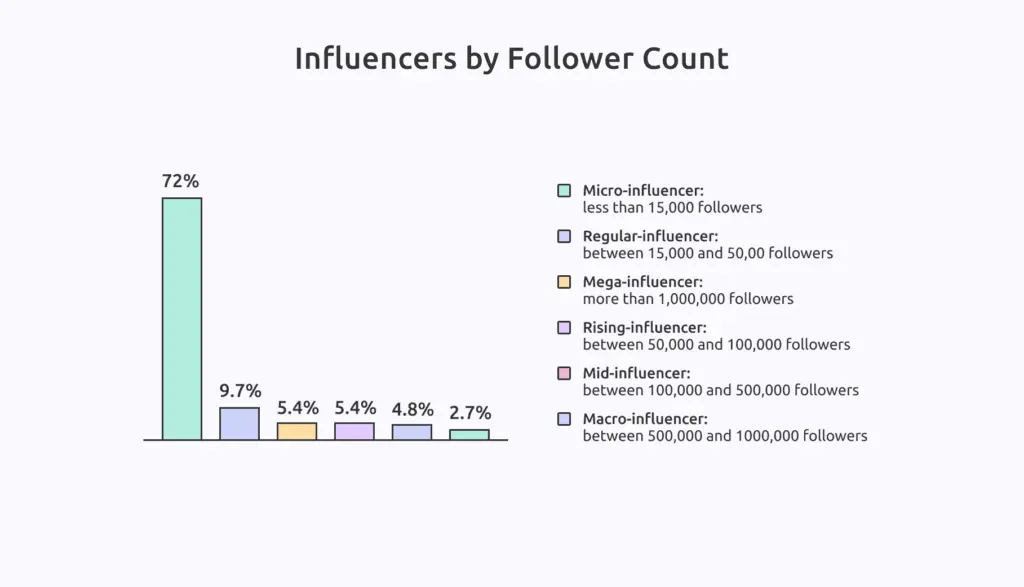
These terms, which match our partner Upfluence’s terminology, differ from our usual usage on this site, where we typically refer to the smallest influencers as nano-influencers and use the term micro-influencer for the next influencer tier (equivalent to rising and mid-influencers in this report).
As this report is about racial and gender inequalities in influencer marketing, we thought it vital to understand our respondents' demographics. Additionally, we wanted to ensure that we had diversity in our survey sample. When asked to identify their ethnicity, 47.7% identified as Asian or Pacific Islander, 13.4% as Black or African American, 10.7% as White or Caucasian, 4.8% as Hispanic or Latino, 4.5% as Multiracial or Biracial, and 4.3% as Native American or Alaskan native. The remaining 14.5% identified as being of a race/ethnicity not listed here.
Our sample was perhaps more male-oriented than the general pool of influencers, with 58.4% of respondents identifying as male, 35.1% as female, 1.5% as trans-female, 1.5% as trans-male, and 3.5% as "other." While the inclusion of non-binary influencers helped ensure improved inclusion in our survey, it is perhaps unfortunate that we didn't have more female respondents, matching the influencer population as a whole.
With the survey having a majority of micro-influencer respondents, it is probably not surprising that the average price per post received when performing brand collaborations was relatively low, with 75% averaging $25-$200. In addition, 11% averaged $200-$1000 per post, 4.2% averaged $1000-$3000, 4.5% averaged $3000-$15,000, and 5.3% $15,000+. This report also includes data from IZEA's State of Influencer Equality survey. However, their report appears to exclude micro-influencers from its calculations, the average price per post they report is much higher than our survey respondents' rates.
Nearly 60% of Influencers Feel They Face Discrimination
We asked our influencers whether they feel they have ever been discriminated against (as an influencer) on any social platform. 58.3% stated they thought they had been on the wrong end of discrimination, leaving 41.7% who hadn't.
Macro- and Mega-Influencers Suffer Most From Discrimination
We have already established that higher-paid influencers are more likely to feel they have faced discrimination than lower-paid influencers. Therefore, it should be no surprise that Macro-influencers (81.25%) and Mega-Influencers (69.7%) are most likely to report facing discrimination.
When you compare the demographics of the influencers who claim they have faced discrimination with the average price influencers receive per brand collaboration, we see some interesting, perhaps confusing, results. By far, the largest group to face discrimination is those influencers who can generate $1,000-$3,000 per post (80%), predominantly the macro-influencers in the survey. Yet, that isn't the highest-paid group. A small group of influencers in our survey can happily charge $15,000+ per sponsored post, 71.88% of whom stated they had faced discrimination.
More Than 60% of Those Not Discriminated Against Believe There is Discrimination in the Influencer industry
As we saw above, only 41.7% of the influencers who replied to our survey had not personally experienced discrimination in the industry. However, that doesn't mean that these people haven't seen the effects of discrimination on others. We asked these "discrimination-free" influencers whether they believed that discrimination occurred in the influencer industry, and 60.8% stated they did.
Almost 50% of Influencers Face Discrimination Based on Their Gender
When asked to highlight an area of discrimination the respondents felt they had experienced as an influencer, 47.73% believed they had suffered from gender discrimination. Physical feature discrimination (21.75%) followed this, then racial discrimination (13.29%), political discrimination (9.06%), and sexual discrimination (8.16%). However, these figures may understate some types of discrimination, as they add up to 100%, indicating that respondents could only identify one type of discrimination. It is likely that, in practice, some influencers will encounter multiple types of discrimination.

Nearly 90% of Trans-Male Influencers Feel Discriminated Against
Laws affecting the LGBTQ community differ widely worldwide (and even between states in large nations like the USA). So, it is perhaps unsurprising that influencer respondents who identify as Trans-male (88.89%), Other (80.95%), and Trans-female (66.67%) feel they face the most discrimination because of their gender. We should acknowledge, of course, that the sample sizes of those identifying as Trans-male, Trans-female, and Other are considerably smaller than those identifying as Male or Female, which may affect overall statistics.
Male Influencers Earned 30% More on Average Than Female Influencers in 2021
Earning differential between the genders has been a significant concern in many countries in recent years, across many sectors. This problem is by no means confined to influencer marketing. Women across all sectors earned merely 83% of what men earned in 2020, based on the real median earnings for full-time, year-round workers. And this was a considerable improvement compared to 1980 when women made just 60.2% of men's income.
IZEA data showed that the pay differential is even worse in influencer marketing The best differential was in 2020, where males averaged $2,258 per post and females $1,719, a 24% differential. By 2021, however, although pay rates increased for both genders, males negotiated better deals to reach a $2,978 average, compared to $2,289 for females, and the gap grew to 30%.
Judging by the results we found in our survey, male influencers don’t recognize that they are earning more than their female counterparts, however. Remember that 58% of our respondents identified as male, yet nearly 60% felt unfairly discriminated against for a campaign based on their gender.
Instagram Stories Are an Exception – Females Now Earn 58% More Than Males on Average
One notable exception to the practice of brands paying male influencers more than their female counterparts comes with Instagram Stories. In 2020, male influencers averaged $451 per Story, with payments to females lagging at $421. In 2021, however, while average pay rates rose significantly to $609 per Story for males, they skyrocketed to $962 for females, possibly reflecting higher engagement rates from Female influencers.
Males May Receive More Per Post, But Many More Females Are Sponsored to Create More Posts
We may have had a majority of males reply to our survey, but according to IZEA data, significantly more women dominate the deal flow in influencer marketing. However, although female influencers continue to own the majority of influencer marketing deal flow, male influencers' share jumped from a low of 9% in 2020 to a high of 15% in 2021.
IZEA has calculated the comparative gender share of sponsorship transaction volume across all social platforms from 2015 to 2021. During that time, females dominated the deal flow, from highs of 90% in 2015 and 2020 to a low of 83% in 2021. Allowing for "Unspecified" counting for 1-2% of the flow each year, the male share varied from 9% in 2015 and 2020 to a high of 15% in 2021.
The Most Popular Influencers Receive the Most Physical Feature Discrimination
If influencer marketing is going to positively demonstrate inclusion, then it should provide opportunities for people of all types.
Logically, significant influencers are more likely to face abuse and discriminatory comments for real (and imagined) issues with their physical features – they have more engagement and interaction with their audiences in total, if not proportionately. However, it is still noticeable that physical feature discrimination ranks as a significant type of discrimination faced by macro-influencers (30.77%) and mega-influencers (26.09%) compared to less-followed influencers. In the macro-influencers case, physical feature discrimination is their equal-highest type, alongside racial discrimination. Gender discrimination has been much less problematic for this group than for many other influencer types. Some influencers have complained that social media algorithms favor good-looking people who match certain physical criteria.
Nearly 2/3 of Influencers Believe Social Media Platforms Ask Moderators to Suppress Particular Views and Content
We asked our respondents whether they believe social media platforms ask moderators to suppress content by certain nationalities, political views, disabilities, or users from lower socioeconomic classes. Nearly half (47.8%) fully agreed with this statement, with another 15% somewhat agreeing. More than a quarter acknowledge that they didn't know it was possible. Only 8.2% fully disagreed, with 3.8% somewhat disagreeing.

More Than 70% Believe That Discrimination Meant Some of Their Posts Didn't Receive the Expected Exposure
We asked our respondents whether they believed their posts hadn't gotten the exposure they would otherwise have because of their political views, race, or beliefs. 71.8% of our respondents agreed with this statement, with only 28.2% disagreeing.

The Proportion of Sponsorship Deals Going to Non-White Influencers Has Increased Over Time
In addition to the data collected from the Influencer Marketing Hub survey, we collated data from our partners and additional research. For example, IZEA’s State of Influencer Equality report, which they released in February 2022. As part of their research, they calculated the average cost paid per post across all social platforms, classified by identified race. Their ethnicity definitions differ slightly from our own but are close enough that we can make comparisons.
According to IZEA's data, 73% of all influencer sponsorship payments in 2015 flowed to white influencers, leaving 27% for non-white. However, this significant imbalance improved each year (apart from a blip in 2020), and in 2021 the percentage of influencer marketing deals flowing to white influencers (57%) slipped below their share of the U.S. population (58%) for the first time.
The Worst Discrimination Faced by Influencers on TikTok
We asked influencers to name a channel where they faced discrimination. Significantly more than half of those respondents who felt they had faced discrimination stated that it occurred on TikTok (58.42%). This compares to 13.62% who selected YouTube, 12.9% on Instagram, 10.04% on Facebook, and 5.02% who felt most discriminated against by influencer agencies.
This is particularly interesting when you consider that TikTok is only the sixth most popular social app for monthly average users, with Facebook still being the most used platform and Instagram having the most influencers.
Chandra Steele in PCMag reported on how racial inequalities affect influencers. She noticed stark differences in follower counts for black and white influencers (she didn't split races any further down in her analysis). TikTok wasn't the only platform of note here (Instagram stands out too), but there is nonetheless a stark contrast on TikTok. Steele observed the popularity of houses of creators on TikTok, who live and make content together. She noted that LA-based The Hype House, with predominantly white creators, has 19.8 million followers, while Atlanta-based Collab Crib, with primarily Black creators, has only 545,200 followers.
The Guardian also reported that TikTok 'tried to filter out videos from ugly, poor or disabled users'. According to documents published by the Intercept, TikTok told its moderators to exclude particular types of videos when selecting content for the influential "For You" feed. These include videos featuring an "abnormal body shape (not limited to: dwarf, acromegaly)," who are "chubby … obese or too thin" or who have "ugly facial looks or facial deformities." Likewise, moderators should remove videos where "the shooting environment is shabby and dilapidated" from the "For You" feed.
TikTok previously had rules to enforce Chinese foreign policy overseas, although they appear to have changed these now. This is important to note since we have Asian influencers responding to our survey.
Yet despite respondents highlighting TikTok in this survey, the other social platforms have also come under scrutiny for allegedly discriminating against some groups. For example, in 2020, a group of Black creators sued YouTube, claiming the platform's algorithm systematically removes their content or limits how much they can earn from advertising. They didn't win, but it certainly heightened concerns.
67% of Influencers Use a Social Media Moderation Tool
The days of leaving unfiltered comments on your social pages are probably long gone. 67.5% of our surveyed influencers chose to use some form of social media moderation tool to ensure their posts and pages aren't scarred with discriminatory and inappropriate comments and content.
As we saw in Top 15 Social Media Moderation Tools for Safer User Experiences, you can use these tools to clean up the act of your followers.. Typical tools include NapoleanCat, Pattr.io, Juicer, WebPurify, and Respondology.
43% of Respondents Believe Racial Pay Rate Gaps Are at Their Worst in Influencer Marketing
We asked our respondents whether they believed racial pay gaps might be at their worst in influencer marketing. 43.8% fully agreed with this sentiment, with 19.5% somewhat agreeing. An additional 26.8% felt racial pay gaps might be at their worst in influencer marketing. A mere 6.3% fully disagreed with this sentiment, alongside 6.3% who somewhat disagreed.
Influencers and creators accumulate followers when their posts appear in discovery-type sections on platforms like Instagram's Explore Page and TikTok's For You Page. However, as Chandra Steele in PCMag observed, there is a noticeable discrepancy between follower numbers for the top white influencers and those of their black counterparts. "While Instagram, TikTok, and other social media sites had long been suspected of suppressing Black voices on their platforms, Instagram has admitted that its algorithms and policies are at fault."
MSL conducted a study in 2021 focusing on the racial gap in influencer marketing. They noticed this significant difference in follower numbers between white and Black influencers. 77% of Black influencers fall into the nano and micro-influencer tiers, with compensation from brands averaging $27,000 annually, compared to 59% of white influencers. Conversely, only 23% of Black influencers, compared to 41% of white influencers, make it into the macro-influencer tier, with earnings averaging upward of $100,000.
MSL found the racial pay gap between white and BIPOC influencers (Black, Indigenous & People of Color) to be 29%. However, when focusing specifically on the gap between white and Black influencers, the difference widens to 35%. In comparison, the pay gap in some other industries is much smaller, including education at 8%, business and finance at 16%, construction at 19%, and media, sports, and entertainment at 16.1%. It looks like the respondents to our survey have noticed this racial pay discrimination on a personal basis.
In addition, 49% of Black and 36% of BIPOC influencers in MSL's survey reported that their race contributed to a lower offer, below market value.
The respondents to both the Influencer Marketing Hub survey and the MSL survey agree that there is a significant difference in the rates offered to influencers of different races.
Average Payments to White/Caucasian Influencers Have Risen Most Since Pre-Covid Times, But They Are Still Comparatively Low
IZEA found that Influencer pay rates rose across the board in the first two years of Covid, with 2021 figures being approximately double 2019 rates. However, there were variations between races. White/Caucasian influencers increased their rates by 112%, from an average of $1,021 per post in 2019 to $2,169 in 2021. Black/African Americans, on the other hand, were only able to increase their rates by 83.5%, from $1,387 to $2,546 per post. Hispanic/Latinos increased their rates by 71.4%, from $1,248 to $2,139, and the rates received by Asians rose 87.8%. Finally, IZEA grouped everyone else as "Non-White Other,” and their pay increased by 135%, from $1,145 to $2,693 per post.
These rates seem extraordinarily high, remembering that our survey found that 75% of the influencers we surveyed average $25-$200 per post. We can only assume that IZEA narrowed its research to include only influencers in the Rising Influencer to Macro-influencer range, omitting smaller nano- and micro-influencers and possibly also large mega-influencers.