UPDATE: See the 2022 Social Media Benchmark Report HERE
Few people would dispute that 2020 has been a decidedly unusual year. COVID-19 has turned the world on its head and changed the way we all live and do business. People worldwide have spent much of the year locked down and often had to operate their businesses from home. Zoom has almost become the de facto way to hold business meetings, and people have had to alter the way they communicate with each other.
This has led to a surge in social media usage on many platforms, often in place of face-to-face meetings. Many employees have found themselves stuck at home with little to do and have increased their time on their favorite social media. This has increased the opportunities for inventive firms to engage in social media marketing – they have a social audience like never before. Simultaneously, many firms have transferred their budget away from other marketing media, deciding to follow their audience. It makes sense to shift your marketing energy to promotions on highly engaged social accounts than creating billboards for sites where few people now pass, for instance.
Our Social Media Benchmark Report 2021 has collated statistics and data relating to social media marketing predominantly over the last 12 months. Although there is an inherent connection between social media and influencer marketing, we have ignored influencer marketing here, leaving that for our annual State of Influencer Marketing Benchmark Report. Also, although it is impossible to ignore the effects of COVID-19 on 2020, continuing into 2021, and we include a small section on the impact of COVID-19 on social media usage, we leave the rest of our statistical analysis of the effects of the disease to our Coronavirus (COVID-19) Marketing & Ad Spend Impact Report.
UPDATE: See the 2022 Social Media Benchmark Report HERE
Social Media Benchmark Report 2021:
Social Media Usage
More Than 4 Billion People Worldwide Now Use Social Media
According to We Are Social's Digital 2020 October Snapshot, more than 4 billion people worldwide (4.14 billion) now use social media each month. That's an incredible 53% penetration rate for the entire world's population. In comparison, there are 4.66 billion internet users, so 88.9% of all internet users use social media each month. An average of 2 million people sign up to social networks every day.

Social media's popularity is even more evident when you look at percentage changes for the year October 2019 to October 2020. In that time:
- The total world's population grew 1.0%, +81 million
- Unique mobile phone users rose 2.0%, +102 million
- Internet users rose 7.4%, +321 million
- Active social media users rose 12.3%, +453 million.
95% of Internet Users Used Social Media or a Messaging Service in the Past Month
Astoundingly, 98% of all internet users aged 16 to 64 visited or used a social network or messaging app in the past month. 90% engaged with or contributed to social media in the same timeframe.
Internet Users Average More Than 8 Social Accounts
We definitely love our social. The average number of social media accounts per internet user (aged 16 to 64) is an incredible 8.3. However, this is not an indication that we use each of our social accounts every month. Many of us have accounts that sit dormant.
Facebook Has 2.7 Billion Monthly Active Users
We Are Social (in association with Kepios Analysis) has collated user numbers for each of the social networks as of October 2020 from various sources. Not all social networks publicize their user numbers, so these figures come from a range of data sources and assumptions. They represent monthly active users, active user accounts, or addressable advertising audiences, depending on the social network.

- Facebook – 2,701 million
- YouTube – 2,000 million
- WhatsApp – 2,000 million
- Facebook Messenger – 1,300 million
- Weixin / WeChat – 1,206 million
- Instagram – 1,158 million
- TikTok (excluding Douyin) – 689 million
- QQ – 648 million
- Douyin – 600 million
- Sina Weibo – 523 million
93% of Twitter Users Also Use YouTube
This benchmark looks at the overlaps between a selection of social platforms. In reality, there is considerable cross-usage. For example, only 1% of Instagram users claim to use that platform alone. Even YouTube users tend to use other social media, with 5.1% of the respondents claiming to use YouTube solely.

Notably, there are large numbers who use YouTube alongside their leading primary platform. Combinations include:
- 93% of Twitter users also use YouTube
- 92% of Instagram users also use YouTube
- 92% of Pinterest users also use YouTube
- 91% of Snapchat users also use YouTube
- 90% of Facebook users also use YouTube
- 90% of Reddit users also use YouTube
- 90% of TikTok users also use YouTube

Other notable non-YouTube combinations include:
- 87% of Snapchat users also use Instagram
- 87% of Twitter users also use Facebook
- 86% of Instagram users also use Facebook
- 85% of TikTok users also use Facebook
- 85% of Pinterest users also use Facebook
Average Daily Social Media Usage is Nearly 2.5 Hours
Most internet users aged 16 to 64 spend a considerable amount of time each day with different media and devices. The most notable results are:
- Using the internet – 6 hours 55 minutes daily
- Using social media – 2 hours 29 minutes daily
- Watching television (broadcast and streamed) – 3 hours 29 minutes
- Listening to music streaming services – 1 hour 34 minutes
- Using a games console – 1 hour 14 minutes
50% of People Use Social Media to Record Their Personal Milestones
Sprout Social asked survey respondents about whether they were likely to use social media during certain events:

- Personal milestones – 50%
- Sporting events – 45%
- Natural disasters – 42%
- Holidays – 42%
- Political events – 39%
- Pop culture moments – 38%
- Award shows – 30%
Of course, while people may happily be making social posts on these occasions, that does not necessarily mean that they are interested in interacting with brands. Only 14% have any interest in seeing brand posts during a natural disaster, for instance. However, 54% would be happy seeing brand posts during a sporting event.
YouTube is the World's Most Visited Social Media Site
Broadband Search data shows the most visited websites in 2020, both for the world and for the USA. Perhaps unsurprisingly, these statistics are dominated by the major social networks.
You don't have to go very far into the list to see social media's popularity with YouTube now topping the list. Social sites in the overall 20 most visited websites in September 2020 were:
- YouTube.com – 8.564 billion monthly global visitors, 1.625 billion monthly US visitors
- Facebook.com – 3.483 billion monthly global visitors, 512 million monthly US visitors
- Twitter.com – 2.008 billion monthly global visitors, 535 million monthly US visitors
- Instagram.com – 525 million monthly global visitors, 96 million monthly US visitors
- Pinterest.com – 420 million monthly global visitors, 160 million monthly US visitors
- Reddit.com – 278 million monthly global visitors, 184 million monthly US visitors
- Linked.com – 200 million monthly global visitors, 71 million monthly US visitors
Most Parents Say Their Child of 11 or Younger Watches YouTube Videos
Pew Research surveyed US parents, asking them about their children's screen habits. 57% of parents with children aged two or younger admit their children watch YouTube videos. The number rises with the children's age, reaching 81% for 3-4-year-olds and 89% for children aged 5-11. Overall, 80% of the parents with children aged 11 or younger admit that their children watch YouTube.

The parents were then asked how frequently their children watch YouTube videos. The results were:
- Several times a day – 35%
- Once a day – 19%
- A few times a week – 31%
- Every few weeks – 11%
- Less often – 5%
Two-Thirds of Employees Use Social Media to Communicate With Their Fellow Workers
We Are Social asked their respondents how they communicate with other employees at least once per week. While email was the clear leader here, social media was surprisingly high for a work setting:
- Email – 92%
- Messaging Systems (e.g., WhatsApp) – 79%
- Collaboration tools (e.g. Slack) – 73%
- Video calls – 71%
- Social media – 66%
Of course, messaging services like WhatsApp and Facebook Messenger are also highly connected to social media.
Top Four Mobile Apps Are Part of Facebook family
October 2020 App Annie data makes clear the dominance of Facebook and the company's various apps. When you look at the ranking of mobile apps by monthly active users (excluding China), the top four places are all Facebook-owned:

- Facebook Messenger
However, when you look at the ranking of mobile apps by downloads, TikTok now leads:

- TikTok
- Zoom Cloud Meetings
TikTok takes the number 2 spot when you rank apps (excluding games) by consumer spend, with Tinder taking the top position, and YouTube number 3.
Facebook Second Only to Google Across Multi-Platform Corporations in the USA
Comscore ranks multi-platform digital media properties in the United States, based on ownership, i.e., they look at the total performance of sites across all the different media types (mobile, search, video, tv, box office, and movies) owned by the large corporations. Effectively, this ranking compares the unique visitors or viewers that each major internet/television/movie company generates across their entertainment assets.
Notably, the major internet-based companies head this list. Remember that these figures only cover the United States and do not include visitors/viewers from elsewhere.
- Google Sites – 266,235,000 unique visitors/viewers
- Facebook – 224,367,000 unique visitors/viewers
- Microsoft Sites – 223,328,000 unique visitors/viewers
- Verizon Media – 213,328,000 unique visitors/viewers
- Amazon Sites – 209,910,000 unique visitors/viewers
- Viacom CBS Digital – 194,997,000 unique visitors/viewers
- Warner Media – 186,276,000 unique visitors/viewers
- Comcast NBCUniversal – 180,774,000 unique visitors/viewers
- The Walt Disney Company – 171,229,000 unique visitors/viewers
- Apple Inc. – 169,292,000 unique visitors/viewers
Other social media related sites in this list include:
- Twitter – 114,488 unique visitors/viewers
- Pinterest – 105,772 unique visitors/viewers
- Snapchat Inc – 75,555 unique visitors/viewers
- LinkedIn – 65,269 unique visitors/viewers
Snapchat Still US Teens' Favorite Social Platform, But TikTok Rapidly Catching Up
eMarketer regularly asks US teens about their preferred social media platforms. Back in Fall 2017, the results were clear-cut:
- Snapchat – 47%
- Instagram – 24%
- Facebook – 9%
- Twitter – 7%
The teen shift away from Facebook was already clear at this point. Teen social preferences are obviously quite different from their elders.

Since 2017, we have seen the explosion of TikTok and, to a lesser extent, Discord. The respondents' preferences in Fall 2020 were:
- Snapchat – 34%
- TikTok – 29%
- Instagram – 25%
- Twitter – 3%
- Discord – 3%
- Facebook – 2%
Nearly 39% of TikTok's US Users Are Aged 18-24
TikTok is, of course, popular with the young, but its use by older people is increasing. TikTok has the highest adoption with young adults, reaching 38.1% of 18-24-year-olds in March 2020. This is more than three times the 11.7% reach it has with 35-44-year-olds. It also has greater reach among women (45.2%) than men (31.2%) in the 18-24-year-olds, a trend continued with TikTok's older users. Note that these figures ignore TikTok users aged under 18.

Age Distribution, March 2020:
- 18-24-years – 38.8%
- 25-34 years – 26.5%
- 34-44 years – 15.2%
- 45-54 years – 11.0%
- 55-64 years – 7.5%
- 65+ – 1.0%
A Surprisingly High Percentage of US TikTok Followers Come From Wealthy Families
TikTok user income data, provided by Marketing Charts using Comscore data, throws up some surprising results. It shows that an incredible 40.2% of adult TikTok followers came from households with an annual income of more than $100K. However, the second most popular grouping was households earning less than $25K. The income split was:

- $100K+ – 40.2%
- $75-100K – 13.6%
- $60-75K – 7.2%
- $40-60K – 12.4%
- $25-40K – 11.2%
- <$25K – 15.4%
Prediction That Instagram US Users Will Plateau
After years of rapid growth, eMarketer predicted that Instagram numbers would begin to plateau, with the platform already used by many Americans.
Predicted numbers for 2018-2023, with the annual percentage change, are as follows:
- 2018 – 100.5 million
- 2019 – 107.2 million, 7.7% increase
- 2020 – 112.0 million, 4.5% increase
- 2021 – 115.6 million, 2.2% increase
- 2022 – 120.3 million, 1.8% increase
Of course, the yearly increase may be decreasing, but that doesn't mean any decrease in Instagram usage, with the total numbers of Instagram users still increasing each year.
Facebook is the Dominant Social Media News Source
Pew Research released a report looking at how people viewed the way social media delivers the news. One statistic they looked at was the comparative importance people gave to the various social networks for delivering news. Although the results, to some extent, matched the overall popularity of the social sites, there were some clear differences. The percentage of US adults getting news from the social networks were:

- Facebook – 52%
- YouTube – 28%
- Twitter – 17%
- Instagram – 14%
- LinkedIn – 8%
- Reddit – 8%
- Snapchat – 6%
- WhatsApp – 4%
- Tumblr – 1%
- Twitch – 1%
- TikTok - <1%
Those Who Rely on Social Media for Political News Have Less Political Knowledge Than Other Groups
Pew Research then went more-in-depth in their questioning. They looked for a correlation between where people gain their political news and the level of political knowledge they believe they possess. There were some distinct differences:
- News website or app – 45% high political knowledge, 31% middle, 23% low
- Radio – 42% high, 34% middle, 24% low
- Print – 41% high, 29% middle, 31% low
- Cable TV – 35% high, 29% middle, 35% low
- Network TV – 29% high, 35% middle, 36% low
- Social media – 17% high, 27% middle, 57% low
- Local TV – 10% high, 21% middle, 69% low
Social Marketing
Identifying and Reaching Target Audience is Social Marketers' Greatest Challenge
The respondents to Sprout Social's 2020 Index were asked what they considered social marketers' most significant challenge. They identified quite a few challenges, but the most frequent responses were:

- Identifying and reaching the target audience
- Measuring ROI
- Supporting overall business goals
- Publishing content
- Monitoring the competition
- Securing budget & resources for social
- Aligning social strategy with other parts of the business
- Demonstrating social's impact on other departments
- Creating engaging & innovative content
- Team bandwidth and time
LinkedIn Has a Potential Advertising Reach of 190 Million in the USA alone
The different social networks have flourished in varying countries. This is partly because of cultural differences and partially because some nations have banned specific social networks. We Are Social collated information about the potential reach of various social networks for advertising by country.
The advertising reach for Facebook across its three largest markets is:
- Facebook – India – 310 million, USA – 190 million, Indonesia – 140 million
Similar data for other platforms:
- Instagram – USA – 140 million, India – 120 million, Brazil – 95 million
- LinkedIn – USA – 170 million, India – 70 million, China – 60 million
- Snapchat – USA – 101.9 million, India – 49.8 million, France – 22.2 million
- Twitter – USA – 68.7 million, Japan – 51.9 million, India – 18.8 million
- Pinterest – USA – 97.2 million, Germany – 15.3 million, UK – 12.1 million
Social Media Ad Impressions Continue to Rise
There has been a clear upwards trajectory in the total number of ad impressions served via social media platforms over the last year. In each of the four quarters leading up to Q2 2020, the quarter-on-quarter percentage change was:

- Q2 2019 to Q3 2019: +3.0%
- Q3 2019 to Q4 2019: +5.8%
- Q4 2019 to Q1 2020: +10.1%
- Q1 2020 to Q2 2020: +4.2%
Reasons Brands Use Social Media
69% of Marketers Use Social Media for Brand Awareness
According to Sprout Social's 2020 Index, the primary goal of 69% of the marketers they surveyed was to increase brand awareness. Other popular purposes for social media marketing include:

- Increasing web traffic – 52%
- Growing the brand's audience – 46%
- Promoting content – 44%
- Increasing community engagement – 43%
Notably, only 40% of the survey recipients considered driving sales to be a primary purpose of social media marketing.
Factors That Influence a Marketer's Approach to Social
Respondents were asked what they considered important factors affecting their approach to social media marketing. The most critical factors they identified were:

- Performance to date – 59%
- Social goals and objectives – 57%
- Customer feedback – 52%
- Trending topics and interests – 45%
- Business goals and objectives – 36%
Clearly, many businesses analyze how they perform on social and are willing to make changes, if necessary, to improve their performance.
57% of Consumers Follow Brands to Learn About New Products or Services
Sprout Social then asked its respondents why they chose to follow brands with their social media accounts. The most common reasons were:
- To learn about new products or services – 57%
- To stay up-to-date on company news – 47%
- To learn about promotions or discounts – 40%
- To be entertained – 40%
- To be educated – 34%
- To connect with people who are similar to me – 32%
- To be inspired – 32%
- To communicate with the brand – 21%
- To connect with people who are different from me – 18%
49% of Consumers Unfollow Brands for Poor Customer Service

Conversely, consumers tend to unfollow brand accounts when they experience an inferior product or poor customer service. The main reasons that consumers unfollow brands on social media are:
- Poor quality of product or support – 49%
- Poor customer service – 49%
- Irrelevant content – 45%
- Too many ads from that brand – 45%
- Privacy concerns – 39%
- Negative press – 29%
- Corporate scandal – 26%
- Brands post too much – 24%
Ways Marketers Use Their Social Data
With the majority of firms being willing to adapt their social marketing to their performance to date, it is clear that many businesses collect and use social data related to their campaigns. Survey respondents were asked how they use this data.
Interestingly, the most popular use of social data was to try and understand a target audience. Clearly, brands believe that they will perform better on social if they truly understand the people with whom they are holding social conversations. The second most popular reason, developing creative content, ties in with this (as presumably, the firms are trying to produce creative content that will interest their target audience.
The most popular reasons canvassed were:
- Understand the target audience – 56%
- Develop creative content – 49%
- Assess campaign performance – 43%
- Foster connection with consumers – 39%
- Support another department – 33%
- Report results to manager and team – 31%
Consumers Following Brands
45% of Consumers Like and Follow Accounts Suggested in Their Feeds or Use Discovery Tools
Sprout Social asked its respondents how they found new accounts to like and follow. The most popular was taking notice of suggestions in their feed and/or using discovery tools (45%).

Other popular ways to find new accounts were:
- Recommendations from family/friends – 40%
- Brands that I admire and/or follow – 39%
- Accounts influencers I like mention – 35% (indicating the effectiveness of influencer marketing)
- Brands I shop with offline – 34%
- Word-of-mouth – 32%
- Hashtags – 25%
91% of Consumers Visit a Brand's Website or Application When They Follow Them on Social

Respondents were asked what they (as consumers) did when they followed brands on social. The results were overwhelmingly positive from a brand's perspective, showing a clear value to them of operating their social accounts properly.
The most common actions taken by consumers upon following brands on social are to:

- Visit the brand's website or application – 91%
- Buy from the brand – 89%
- Recommend that brand to a family or friend – 85%
- Choose that brand over a competitor – 84%
- Visit the brand's physical retail store – 84%
- Increase their spending with that brand – 75%
- Reach out for customer service or support – 74%
- Read that brand's blog or site content – 74%
- Engage with the brand on social media – 71%
That last point is particularly important. While nearly 7 in 10 people engage with brands on social media, many more interact with a brand in some other way due to its social actions. This suggests that brands shouldn't become too discouraged if they don't receive as much social interaction as they would like. They are probably sharing other less measurable interactions with consumers as a result of their social accounts.
59% of Consumers Message Brands on Social Media When They Have A Great Experience
The next question involves the reasons why consumers message brands on social media. In order of importance, the reasons are:

- A great experience – 59%
- Customer service issues – 37%
- Posts align with their beliefs – 23%
- Social connection – 23%
- Security breach or privacy issues – 21%
- Entertaining posts – 21%
- Product announcements – 19%
- Brand scandal – 15%
- Job posting – 12%
- Influencer posts or mentions – 9%
Businesses Following Brands
Nearly 37% of B2B Decisionmakers Discover New Brands Via Social Media
We Are Social included a section focusing on B2B decisionmakers. They asked them how they discovered new brands and services. There were fifteen different methods, with the most common being through conferences, trade shows, and events (45.8%).
37.6% of the respondents discovered new brands via video sites like YouTube, and 36.6% found them through social media.
Notably, only 34.0% discovered new brands through television ads, and 28.1% via radio ads.
Only 30% of Respondents Consider Social Media Their Most Influential Information Source

Despite many B2B decisionmakers using social media to find new products or services, they consider it far from being the most influential for their decision-making. In fact, social media is the 10th (and last) placed source the respondents volunteered. And video sites, like YouTube, are only just ahead of social media.
The channels B2B decisionmakers consider most influential for researching new products and services are:
- Recommendations from experts in their network
- User reviews
- Recommendations from industry analysts
- Conferences, trade shows, and events
- Supplier websites
- Recommendations from colleagues and friends
- Supplier calls, demos, and trials
- Search engine results
- Video sites
- Social media
YouTube and Facebook are the Most Common Social Media Platforms Used for B2B Research
Combining social media, video sites, and messaging apps, the preferred social media platforms for B2B research, according to We Are Social's respondents, are:
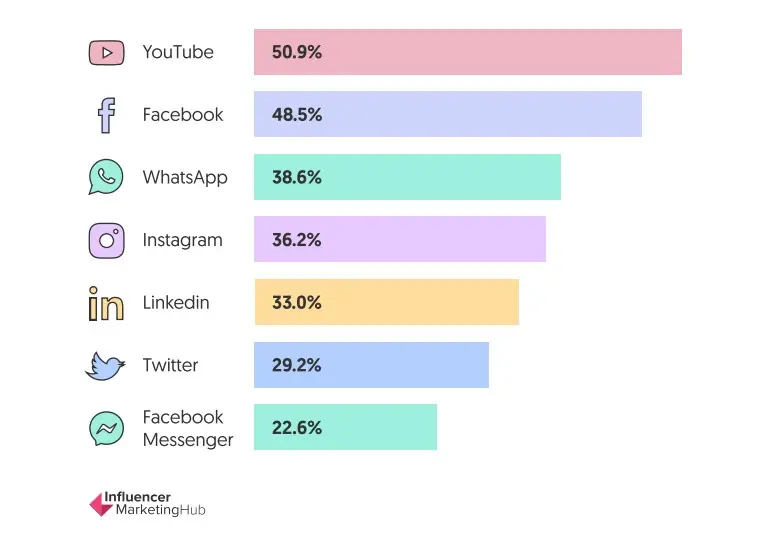
- YouTube – 50.9%
- Facebook – 48.5%
- WhatsApp – 38.6%
- Instagram – 36.2%
- LinkedIn – 33.0%
- Twitter – 29.2%
- Facebook Messenger – 22.6%
Main Reason B2B Companies Use Social Media is to Communicate Directly With Customers and for General Updates
B2B respondents suggested a range of reasons for why their company uses social media. The most common cited were:
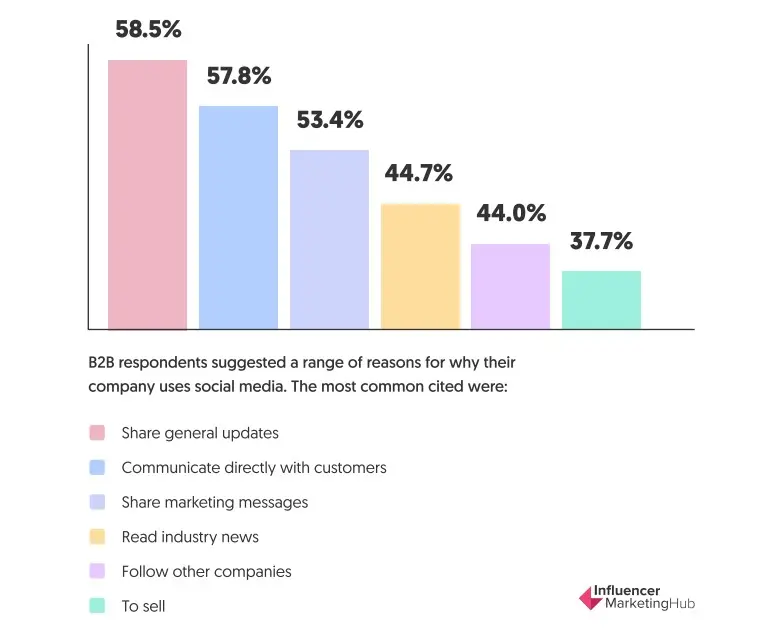
- Share general updates – 58.5%
- Communicate directly with customers – 57.8%
- Share marketing messages – 53.4%
- Read industry news – 44.7%
- Follow other companies – 44.0%
- To sell – 37.7%
It is notable that selling is so far down the list. Most businesses clearly use social media more for brand awareness rather than for direct selling.
Social Media Content
Images and Videos Are Now the Preferred Content
The respondents to Sprout Social's survey showed a clear preference for visual social media content. This is probably unsurprising and follows a general move in that direction over recent years, as bandwidths have improved, and mobile usage has increased. These consumers ranked the types of content they preferred to engage with as follows:
- Images – 68%
- Videos – 50%
- Text-based posts – 30%
- Stories – 26%
- Polls – 26%
- Live Video – 22%
- GIFs – 17%
- URLs / links to brand content – 16%
- Q&As or AMAs – 11%
- UGS – 10%
90% of Global Internet Users Watch Online Videos

As we saw above, video is extremely important to online users now. While this benchmark doesn't explicitly reference social media, it provides evidence of the types of content people like online, which clearly impacts social marketing.
When asked about the types of content they watch each month, respondents (global internet users aged 16 to 64) replied:
- Watch online videos – 90%
- Watch vlogs – 53%
- Listen to music streaming services – 73%
- Listen to online radio stations – 47%
- Listen to podcasts – 43%
Social Media Engagement
Highest Content Engagement With Brands in the Consumer Goods and Retail Sectors
Sprout Social took a close look at average engagement by industry. While their data was complex, there are a few overall observations.
Firstly, the level of inbound engagement per day varied significantly by industry. Brands in the media & entertainment sector average 1,123 average inbound engagements per day. On the other hand, it is obviously harder to engender active engagement if you're a real estate firm, who only average 41 inbound engagements per day.
While these figures might be affected by the average number of posts per day (media and entertainment firms probably make considerably more posts than real estate firms), there are still noticeable variations in the average engagement per post. Consumer goods firms receive 38 engagements per post on average, closely followed by retailers with 36, and perhaps surprisingly, legal firms with 30 average engagements per post. Once again, real estate companies take bottom place with a mere six engagements per post, although educational institutions have a similarly low engagement rate. Perhaps this reflects the fact that young people are more socially active on social media than their elders, and they're unlikely to have much interest in buying property or following their school.
Legal and Real Estate Firms Have the Highest Response Rate
Perhaps due to their comparative lack of social interaction, real estate and legal firms have the highest average response rates – 29%. In third place, on 28%, is Finance & Banking (which also suffers from low average engagement). However, education doesn't follow the same trend as they match their low average engagement rate with a comparatively low social response rate (18%) – perhaps most schools don't take much notice of conversations on their social accounts.
However, none of these sectors come anywhere close to the Sports sector, which only responds to 7% of their social mentions. Perhaps these accounts receive large quantities of communication from fans vainly hoping to connect with their favorite sports stars.
Nearly a Quarter of B2B Decisionmakers Prefer to Contact Suppliers Via Social Media
This statistic is very much an indication of how things have changed in recent years. Clearly, the days of getting on the phone to talk to a sales rep are disappearing. We Are Social asked B2B decisionmakers about which channels they preferred to use when contacting a supplier they were interested in buying from. Their preferences were:
- Email them – 51.8%
- Call a sales rep – 39.1%
- Fill out a contact form on their website – 27.7%
- Speak to them at a trade event – 27.5%
- Contact them via social media – 23.2%
- Other – 3.9%
- Buy without speaking to anyone – 2.2%
Facebook Page Fans Average 0.18% Average Post Engagements
We Are Social broke down a series of Facebook post engagement benchmarks. They compared Facebook page engagements to the total number of page fans. The average total post engagements per page fans on all post types is 0.18%
When you break this statistic down by post types, there were some quite noticeable differences:
- Photo posts – 0.21%
- Video posts – 0.26%
- Link posts – 0.05%
- Status posts – 0.21%
This confirms the popularity of video and image posts. There is little point in posting a link post on a Facebook page if you don't include an image or video to go with it.
The Facebook post engagement rate also depends on the size of your Facebook audience. The overall average of 0.18% masks the fact that pages with fewer fans receive considerably better average engagement than larger pages. The average Facebook page post engagement rate for pages with varying fan numbers is:
- Pages with fewer than 10,000 fans – 0.52%
- Pages with 10,000 – 100,000 fans – 0.28%
- Pages with more than 100,000 fans – 0.10%
This should be no surprise, as it mirrors the pattern of engagement across social media as a whole.
Instagram's Best Engagement Comes from Regular Photo Posts
One of the more surprising benchmarks is that the average engagement rate for photo posts on Instagram is higher than for video or carousel posts.
The average engagement rate for all post types is 0.96%. If you separate this statistic by post type:

- Photo posts – 1.03%
- Video posts – 0.75%
- Carousel posts – 0.86%
Instagram shows the same pattern as its big brother in terms of engagement for business accounts with varying follower numbers:
- Business accounts with fewer than 10,000 followers – 1.55%
- Business accounts with 10,000 – 100,000 followers – 0.99%
- Business accounts with more than 100,000 followers – 0.62%
Protecting Data Very Important to Social Users When Deciding Whether to Engage With Ads or Sponsored Content
When Insider Intelligence asked what most engages US social media users' decision to engage with ads or sponsored content on social media platforms, the most popular responses were:
- The platform protects my privacy and data – 79%
- The platform shows me deceptive content – 69%
- The platform makes me feel safe to participate and post – 69%
- The platform shows me annoying ads – 55%
- The platform shows me relevant ads – 30%
These are an intriguing mix of positive and negative reasons.
The Impact of COVID-19 on Social Media Usage
COVID-19 Increases Social Media Usage
eMarketer has released details of the Harris Poll, which looks at the percentage of respondents who use social media. They conducted the poll between late March and early May 2020. They found that between 46% and 51% of US adults claimed they were using social media more since the outbreak began, depending on the week.
More Than 60% of US Social Users Expected to Increase Their YouTube and Facebook Usage During COVID-19 Lockdown

Statista drew similar conclusions regarding social media lockdown to eMarketer. In March 2020, they asked US social users whether they expected to increase their social media usage if confined at home due to the virus. Users of YouTube and Facebook thought it particularly likely that they would increase the use of their social platforms. Each of the figures below represents the percentage of respondents on that platform who believed they would increase their use of that platform if locked down:
- YouTube – 63.7%
- Facebook – 62.3%
- Instagram – 43.1%
- Twitter – 34.4%
- Pinterest – 32.5%
TikTok Has Now Been Downloaded More Than 2 Billion Times
One social app that definitely benefited from the additional free time people had during lockdown was TikTok. It set the record for most downloads ever in a quarter in Q1 2020, with more than 315 million installs. According to SensorTower it has now had more than 2 billion downloads in total.
Facebook Groups Have Played a Big Role in Providing Support During COVID
In August 2020, Facebook commissioned a survey of people who are currently members of online and in-person communities to learn more about the communities. The survey found that online communities have taken on new roles, especially during the pandemic.
91% of respondents said they had given some form of support to others through a group or community during the pandemic. 86% have said they received some form of help from others. According to Facebook data, over half of Facebook users are members of five or more active Groups. 77% of the survey respondents observed that the most important group they are part of now operates online.
Prediction That There Will be 2.77 Billion Messaging App Users in 2020
The impact of Coronavirus has led eMarketer to increase their predicted 2020 forecast for monthly global mobile messaging app users from 2.70 billion to 2.77 billion. They only see a slight increase in US usage, despite the pandemic, because of the current widespread use of regular SMS and voice calling. They believe that this has held back the adoption of OTT messaging and calling during the pandemic. Apple's built-in FaceTime feature and Zoom have been more popular than standalone messaging apps.
External Sources
Sprout Social Index Edition XVI
We Are Social – Digital in 2020