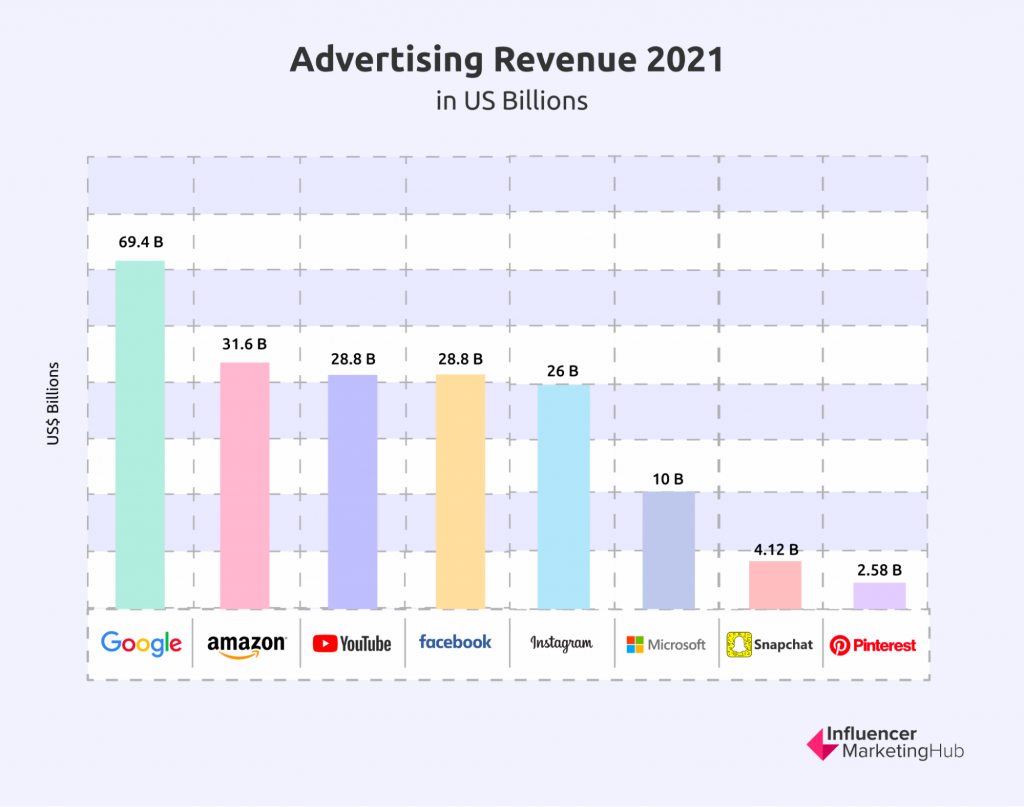
Amazon isn’t just an ecommerce giant—it’s also an advertising behemoth. Now, Amazon isn’t known for disclosing its ad revenues. However, just last week, Amazon revealed its digital advertising revenue numbers for the first time, and it amounts to USD 31.6 billion.
With the way things are going, it’s expected that figures for net digital ad revenues alone will reach a projected value of USD 39.45 billion by 2023.
In its quarterly reports, Amazon has an “Other” category, under which it lumps its other services, including advertising and analytics. In the 2nd quarter of 2021, this category showed an 87% year-over-year growth, earning a total revenue of more than $7.9 billion, with most of it generated from Amazon’s ad sales. The ad revenue alone had a 66% YoY increase during the 4th quarter of 2020.
How does Amazon’s advertising revenue compare to other online staples like YouTube, Twitter, and Snapchat? Why is Amazon’s ad business so powerful? Let’s take an in-depth look at Amazon’s ad business and how it has grown in recent years. We’ll also look at the numbers that define its growth.
Amazon Ad Revenue Stats:
How Big is Amazon’s Ad Revenue?
In the 3rd quarter of 2021, Amazon’s ad revenue surpassed the $30 billion mark, making it larger than YouTube, Snapchat, and Twitter. Furthermore, it’s expected to start taking market share from two major advertising entities: Google and Facebook.
To give you a clearer picture of the sheer size of Amazon’s advertising arm, let’s take a look at some figures:
- Amazon’s 2021 ad revenue is bigger than YouTube’s reported revenue for the same year, which amounted to $28.8 billion.
- It exceeded Microsoft’s 2021 ad revenue, which was just over $10 billion.
- While still dwarfed by Google Services’ $69.4 billion revenue (2021 4th quarter), Amazon’s ad revenue still proves to be larger than the combined 2021 ad revenue of Microsoft, Snapchat, and Pinterest. In fact, the ecommerce giant’s ad revenue can be compared to the ad revenue of the global newspaper industry.
- The retail giant’s revenue for the same period is also bigger than Pinterest’s and Snapchat’s, which is at $846.7 million and $1.3 billion, respectively.
- In the 4th quarter of 2021, Amazon’s ad business raked in $9.7 billion. That’s a 33% YoY growth.
- In 2020, LinkedIn’s and Twitter’s annual earnings from advertising were at $3 billion each. Snapchat’s was approximately $2.5 billion, while Pinterest’s revenue was $1.7 billion. Despite advertising budgets being cut in the midst of the 2020 pandemic, Amazon’s ad revenue still showed an impressive 23.5% YoY growth.
- In 2021, Snap’s total ad revenue was at $4.12 billion, while Pinterest’s was only $2.58 billion. Amazon’s ad revenue increased by more than $3 billion in the 2nd quarter of 2021 alone. Note that during this same period, Amazon’s quarterly total was estimated to exceed $7 billion. That’s more than what all these other companies make in one year from ad revenues.
- It’s estimated that Amazon’s advertising unit is 2.4 times larger than those of Snapchat, Twitter, Roku, and Pinterest combined. It’s also growing 1.7 times faster compared to its contemporaries.
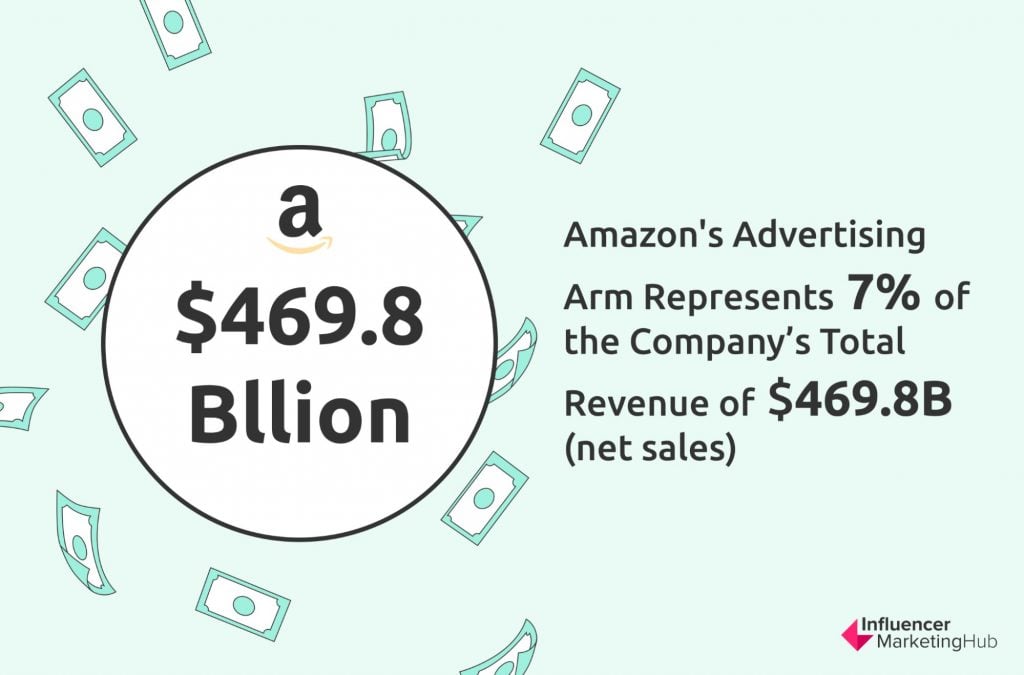
- Despite the monumental 32% growth of its 4th quarter sales, Amazon’s advertising arm is still considered small by Amazon standards, given that it only represents 7% of the company’s total revenue in the 4th quarter of 2021. However, it’s worth noting that Amazon’s ad business generates more revenue for the company compared to its physical stores and its own subscription services. Amazon’s subscription business only raked in $8.1 billion.
Factors That Shape the Growth of Amazon’s Ad Business
But why is Amazon’s ad business booming?
In recent years, Amazon’s share of the digital ad space in the US alone has grown from 7.8% in 2019 to 10.3% in 2020.
In 2019, it integrated several of its services—the Amazon Media Group, Amazon Marketing Services, and the Amazon Advertising Platform—into one category known as Amazon Advertising. Since the merger, Amazon’s ad business grew steadily year over year. In 2018, the company made $10 billion. Fast forward to 2020, and Amazon Advertising made approximately $19 billion in ad revenue.
In 2021, Amazon, along with Google and Meta (formerly Facebook), accounted for over 74% of global ad spending, enabling it to earn a sizable chunk of the advertising market. Compared to the 39% of global ad spend in 2020, last year’s share is a huge leap.
There are several factors that have impacted Amazon’s inevitable transformation into a colossal advertising entity. These include industry trends, consumer habits, and its continued dominance in the ecommerce industry.
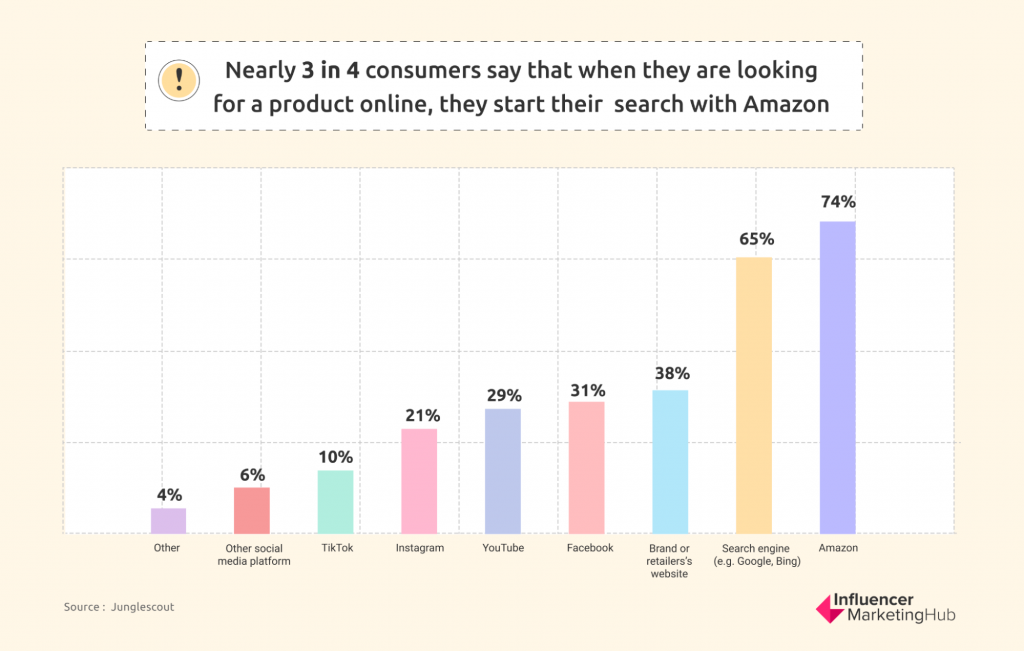
74% of consumers use Amazon as a starting point for their buyer’s journey, visiting the site to conduct their research. Furthermore, 56% of consumers in the US alone prefer to shop at Amazon, if placed in a situation where they would only be able to purchase products from one store.
Other factors, such as Amazon’s scale and technology, further contribute to the growth of its advertising arm.
Unlike Meta, which was severely affected by Apple’s regulatory changes on in-app tracking, Amazon remained unfazed. This is because Amazon uses its own sales data. This, in turn, makes it an ideal platform for targeted ads, prompting companies to advertise on the platform even if they’re not directly selling goods or services on Amazon.
How Amazon Leverages Ads
Advertising is a crucial part of the Amazon business model. In recent years, it has surged in popularity and importance among brands, marketers, agencies, and other stakeholders. This is partly due to the business’s impressive search advertising capabilities.
The steady growth of ecommerce over the past decade has brought with it changes to consumer shopping behavior. During this period, Amazon catapulted itself to the forefront of online shopping by positioning itself as a store that offers almost everything you need.
What makes Amazon advertising so special, and how has the business become so effective that it has enabled the company to rake in more than $30 billion in ad revenues?
Because Amazon marketed itself as a store that potentially has everything, more consumers are now using the platform to conduct product searches. Instead of using Google, they’re going directly to Amazon to search for whatever it is they’re looking for. Ad spend on Amazon also dwarfs ad spend on other ecommerce platforms such as Walmart and eBay.
Moreover, Amazon’s ecommerce platform isn’t the only source of ad revenue for the company. Its subsidiaries (Prime Video) and proprietary products (streaming hardware) also contribute to the company’s overall ad revenues.
Marketers are increasingly turning their attention and allocating ad budgets to Amazon because of three main reasons:
- It has an audience of engaged consumers who are ready to make a purchase.
Consumers on Amazon have surpassed the initial stages (Awareness to Evaluation) of their buyer’s journey and are ready to buy. This enables advertisers to reach out to customers at the exact point when they’re ready to make a purchase.
- The platform is capable of showing the right products to the right people.
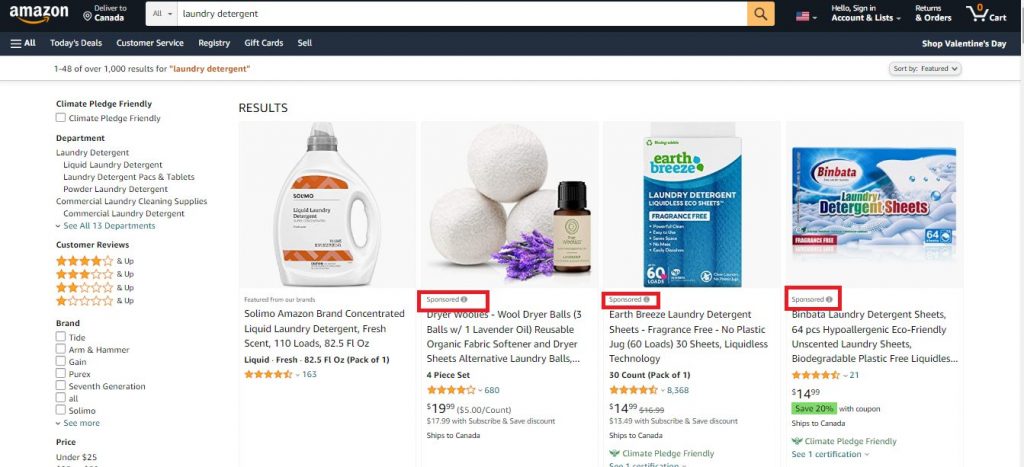
Amazon’s ads are highly targeted. If you’ve visited Amazon and did some product searches, you may have come across a row of results that mostly feature sponsored products. This is what marketers and brands are paying for: visibility.
Amazon also leverages its shopper data to enable brands and marketers to reach out to their target audience with relevant and optimized ads.
Source: junglescout.com
- Ad performance can be measured on Amazon.
Amazon’s Attribution feature enables marketers to oversee ad performance. By providing access to sophisticated marketing insights, Amazon sets itself apart from other platforms that also leverage search marketing. This feature shows which ads drive sales, and it also helps you determine your return on ad spend (RoAS) and the revenue generated.
In addition to the attribution feature, Amazon offers sellers several options for monitoring their ad performance. For example, the platform lets them access custom dashboards and competitor insights.
Brands want to leverage automation features to gain insights on their target audience. Given Amazon’s reputation for offering in-depth advertising insights and powerful advertising solutions, many sellers are eager to utilize these tools to improve their ads.
75% of sellers on Amazon use some type of PPC advertising (Sponsored Products, Sponsored Brands, or Sponsored Display). These figures can vary, depending on seller type. For example, 79% first-party sellers on Amazon use some form of PPC advertising, while only 71% of third-party sellers (or sellers that use the Amazon Seller Central to market their products) use the same method.
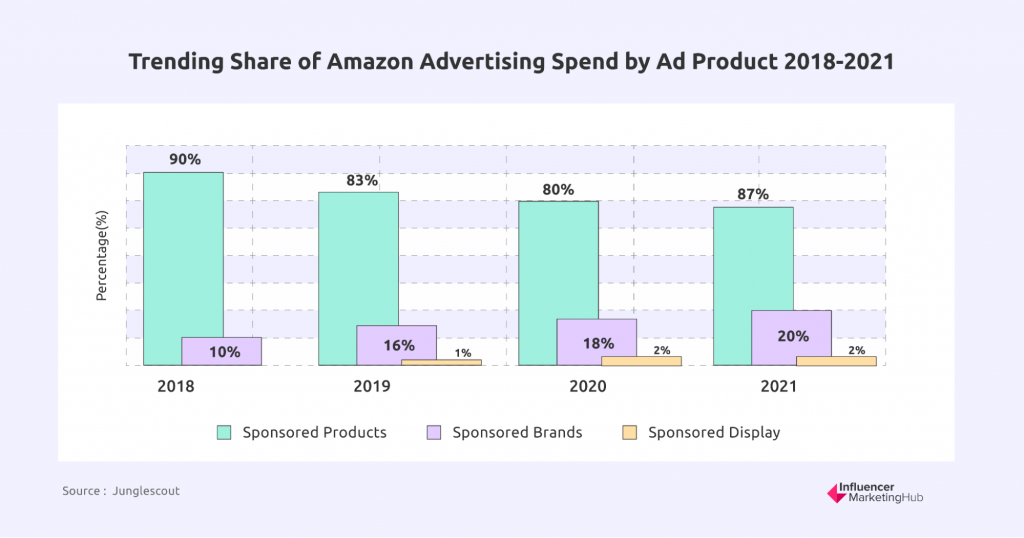
Amazon’s new ad products—Sponsored Brand and Sponsored Display—have grown in popularity since they were first introduced. In 2018, 90% of ad spend on Amazon was for Sponsored Products, while only 10% Sponsored Brands. In 2019, 83% of ad spend was attributed to Sponsored Products. 16% went to Sponsored Brands ads, while only 1% went to Sponsored Display ads.
In 2020 and 2021, there was a slight decrease in ad spend on Sponsored Products (80% in 2020 and down to 77% in 2021), while spending on Sponsored Brands ad products increased by 18% and 20% respectively. Advertising spend on Sponsored Display ad products remained at 2% from 2020 to 2021.
Advertising is an organic part of Amazon. With the continued growth and popularity of ecommerce, there’s a huge potential for Amazon’s advertising business to become much bigger.
Which Ad Types are Most Profitable?
Which type of ads do advertisers spend the most money on?
According to a Jungle Scout report, advertisers are spending 26% of their total ad spend on loose-match ad types. This is followed by Substitutes (21%) and ASIN ad targeting (21%).
Why all the attention on loose-match targeting? Compared to close-match products and other ad targeting types, loose-match ad types have the lowest cost per click rates. This enables advertisers to spend more on ads, even if this targeting type doesn’t always guarantee a good ROI.
The Growth of Digital Advertising and the Future of Amazon’s Ad Business
Amazon is setting itself up for greater growth in the coming years. In 2019, Amazon’s global ad market share was pegged at 3.8%. It showed significant growth in 2020, with an ad share of 5.2%. It’s estimated that by 2023, it could potentially have an ad market share of 7.1%.
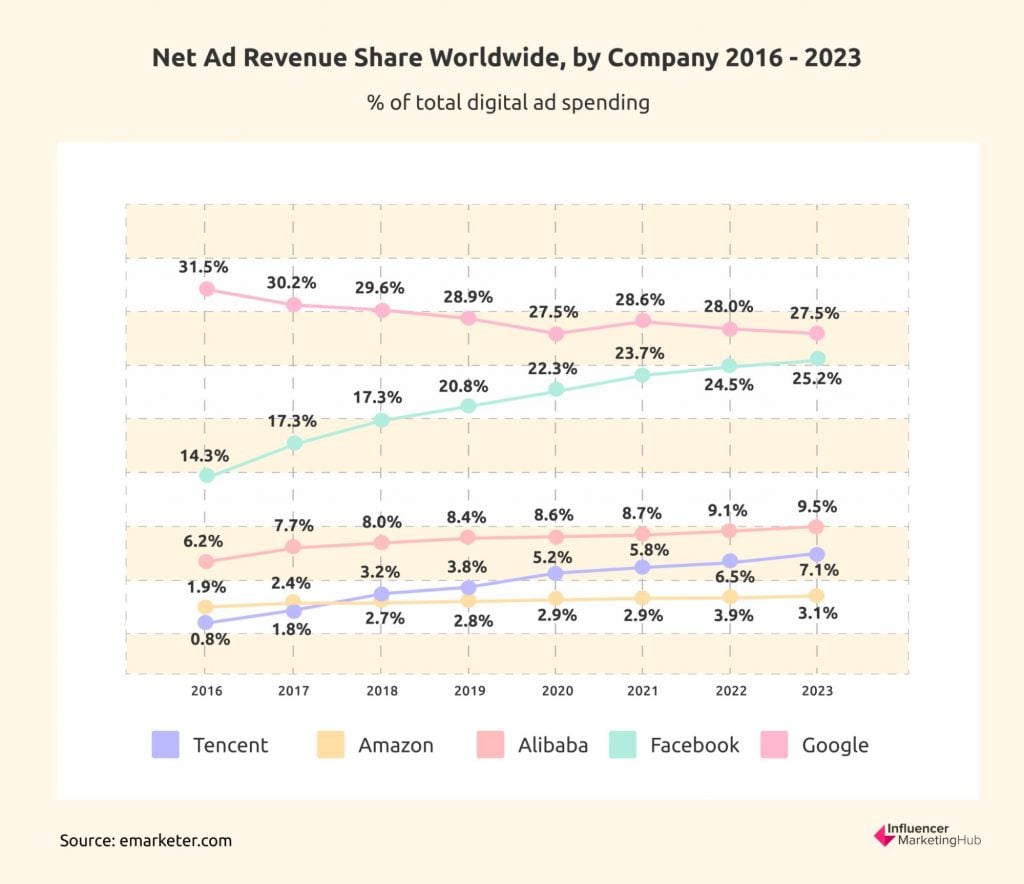
Given that Amazon already dominates the US ecommerce market, projections indicate that Amazon will most likely control a majority of the very lucrative ecommerce ad market.
Amazon revealing its 2021 ad revenue came as a surprise. However, it may be considered as timely, given Apple’s crackdown on third-party cookies. This event may serve as a turning point that serves to highlight the value of Amazon’s ability to collect first-party customer data.
Frequently Asked Questions
Which ad products do consumers prefer to see?
40% of consumers find organic listings to be more appealing. This is followed by sponsored product ads that appear in search results (22%), sponsored display ads (14%), sponsored product ads that are found on product listings (14%), and sponsored brand ads (10%).
How many visits did Amazon clock in last year?
In June 2021, Amazon had around 2.45 billion monthly visits in the US alone. Worldwide, it had 2.7 billion visits from mobile and desktop sources.
What is one of the main challenges of brands or sellers on Amazon?
One common pain point that brands seem to have when transitioning to an online marketplace like Amazon is how to present their products on the platform. Many small- and medium-sized businesses aren’t that well-versed when it comes to targeted advertising. Some need help with creating ad or marketing campaigns.
Amazon undeniably has a large influence on shoppers, particularly consumers within the US. It has an array of tools and data points that, when utilized properly, can help promote growth for enterprises, regardless of their scale. For example, SMBs can learn about targeted ads on Amazon and use that method to optimize their sales.


