Many businesses find that behavior analytics are crucial to success in the marketplace. Behavior analytics involves collecting data about how your users (and potential users) behave and interact with your product and website. You can use this information to improve your behavioral targeting, better focus your marketing, and increase your engagement and conversion rates.
For behavioral targeting, you need accurate, relevant qualitative and quantitative data to understand how people act on your website. You are going to want to be able to answer such questions as:
- What interests your users, and what don't they care about?
- What are your users looking for, and what can't they find?
- Are there any parts of your website that appear to confuse or lose your visitors?
- What do your visitors typically do before leaving your website?
- How far do your visitors usually travel through the conversion funnel?
You might wonder where you obtain this information. You are unlikely to gain much insight from looking at the backend of your site. You will gain more from using Google Analytics, which is in the process of upgrading from Universal Analytics to Google Analytics 4 at the moment. However, this will only give you limited information, particularly if you're in eCommerce and want more in-depth data to assist with your decision-making. However, if you're prepared to pay a subscription to gather in-depth intelligence, you will find many other specialist behavior analytics tools/software. We examine a selection of them here.
Behavioral Analytics Tools/Software:
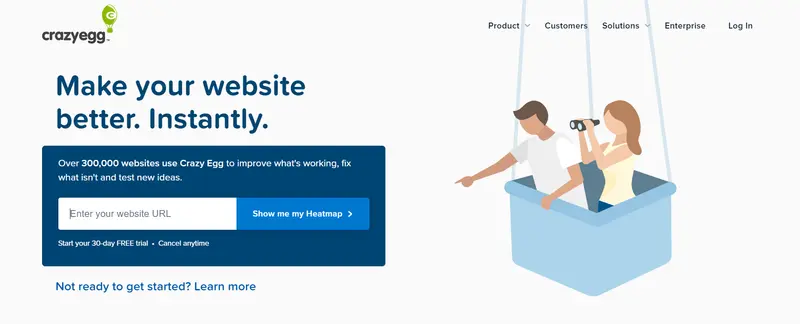
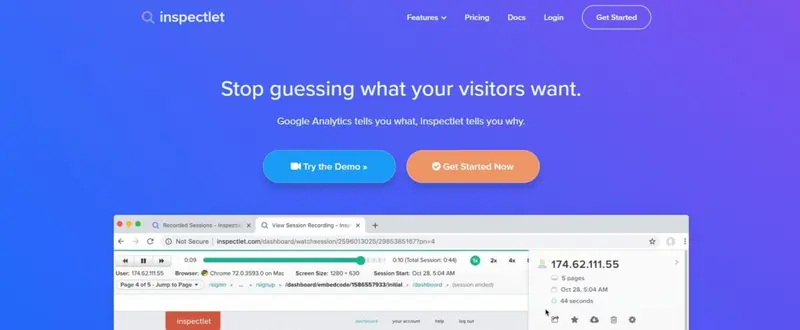
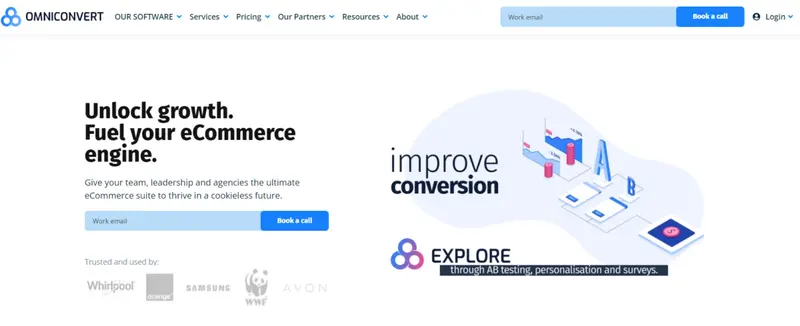
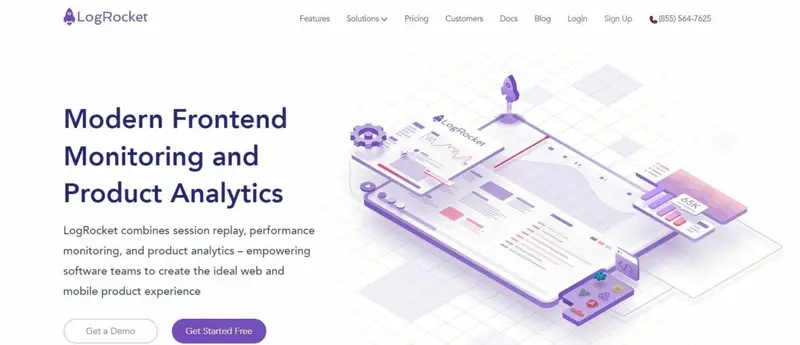
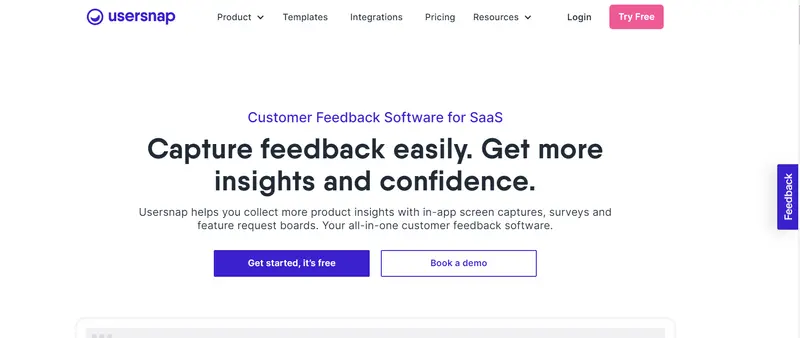
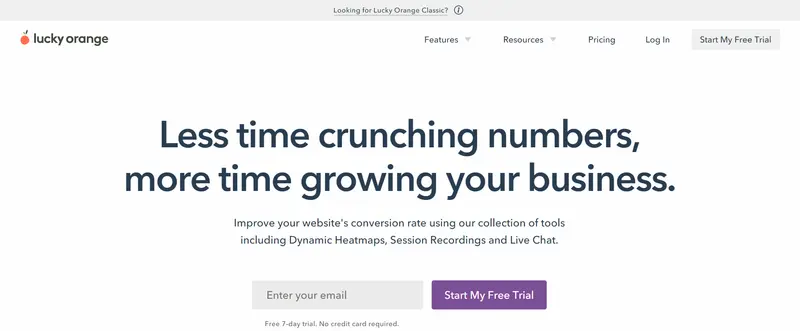
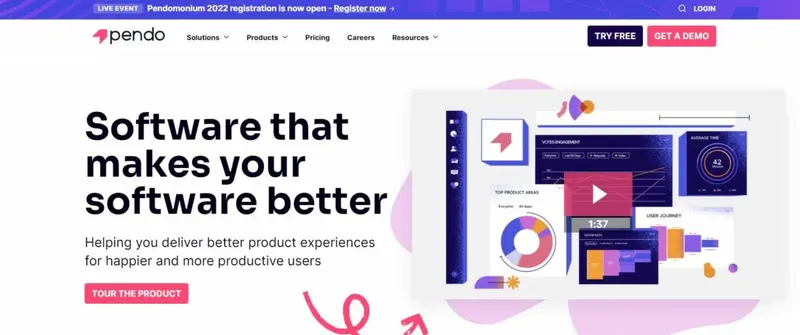
You can use Crazy Egg to determine what is working on your website and discover the areas you need to improve. It covers five main areas of behavior analytics: heatmaps, recordings, A/B testing, traffic analysis, error tracking, and surveys. It can be particularly valuable for eCommerce sites using the software to ensure their online store is optimized for purchases. The key to growing your eCommerce business is understanding the path to purchase. Crazy Egg’s Heatmap shows you the attention hotspots on your product pages. You can ally this with Scrollmap to ensure your ‘buy now’ buttons are in the right place. With Crazy Egg’s website recordings, you can identify navigation obstacles on the path to purchase and find out why shoppers are abandoning their carts. In addition, you can use their Recordings Filter to find specific recordings on your pricing page, particular features, signup flows, or any other section of your site. Their A/B Testing Page Editor gives you the power to change elements like images, copy, and CTAs on your site without needing a developer. For example, you can pick a goal like “Sell More Products” based on a URL, form submission, or a clicked link/button. As soon as Crazy Egg detects a winning variant, they will send more traffic to that winner automatically. Hotjar is a multipurpose analytics tool to understand how users behave on your site, what they need, and how they feel. It includes tools relating to heatmaps, recordings, feedback, and surveys. In addition, you can connect Hotjar with thousands of popular apps, so you can automate your work and have more time for what matters most. Hotjar Heatmaps visually represent where users click, move, and scroll on your site. See what elements users are drawn toward and the parts they completely miss. In addition, heatmaps will show you whether webpages capture attention or get ignored. Recordings are playbacks of users scrolling, moving, u-turning, and page-clicking on your site. You can use them for mapping the complete user journey and spot problems, pain points, and bugs. With Feedback, Hotjar helps you understand what users really think about your site. You can hear from users as they experience your site. Users can highlight parts of the page they like or hate to help you spot areas for improvement. You can then watch a user’s recording to see what went wrong. You can also bring the voice of the customer to your decision-making with on-site and external surveys. Capture in-the-moment feedback by launching your surveys the way you like using a popup or sending users a link. Inspectlet sums up a significant difference between the free Google Analytics and itself. Google Analytics tells you what, while Inspectlet tells you why. It includes session recording so you can replay everything your visitors do on your site. Watch individual visitor behavior on your site; see every mouse movement, scroll, click, and keypress. Use it to determine exactly what users are looking for and how they use your site. Understand their mindset and increase your conversion rate. Perhaps most importantly, you can use Inspectlet to discover where visitors are getting confused on your site and what’s getting their attention. Inspectlet includes a funnel analysis tool that shows you recordings of people that added something to their cart but never proceeded to checkout. Alternatively, you can use Conversion Funnels to define a series of pages that lead towards a goal (like a signup or a purchase) and then watch session recordings of visitors that dropped off on a certain step towards the goal. The software also includes heat mapping, so you can see where your visitors are looking and what parts of the site they’re reading by visualizing their mouse movements. Scroll heatmaps show you how far visitors are scrolling down on your site’s pages. Find out how many people actually make it to the middle or bottom of the page. CleverTap helps companies understand, segment, and engage users in real-time using context and powerful artificial intelligence (AI)/machine learning (ML) models. The full CleverTap product is more than just behavior analytic software, however. It covers analytics and insights, automated user segmentation, omnichannel engagement, journey orchestration, campaign optimization, and lifecycle optimization. Their innovative, all-in-one platform combines in-depth analytics, segmentation, and engagement tools so that companies can build valuable, long-term relationships with their customers. The platform’s analytics module includes all the tools you need to spot patterns and trends. Easily track and compare user groups to visualize retention, understand feature stickiness, identify your best acquisition campaigns, and more. You can track user flows to pinpoint your app’s friction points and increase conversions. Uncover underlying patterns in user behavior, compare trends across user groups, and set up advanced filters to zero in on high-value segments. Omniconvert is a growth enabler for serious eCommerce companies looking to become customer-centric. It includes two main tools: Explore, for companies who want to grow their business with next-generation CRO tools, and Reveal, which helps you discover data relating to your customer analytics, customer lifetime value, and customer experience. Omniconvert also has a customer survey platform. Reveal is the tool that focuses most on behavior analytics. You can use it to increase your number of loyal customers, improve Customer Lifetime Value, and maximize profits with automated RFM segmentation and actionable insights for your eCommerce business. In addition, it includes predictive insights to retain and nurture your most profitable customers. Omniconvert’s Real makes complex eCommerce data easy to understand and visualize. It gives you quick access to your historical and predictive KPIs and automated insights about what you can do to improve your Customer Value Optimization strategy. In addition, you can use pre- and post-acquisition NPS surveys to find how satisfied your customers are and use their feedback to make customer-centric adjustments to product variety, improving the customer experience at all levels. LogRocket combines session replay, performance monitoring, and product analytics. Your software teams can use LogRocket to fix issues, increase conversions, and drive product engagement across web and mobile apps. It allows you to reproduce every user session with a pixel-perfect replay. You can use it to make better product decisions by watching real users interact with your web or mobile app. One practical application for marketers is LogRocket’s product analytics. Create custom metrics that track conversions, user flows, and event volumes. You can build custom funnels, time series charts, tables, and more. Find trends and monitor your application at a glance. You can even break down every data point to the individual user and uncover attributes and behaviors that drive visitors to convert or become power users. You can proactively address issues in your web or mobile apps. For example, LogRocket lets you send alerts via email, Slack, PagerDuty, or webhook whenever a metric exceeds or drops below a chosen threshold. Usersnap helps you collect product insights with in-app screen captures, surveys, and feature request boards. It is a single platform to manage all your team and customer feedback. The platform makes it simple to capture videos and screenshots. In addition, users can draw and pin comments directly on their screens with the in-app widget. Furthermore, Usersnap automatically attaches the technical context, such as browser info, URL, and Javascript errors. You can launch CSAT, NPS, polls, and thumbs up/down surveys by user events, URL paths, or time on the page. It is simple to follow up with qualitative questions to gain insights on how you can create a memorable customer experience. Build single or multi-question surveys, target relevant users and track their responses. Improve your website’s conversion rate using Lucky Orange’s collection of tools. These include Dynamic Heatmaps, Session Recordings, Live Chat, Conversion Funnels, Visitor Profiles, Form Analytics, Surveys, Announcements, and the ability to build unlimited dashboards to follow key metrics for your marketing campaigns. Lucky Orange Dynamic Heatmaps helps you see which parts of a page drive conversions and which get in people’s way. You can study clicks and scrolls around forms, pop ups, and menus, diving deep into each page element’s performance. You can use Lucky Orange Session Recordings to watch a visitor navigate your site. Filter Session Recordings by visitor data segments. Track interaction with any element on your site. Lucky Orange Conversion Funnels helps you see where people abandon the conversion journey. Track the conversion touchpoints that matter most. For example, see which page causes the most visitors to leave from one step to the next. You can even track which day of the week sees the most visitors completing a funnel. FullStory is a Digital Experience Intelligence (DXI) platform that combines quantitative and qualitative data for comprehensive understanding to perfect your digital experience. It combines rich analytics, robust session detail, and collaboration tools to help you answer questions, understand issues, and uncover opportunities. FullStory’s DXI platform delivers a complete, retroactive view of how people interact with your site or app. It automatically logs every aspect of your users’ interactions across all visits. A brief snippet of code logs every scroll, swipe, click, pageview, and form fill, and no technical resources are required. You can access automatically indexed, fully retroactive, and instrumentation-free data to get insight into all digital interactions to drive confident decision-making. Filter your users and sessions based on any path or action they could take on your site. The software includes heat maps, click maps, and scroll maps, to show what gets your visitors’ attention, where they go, what they click, and more. Create and measure your business’s most important conversion funnels based on the extensive searchable data in FullStory. When a custom segment includes two or more events, FullStory automatically generates a funnel visualization showing how many users complete each action. Pendo is a comprehensive product experience platform. It provides all the insights you need to understand what users are doing across their product journey. Pendo offers three products – Engage, Feedback, and Adopt, and a range of plan levels for each. One of Pendo’s use cases is feedback collection. It makes it easy for you to collect and digest feedback. It gives you a direct line to the customer’s voice and allows users to provide feedback quickly at any time. Pendo is also excellent for product engagement. It will tell you which features customers embrace — and which they ignore. It can also increase your awareness of valuable but underused features. Finally, you can set retention goals to see which features promote stickiness. Mouseflow helps you discover what your users are doing, what they need, and what you need to do to convert them. It includes tools like Session Replay, heatmaps, funnel analysis, forms, and more. With Session Replay, you can watch user sessions to learn what helps and hurts. The moment you click ‘record,’ Mouseflow’s session recording tool begins tracking your users anonymously. In addition, Mouseflow’s Friction Score highlights frustrated users so you can spend time optimizing what matters. Mouseflow’s website heatmap tool records 100% of your traffic by default. It records every page — so you can retroactively analyze user behavior (for 3-12 months) without requiring manual setup. The heatmap software incorporates six tools: Click, Scroll, Attention, Movement, Geo, and Live. The conversion funnel optimization tool shows you why visitors leave using funnel analytics. You can optimize your website’s user funnel and find the most profitable path. Measure every step of the on-site customer journey — and watch actual recordings. Input your website funnel URLs, and Mouseflow shows conversion rates at each stage. Compare journeys to find the most profitable path, channel, referrer, and more.1. Crazy Egg
2. Hotjar
3. Inspectlet
4. CleverTap
5. Omniconvert
6. LogRocket
7. Usersnap
8. Lucky Orange
9. FullStory
10. Pendo
11. Mouseflow
Frequently Asked Questions
What is a behavioral analytics tool?
Marketing and sales teams use behavioral analytics to build a successful strategy. The marketing team uses behavioral data to create successful campaigns to help the sales team prove a return on investment (ROI). Behavioral analytics tools help build a more qualified funnel.
What are analytics tools?
Business analytics tools are software that help pull data from one or more business systems and combine it into one platform. The data can then be reviewed and analyzed.
What is the best analytic tool?
These are the best and most powerful behavioral analytic tools:
Crazy Egg
Hotjar
Inspectlet
CleverTap
Omniconvert
LogRocket
Usersnap
Lucky Orange
FullStory
Pendo
Mouseflow
What is behavioral data platform?
Behavioral data refers to the interactions with customers, partners, applications and systems to form a clear picture of the business.

