Digital native brands, the likes of Bonobos, Warby Parker and Casper, contributed to the growth of ‘Direct to Consumer’ as a business strategy. They used social media, websites and apps to manage their consumer engagement and overall customer experience while also gaining control over the product, marketing, and customer acquisition costs by cutting out intermediaries. DTC as a strategy has since been iterated, evolved, innovated, and has now come to mean both a business model and a channel strategy.
DTC is no longer restricted to digital-first or digital native brands. In the last five years, between 2016 and 2021, at least 15 DTC companies have gone public, and not all of them remained completely digital by the time they launched their IPO. All of them continue to have significant direct online sales channels but many eschewed the digital-only tag, opening physical stores. Some of them were also selling on Amazon or Etsy or on partner sites while some went truly omnichannel by partly distributing via wholesale.
The meaning of DTC has expanded. It no longer means only brands that sell through their own direct online channel. Today, small brands sell on Amazon and also have their own Shopify presence. Big retail-first brands like Nike, Pepsi, or Apple – all have their own online DTC presence.
This rise of DTC has been driven by four significant developments.
- The first development was the growth of the Shopify ecosystem that enabled small and emerging brands to set up eCommerce sites painlessly. The eCommerce site serves both as ‘the brand’ (a destination that conveys the brand’s story and mission, style, and values) as well as ‘the store’ (that showcases products, enables purchase transactions, and service capabilities). Technology, logistics, payments, and even banking – you name a hard problem a brand has to solve - the Shopify platform solves it for them today.
- The second was Facebook and its social media ecosystem that gave small brands a platform to scale digital marketing and consumer engagement without having to work via agencies, publishers and other intermediaries. Facebook has subsequently turned the screws on its pay-to-play distribution reach which has increased the shopper acquisition costs for brands, but its impact on the initial growth of DTC business cannot be denied.
- The third is the oft-overlooked shipping and fulfillment ecosystem. The maturity of fulfillment products such as free shipping, same-day delivery, and free returns offered by 3PLs and last-mile shippers have shaped how DTC brands operate.
- The fourth, and more recent, development coincides with the liberal credit liquidity in the market. On one hand, brands have access to venture capital and off-balance sheet financing to fund their business growth. On the other hand, online consumer financing such as the ‘Buy-Now-Pay-Later’ movement has accelerated the consumer adoption of brands.
This report dissects all that we’re seeing about the DTC space today, and provides you with data-driven research insights on DTC product categories, social media presence of DTC brands, their ad spends, ecommerce technology, shipping maturity, and how the brands have embraced physical retail. This report does not prescribe a DTC playbook (if there ever was one!).
The research is based on a sample of 21,700 DTC businesses in the US that were curated by PipeCandy from its proprietary database of global ecommerce and DTC businesses.
While the term DTC includes businesses delivering digital multimedia content to consumers, online like games, and video or streaming services, this report covers only those DTC brands that sell physical goods. The report’s findings cover the following categories of DTC brands:
- Digitally Native Vertical Brands (DNVB), which refer to those that are born online, sell and ship their own products. These brands actively engage in awareness and promotion activities through their own digital presence and a carefully built social media presence.
- Brands that have a significant percentage of sales coming from their own online channel but sell through other channels as well
- Brands that use DTC as a channel strategy; typically brick-and-mortar brands that added online direct selling to their channel mix recently.
- Born-again DTC brands, which are brick-and-mortar brands that have adopted DTC as a significant channel and are increasingly becoming digital-first.
The State of the Direct-to-Consumer Industry:
Executive Summary
With COVID-19, the eCommerce industry fast-forwarded to the future, at a pace that was not anticipated. As consumers stayed at home and ordered things, DTC became a household name. Even consumers from the older demographic cohort warmed up to the idea of trying new brands and buying them online.
Supply chain bottlenecks and escalating digital media costs notwithstanding, 2020 and 2021 turned out to be watershed years for DTC. We saw several IPOs, some redrawing of valuations in the public markets, and some very decisive growth numbers for several DTC brands – thanks to the communities they built and financial innovations like ‘Buy-now-pay-later’.
We believe there are around 110,000-120,000 DTC businesses in the United States, as compared to about 800,000 eCommerce websites selling physical goods, in the United States. Thus, DTC businesses make up about 13% of all eCommerce businesses in the United States.
95% of all eCommerce businesses in the US have a gross merchandise value of less than USD 1M. In comparison, more than 70% of DTC eCommerce businesses in the US have a GMV between USD 1M and USD 5M. Over 75% of the DTC brands in the US today fall in one of the three categories - Fashion and Apparel, Home and Garden, and Food and Beverage.
Within the Fashion and Apparel category, the majority of businesses are those that specialize in selling jewelry, watches, fashion accessories, and footwear.
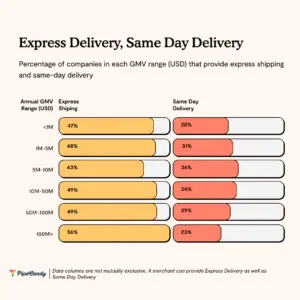
At least 25% of all DTC businesses offer next-day and two-day delivery, and this number goes up to 30% for mid-market brands. A significant number (28%) of long tail (less than USD 1M in GMV) DTC businesses offer same day delivery.
The United States Postal Service firmly remains the backbone for small and mid-market business product logistics, with up to 70% of businesses with less than USD 5M in revenue still relying on the federal mail service for parcel delivery. UPS and Fedex meanwhile have a better market reach among enterprise businesses.
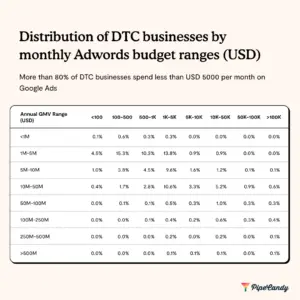
Over 60% of the DTC companies analyzed did not spend on Google Ads in the last 12 months. Of the businesses that did spend on Google Adst, more than 80% spent less than USD 5,000 per month on it. Enterprise eCommerce brands that also have physical retail stores had higher Google Ad spends. Their average monthly spend is about 1.8 times the average spend of large digital native brands. On the other hand, over 90% of DTC brands have a presence on Facebook, Instagram and other social media channels.
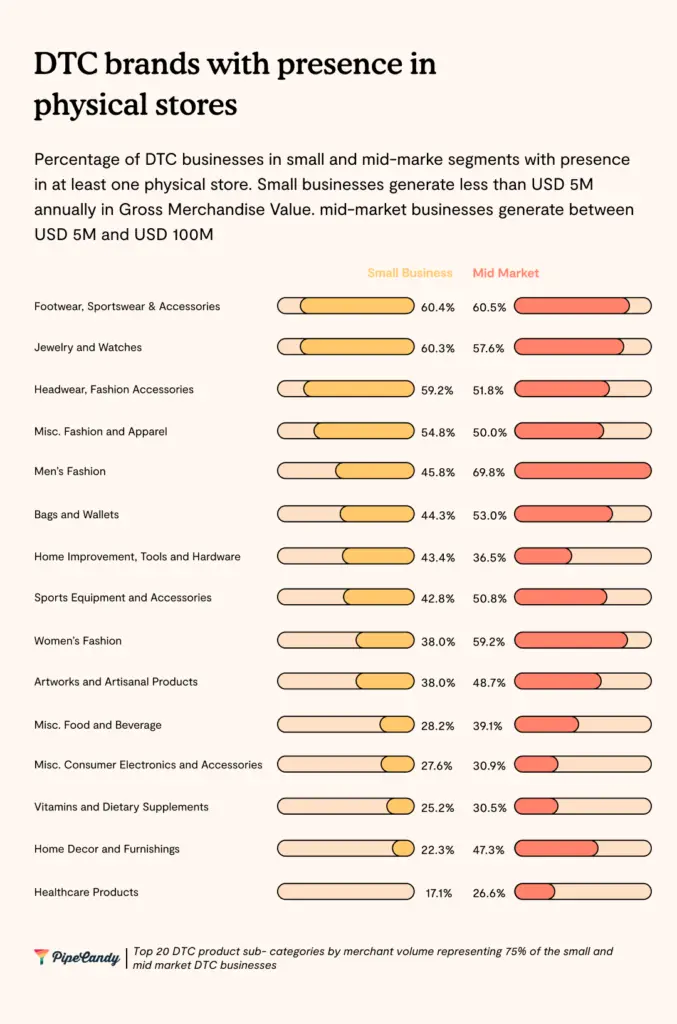
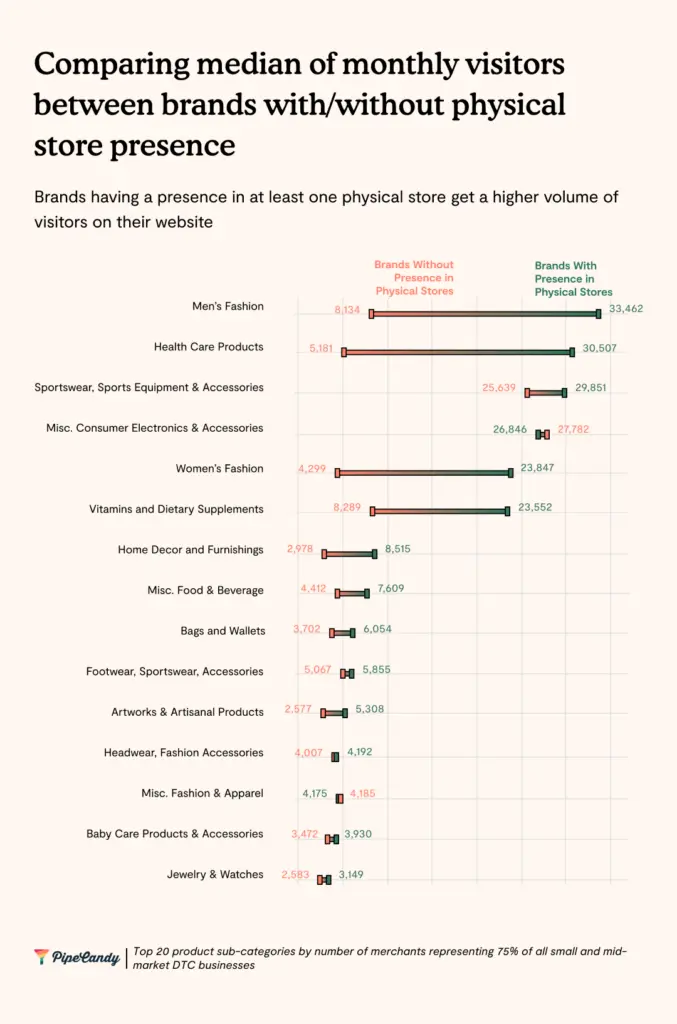
DTC businesses have also come to value the presence of their products in physical stores as it rubs off positively on their brands and helps drive more visitors to their direct online channels. According to PipeCandy’s estimates, about 47% of small and mid-market DTC businesses have some product presence in physical stores. In some categories, like Men’s Fashion or Women’s Fashion, websites of DTC brands that also have physical store channels get nearly four times the visitors as digital-only brand websites.
An Overview of the DTC Segment in the US
The New Definition of DTC
The first crop of DTC brands were digital natives. What differentiated them from traditional retailers and brands was that they engaged directly with customers via their own digital channels, be it for communicating brand values, building a loyal community or for direct sales and service. These DTC brands also leveraged customer behavior data to prioritize product decisions and to personalize communication. These DTC brands were fueled by abundant venture capital, and thrived in an environment of low competition and advertising on (then) underpriced social media platforms
Over time, increasing competition, rising customer acquisition costs (CAC) and the limitations of reach and market size due to a ‘digital only’ strategy, forced digital natives to look at other channels for growth. Warby Parker, one of the pioneers of the DTC model, saw its average CAC increase by 49% in 2020, and its media spend per customer was 19% of average customer revenue. Another DTC leader, Allbirds, saw its share of new customers drop to 47% from 59%. In response and to keep up the growth momentum, these brands expanded their presence to online marketplaces and retailer sites.
Online marketplaces made product discovery easy and helped DTC brands scale sales quickly, but it meant that the brands no longer had all of the customer data that they traditionally had access to. The choice of marketplaces was, in fact, the result of a trade-off between customer data and time to scale customer reach and revenue.
DTC brands began setting up physical stores because of the ease in understanding customer intent, improving brand awareness, and building trust. Meanwhile, wholesale-dependent brands, such as large CPG brands, began setting up DTC channels to enhance customer engagement and get access to customer behavior information.
Clearly, the line distinguishing a digital native brand and brands with direct channels is blurring.
We at PipeCandy believe that the original definition of DTC has now become obsolete, and the best way to define the DTC business as one that
- sells physical goods or delivers digital multimedia content online (such as games, video, or streaming services.
- operates its own functional ecommerce site for direct sales, irrespective of other channels it sells through
- sells products under its own brand name
Considering this, the potential number of DTC brands in the US could be anywhere between 110,000 to 120,000.
Gross Merchandise Value of DTC brands in the US
The Gross Merchandise Value (GMV) represents the gross web sales generated on the DTC brand’ own websites. It does not capture the sales that may be happening through other channels such as marketplaces, mobile apps, retailers, and own physical stores.
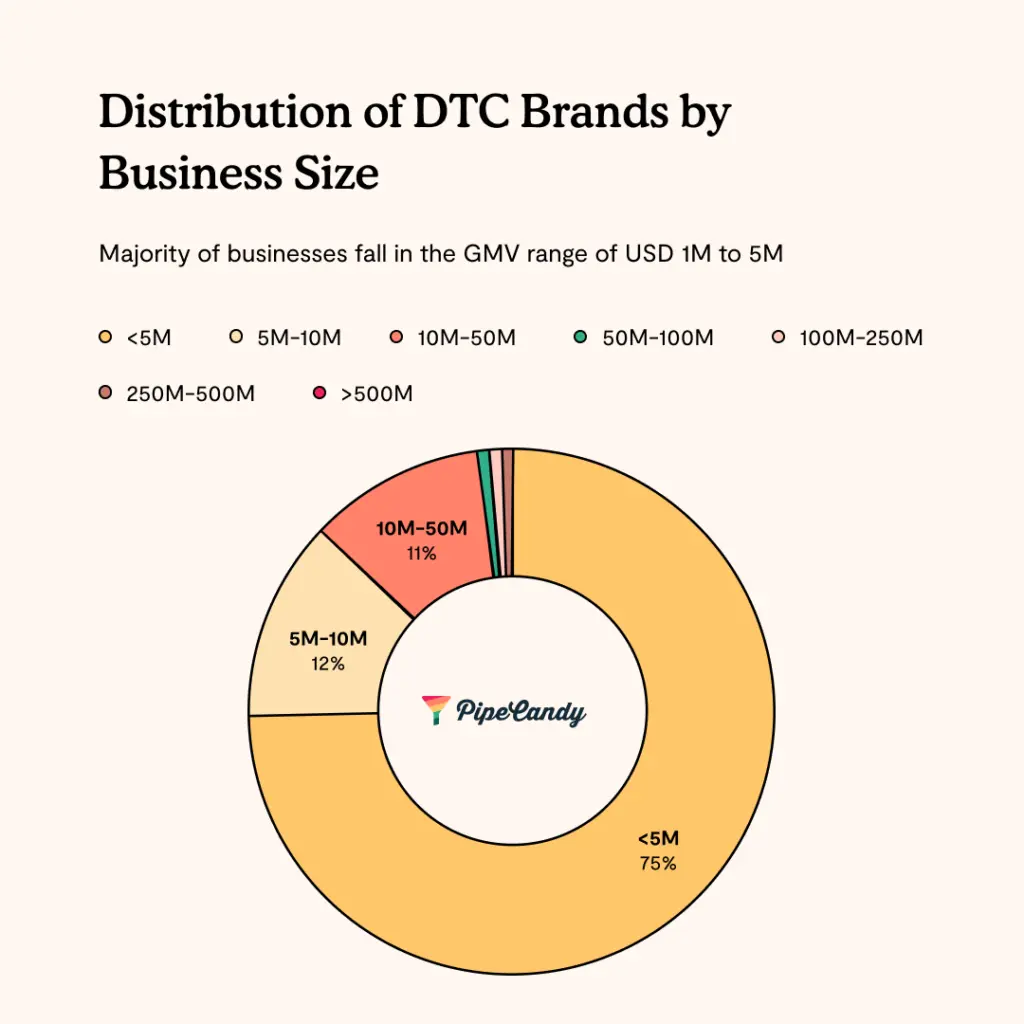
PipeCandy defines small DTC brands as those that generate less than USD 5M in annual GMV, mid-market DTC brands as the segment with GMV between USD 5M to USD 100M and enterprise DTC brands as those with more than USD 100M in GMV.
The GMV of the majority (71%) of the DTC brands in the US is between USD 1M and USD 5M.
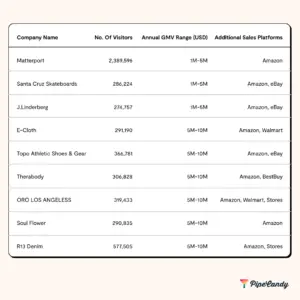
However, not all companies with less than USD 5M in web sales are small businesses. Some well-known CPG brands, with strong sales in other channels such as retailers and marketplaces, may have had a recent start to their online DTC channel and may have only limited success there. A good way to identify these large companies with low GMV is to compare their online sales with their online traffic. Many of these companies have high traffic, but low conversion to sales and hence low GMV.
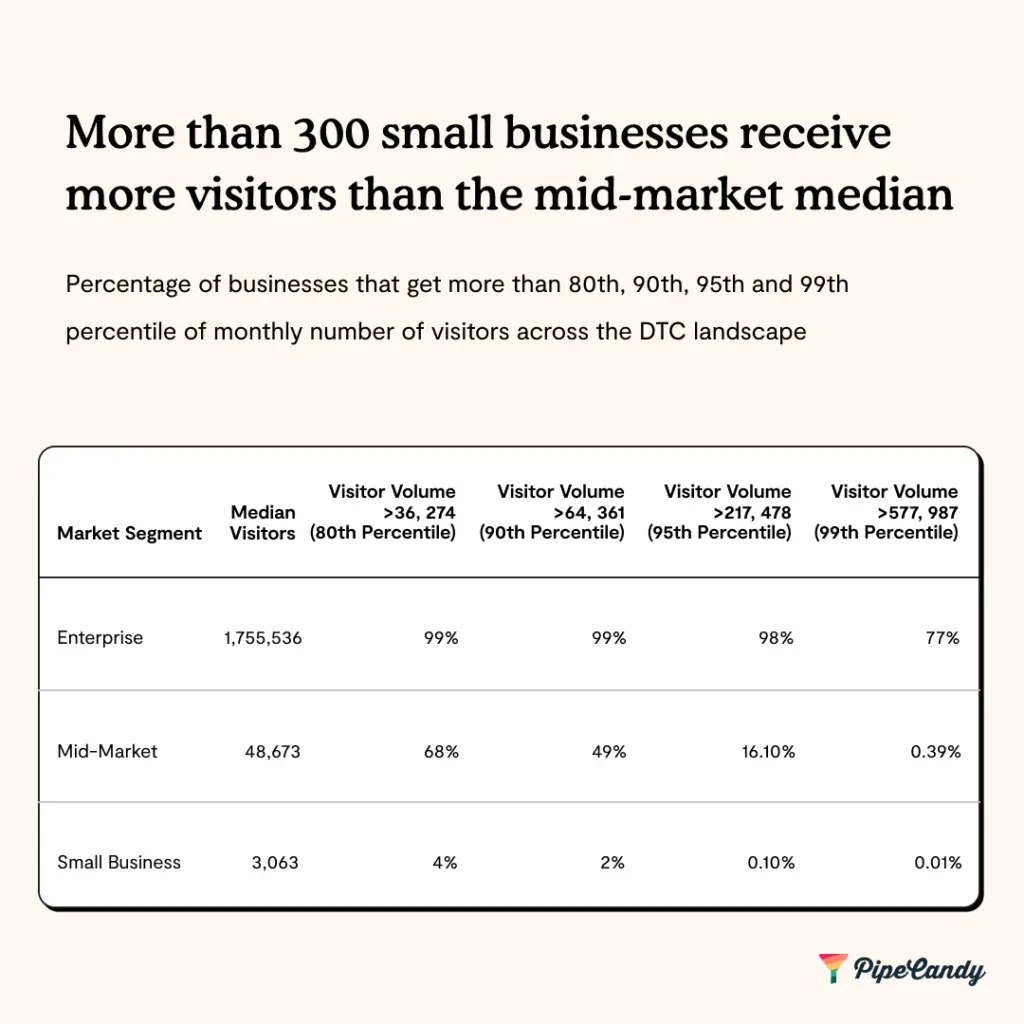
While monthly visits and the number of visitors are closely related, there are a few brands that stand out because they attract a lot of visitors to their ecommerce websites but do not quite generate comparable gross web sales.
There are 330 SMBs that see more visitors than the mid-market, and it is worth looking at why they attract more visitors while their GMV is low.
There may be a few reasons for this:
- The brand may be new and therefore unfamiliar to customers. The website hasn’t built enough trust to inspire purchases.traffic, in such cases, may be primarily driven by paid acquisition.
- The brand may be well-known, but the products are available in other channels including third party platforms, sometimes with discounted pricing. Shoppers visit the website to look up products or check for prices but purchase from other channels.
- The brand may be well-known but their ecommerce conversion funnel is poorly designed.
Product Categories
Over 75% of the DTC brands in the US today fall in one of the three categories –Fashion and Apparel, Home and Garden, and Food and Beverage. Fashion and Apparel includes Women’s Fashion, Men’s Fashion, Jewelry and Watches, Headwear, Footwear, Eyewear, Bags and Wallets, and other sub-categories.
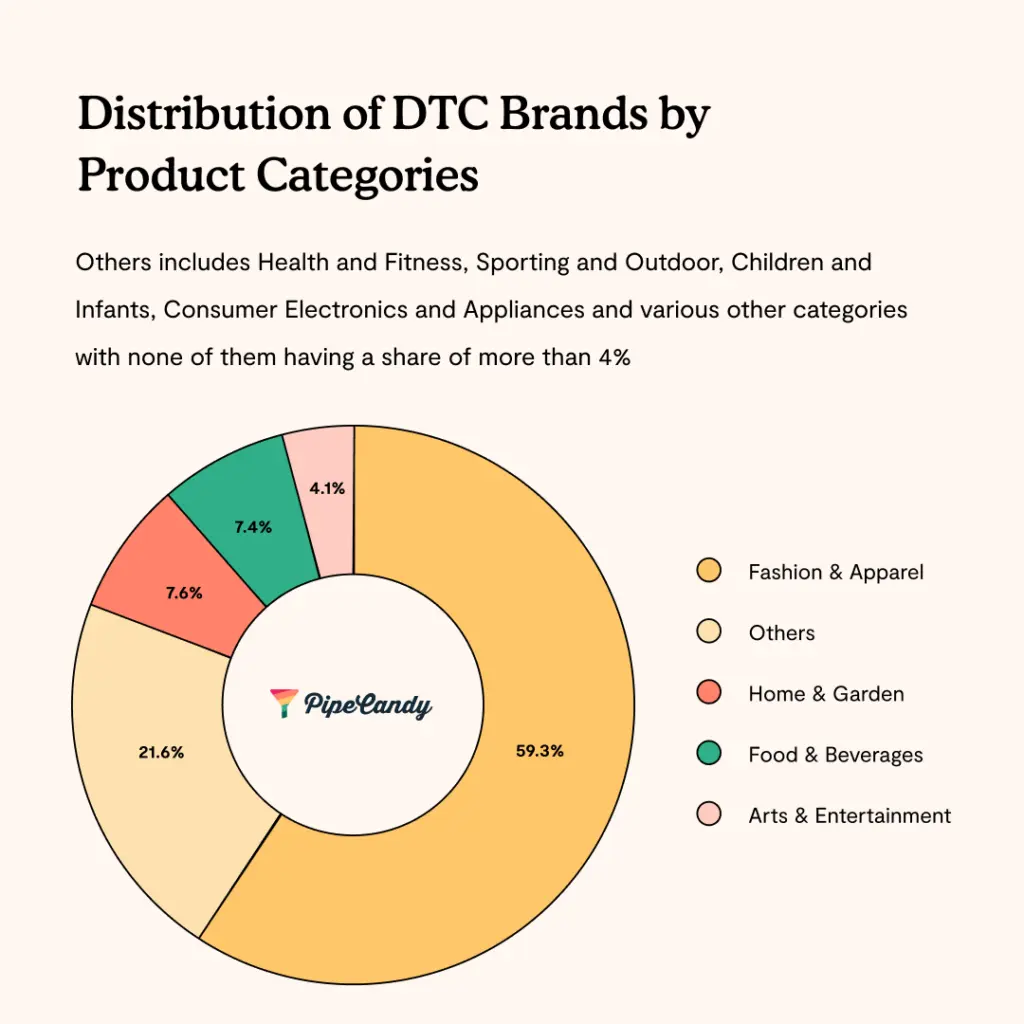
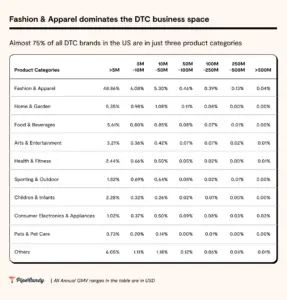
Among the big three, Fashion and Apparel is the largest in terms of the number of brands.
Change is a constant in the fashion industry. Keeping track of shopper needs, feedback, and localized trends is critical for the industry to survive. Working closely with shoppers ensures that brands are able to respond to their expectations faster and differentiate themselves from competitors. Community-driven DTC brands also succeed in minimizing instances of counterfeiting.
Fashion resale is a clear example of a niche that was discovered thanks to closer engagement with customers, better end-to-end understanding of the customer journey, and access to data.
Within the Fashion and Apparel category, the majority of businesses are those that specialize in selling jewelry, watches, fashion accessories, and footwear. These specialty DTC sub-categories apart, the top category within fashion is termed ‘Miscellaneous’ which includes brands that sell products across multiple sub-categories and also brands that sell beauty and personal care products, fragrances, hair care products and niche clothing.
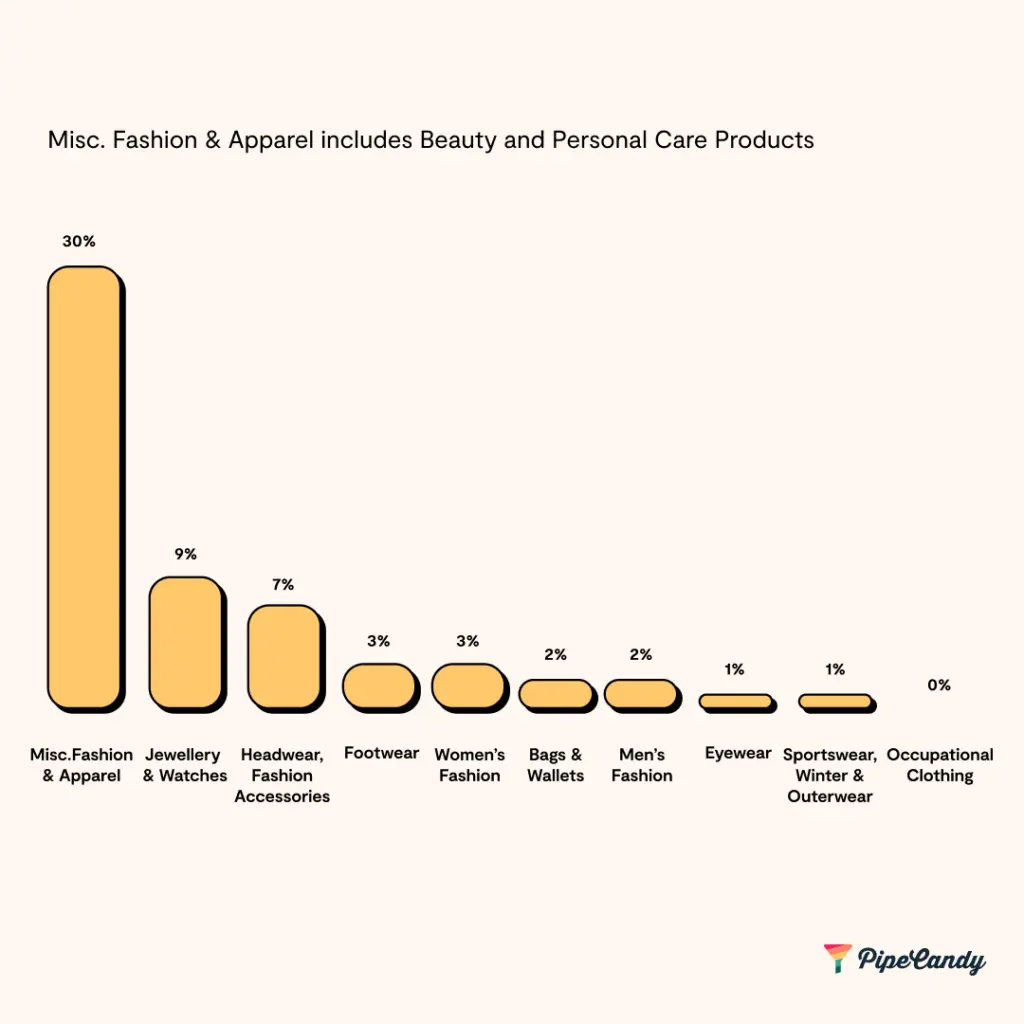
Jewelry and Watches form the second-largest sub-category. DTC jewelry brands have filled a gap in the industry between highly-priced brands and unbranded jewelry where the former category is priced six times higher than the latter. DTC jewelry brands exemplify the tenets of the DTC model with a high degree of personalization and attractive price points.
Shipping Speeds
The most significant development we’ve seen in the DTC space over the last few years is the change in shipping speeds.
A lot of this has to do with Amazon’s hold in the ecommerce space.
Amazon’s free-shipping and same-day/ next-day delivery policies have influenced customer expectations of delivery costs and timelines. This has forced the other ecommerce companies to rework their own fulfillment practices and shipping policies. Despite the increased costs, fast shipping has become essential for brands in order to improve customer loyalty and LTV. It has been observed that customers tend to stick with brands that offer free delivery and next-day/two-day shipping options, while brands that do not have such policies have a marked reduction in conversion rates.
Same-day shipping across the US isn’t always possible, particularly for DTC brands that do not have multiple warehouses across the country. Free returns and refunds further eat into margins. Geographical dispersion, resulting depletion of urban density, and the expectation of free and fast returns will squeeze operation cash out DTC registers. On the inbound side, the supply-chain crisis isn’t resolving anytime soon. With rising advertising costs on one end and crippling logistics and supply-chain costs on the other end, if there is a dampener to the DTC juggernaut’s velocity, it’s the cost of acquisition and delivery.
Shipping Speeds by Size of the Business
In 2019, we saw that around 26% of SMBs offered next-day delivery. PipeCandy data shows that this number has now gone up to 41%.
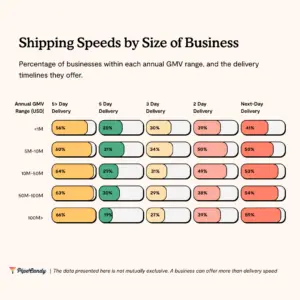
The larger the business, more likely it is to offer fast shipping options.
As per PipeCandy data, at least 25% of all DTC businesses offer next-day and two-day delivery, and this number goes up to 30% for mid-market brands. Most often, grocery-focused brands work with on-demand shipping platforms like Instacart or DoorDash for their same-day or next-day shipping needs.
DTC and Shipping Carriers
The three major shipping carriers that DTC brands in the US use are FedEx, UPS, and the United States Postal Service (USPS).
Ecommerce logistics is the least profitable of all segments that a carrier can operate in, because most parcels are small, and there are a lot of uncertainties—wrong addresses, returns, peaks & troughs, etc. Moreover, most shipping carriers are regional and are constrained by physical space, availability of management staff, and high attrition.
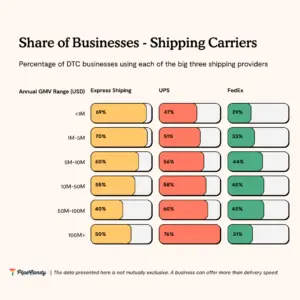
As per PipeCandy’s analysis, United States Postal Service (USPS) holds the largest market share in the SMB segment. USPS firmly remains the backbone for SMB product logistics. USPS has also been maintaining an on-time performance better than private carriers and will continue to remain so.
For the mid-market and large enterprises segments, UPS holds the largest market share.
Only about 27% of UPS’ revenues are generated from its SMB customers and it is firmly ensconced in the enterprise segment with close relationships with big brands. Among them, Amazon remains its biggest customer accounting for 13% of its annual revenues. However, UPS's largest customer is also its biggest threat. Amazon is also fast becoming its competitor having already exceeded FedEx in shipping volume even as it is enticing more SMB brands to join its seller program.
Google Ads Spend by DTC Businesses
Today, around 68% of online experiences begin with a search on a search engine and 85% of shoppers do some kind of online research before making a purchase online. Google, with its billion-plus daily searches and 3 billion Android devices around the world, is the biggest, most important discovery platform for any product or brand rivaled only by Amazon.
PipeCandy data indicates that more than 60% of the DTC companies did not spend onGoogle Ads in the last 12 months. Of the businesses that spend on Google Ads, more than 80% spend less than USD 5,000 per month on it, and 76% of them receive less than 500,000 visitors per month.
Around 7% of the mid-market businesses however spend between USD 10,000 to USD 50,000 per month on Ads.
The Link Between Physical Stores and Google Ads Spends

Enterprise businesses with DTC channels dominate Google Ads, spending 6 to 8 times the budgets of mid-market brands and many times over that of the long-tail ecommerce businesses. Of these, businesses with physical stores have 1.8 times higher budgets on Google Ads than large digital native brands. These mostly consist of retailers with many multiple SKUs. At the same time, the difference in budgets between brands with physical stores and those with digital-only presence in the mid-market and long tail section is not too significant.
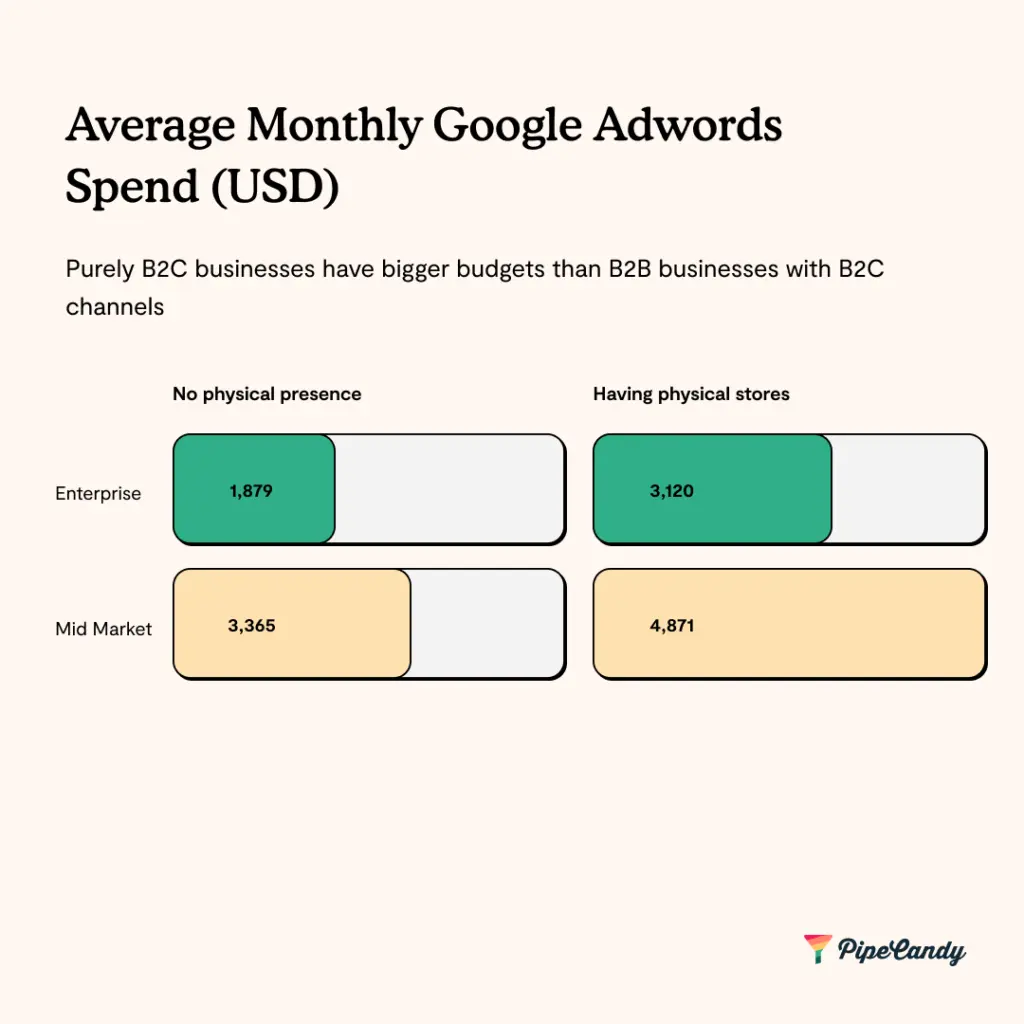
Average monthly Google Ads spend is significantly higher for direct B2C businesses than those who operate both B2B and B2C channels. Fashion and Apparel brands comprise almost 68% of the latter and have a robust distribution network apart from their stores and online channels.
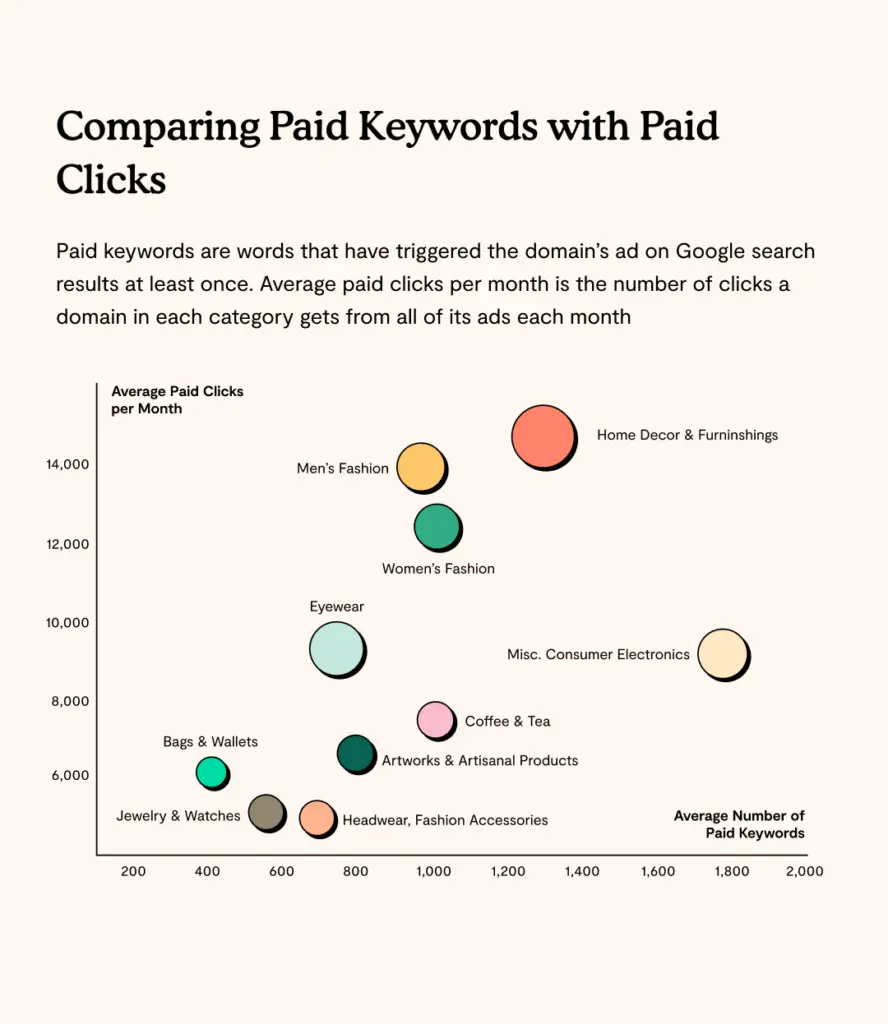
Fashion and Apparel businesses dominate the DTC industry — in terms of number of brands, and the number of SMBs with less than USD 5M in GMV or the "long tail". PipeCandy data shows that brands in the category neither spend heavily on Google Ads nor bid for many keywords, indicating that they focus their marketing and ad spends on social media channels like Instagram and TikTok.
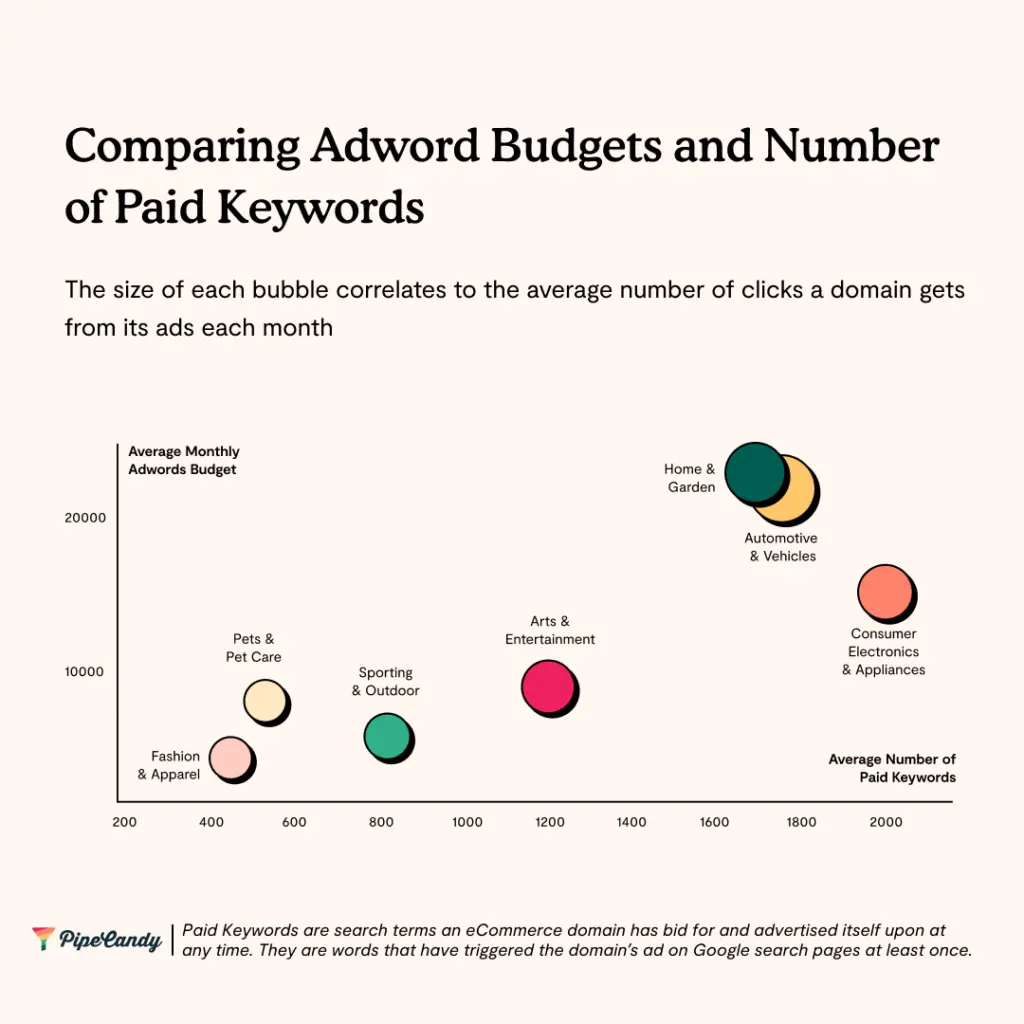
Around 60% of all DTC businesses are in the Fashion and Apparel category, but this category accounts for just 37% of the Google Ads budget pool. The average budget for the category is around USD 5,400.
The Home and Garden category spends around USD 22,000 per month, and the Consumer Electronics and Appliances category spends around USD 15,000.
Physical Store Presence of DTC Brands
The point of the classic DTC model was to sell fewer SKUs in limited direct channels and rapidly scale upon customer acquisition. But over the last few years, DTC brands have faced more constraints than opportunities with this strategy. Rising customer acquisition costs and uncertainties associated with online data privacy has meant that a digital-only approach cannot sustain the DTC model anymore, and brands are setting up physical stores as well.
Several digital-only DTC brands have now taken on an omnichannel model. This includes digital brands that are only experimenting with one or two physical locations, online brands that distribute via retailers, or brick-and-mortar boutiques that adopted an online presence to augment their customer reach.
Small and Mid-Market Brands with Physical Stores
As per PipeCandy estimates, about 47% of SMB and mid-market DTC businesses have physical store presence—either standalone stores or aisles within larger retail stores.
This is most common in the Fashion and Apparel category—55% of businesses in this category have either a direct or indirect physical presence.
The Home and Garden category, though, exhibits a diverging trend with physical stores.
This category traditionally relied on brick-and-mortar stores but there are more home decor and furnishings brands in the long tail of DTC ecommerce without a physical channel than there are with physical stores. The Home Decor and Furnishings sub-category however sees an increase in the number of brands with physical stores as the size of business increases.
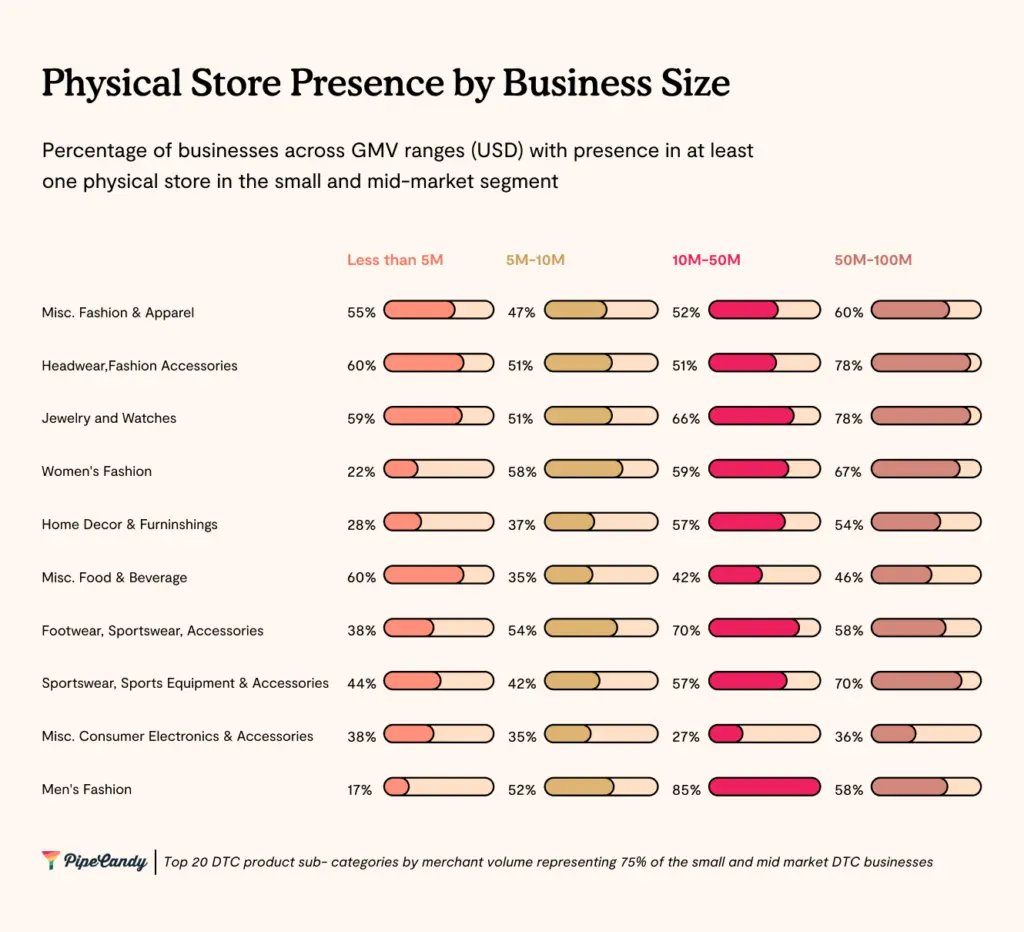
The Food & Beverage category is still relatively new to the digital space. While consumer stickiness is high with food brands, the category has long relied on grocery retailers to sell their products.ost brands in this industry lack the infrastructure to capture customer data and turn that data into actionable insights. Also, while a DTC model along with a physical store may act as a launchpad for a brand, emerging food brands have to rely on traditional distribution channels to scale up.
Social Presence of DTC Brands
Though social media presence is by no means a reliable measure of a brand's consumer engagement, an analysis of social media listings helps pick out the “brands” among businesses. While most businesses today have social media accounts, DTC brands maintain an active presence on social media platforms, with high frequency of posts with carefully crafted messaging.
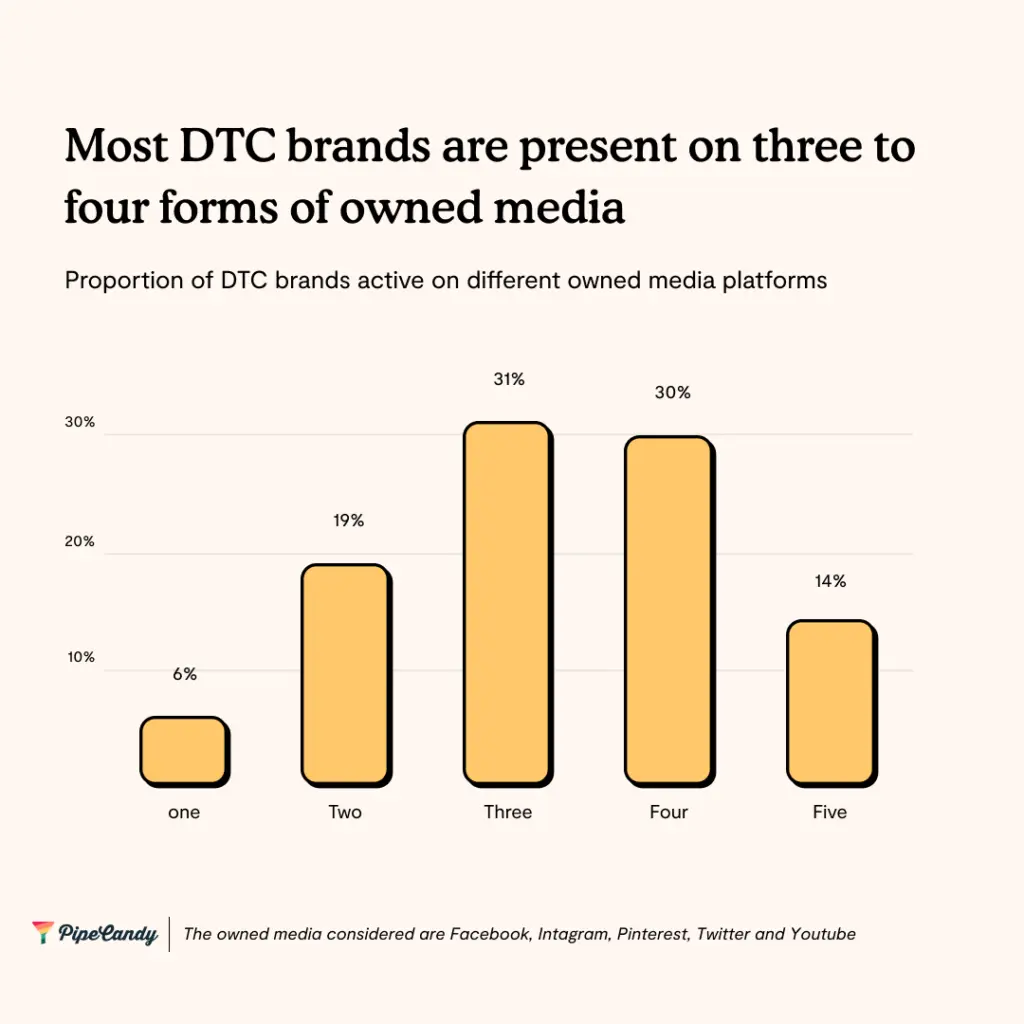
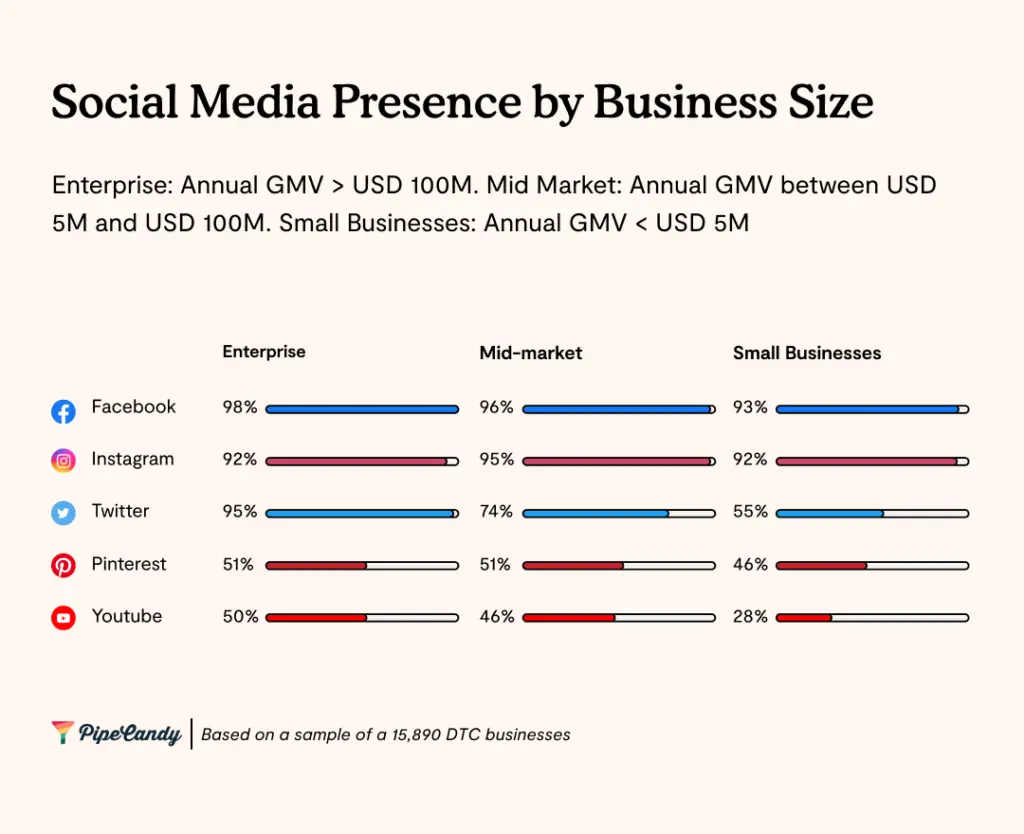
At PipeCandy, we analyzed 10,797 DTC businesses in the top 10 product sub-categories for presence on Facebook, Instagram, Twitter, Pinterest, and YouTube.
Social media has gone beyond advertising, and many of them have introduced platform-native ecommerce features to integrate advertising and transactions. Each social media platform has a character and reach of its own. So, several brands choose to be present on many of them.
The higher the number of sites where a brand is present, the more diversified the engagement is, because each social media site enables a different content format, reach to unique set of audiences with differing engagement characteristics
Around 75% of the brands in our sample have an account on at least three or more platforms while at least 44% have four or more accounts.
Typically, the nature of the business dictates which or how many social platforms they need to invest in. For instance, social media’s obsession with cats and dogs naturally means that brands with pet products simply have to be active across platforms. Around 23% of the brands in the Pets and Pet Care category are on no less than five social media platforms. Similarly, the importance of product demos and content related to product usage would mean that brands in the Consumer Electronics and Appliances category invest in social platforms such as YouTube. At least 85% of businesses in the category are on three or more social channels, with at least 50% having four or more.
Website Still Matters Despite Social Media
Part of social media presence is meant to drive conversions, regardless of where those conversions ultimately take place. This includes the usage of social proof (any content or comments generated by customers or target audience that goes to attest the brand).
The mobile phone is a critical touch-point for DTC companies - for purchases as well as social connection. As per a study by LiveIntent, advertising click-through rate for DTC brands is three times higher on mobile than on the desktop . However the work-from-home trend accelerated by the pandemic means that shoppers discover and transact on websites even during their work hours, hence the desktop website still remains a critical piece for brand discovery and engagement.
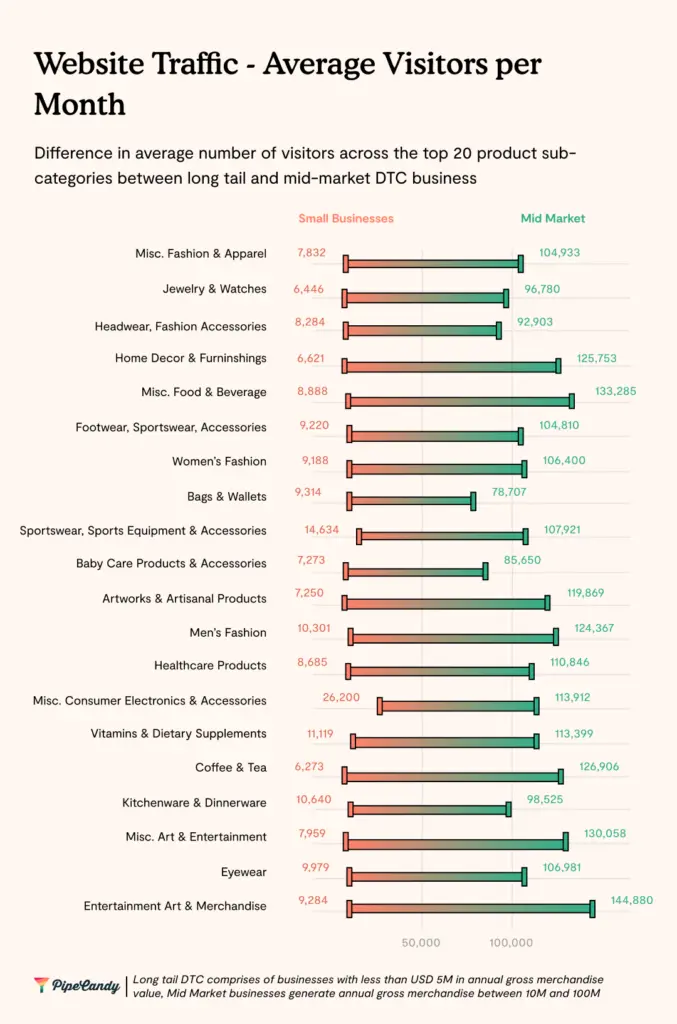
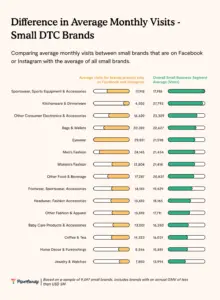
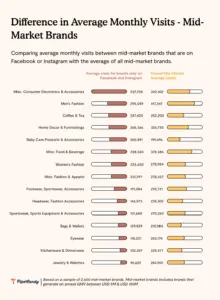
The average monthly number of visitors is highest in the small tail of DTC amongst Consumer Electronics and Accessories while Entertainment, Art and Merchandise attract the highest number of visitors each month in the mid-market. The Consumer Electronics and Accessories segment also has the highest average visits per visitor, driven by the fact that the products are feature-laden and have periodic upgrades and the websites are necessary for product searches and price comparisons.
The Dominance of Facebook and Instagram
Facebook and Instagram are the most popular social media platforms, and more than 90% of the brands with a presence on social media have accounts on these platforms. Twitter is the third most popular with 60% of the DTC brands having a Twitter handle.
PipeCandy data shows that among businesses that have only one social media account, 63% of them are on Instagram. And for those with only two accounts, at least 88% of them are on Facebook and Instagram.
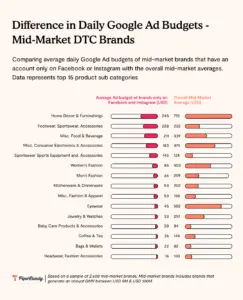
In the Small and Mid-Market segments, Google Ad budgets of brands present only on Facebook and Instagram are three times lower than the overall segment average.
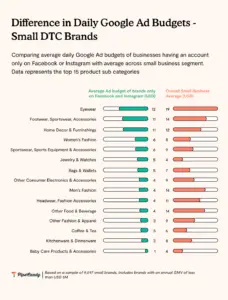
The gap is the greatest in the Women’s Fashion, Home Decor and Furnishings, Eyewear, and Jewelry & Watches categories. The first two have a large number of SKUs and consequently a very high volume of paid clicks each month compared to the rest of the categories.
As per PipeCandy data, the average daily Google Ads budgets across the small and mid-market segments was three times the average of brands that were present only on Facebook and Instagram. The difference in the number of visitors, though, isn’t proportional to this. Average monthly visits across small and mid-market segments is only 1.5 times more than brands that are present only on Instagram and Facebook.
The hypothesis to test here is if focused presence on the top two social channels reduce the dependence on advertising on Google and hence the reduced budgets for advertising on Google, in the case of brands with presence exclusively in Facebook and Instagram.
We may need to compare spends on the Facebook Ad Network to arrive at a conclusion. Ad spend comparison across channels is not a part of the scope of this report.
Ecommerce Technologies
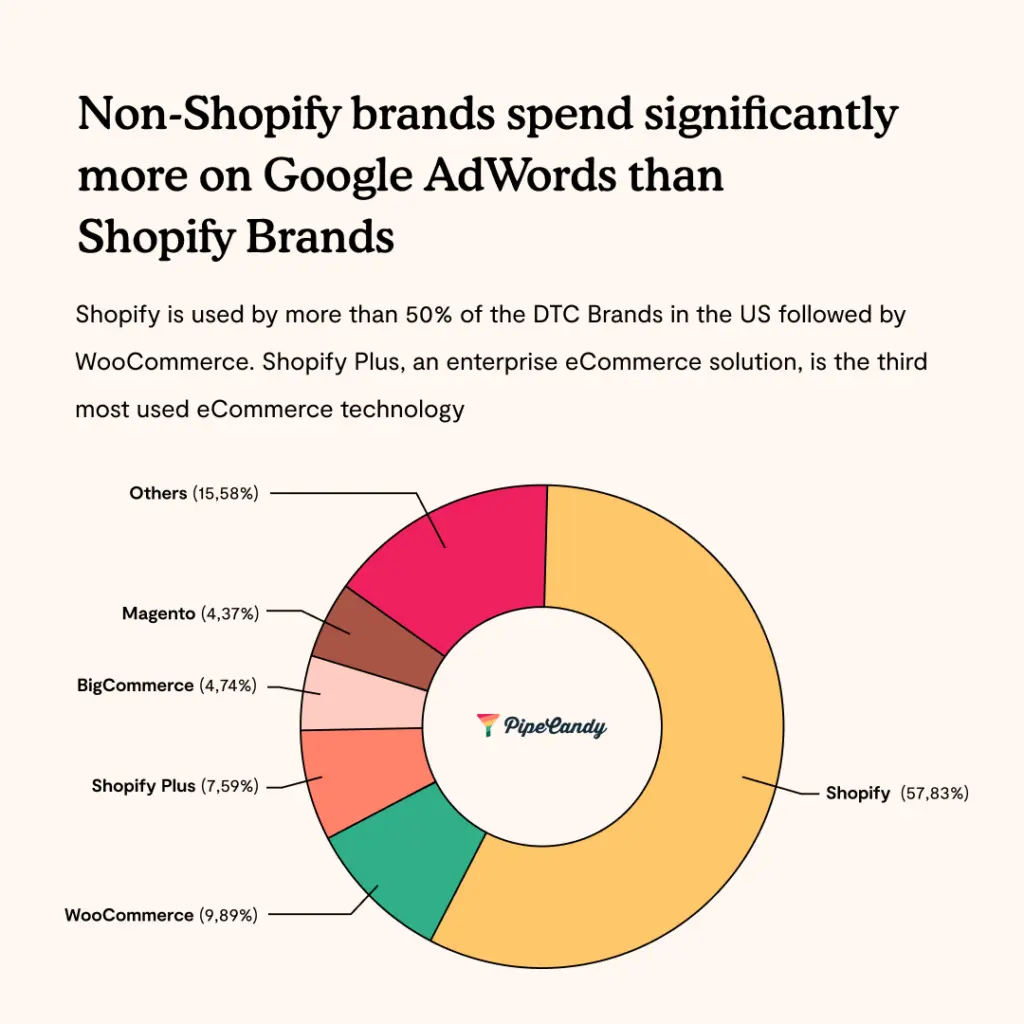
About 23% of all ecommerce businesses and 57% of the DTC brands in the US are powered by Shopify.WooCommerce is the second most used ecommerce platform technology, and Shopify’s enterprise version, Shopify Plus, is the third most used platform. While Shopify is a hosted solution, WooCommerce is an open-source ecommerce platform built on WordPress.
Shopify vs WooCommerce
PipeCandy data shows that brands that make less than USD 5M in GMV use WooCommerce. WooCommerce has a higher proportion of brands with less than USD 5M in GMV compared with Shopify - 88.26% for WooCommerce vs Shopify’s 84.51%.
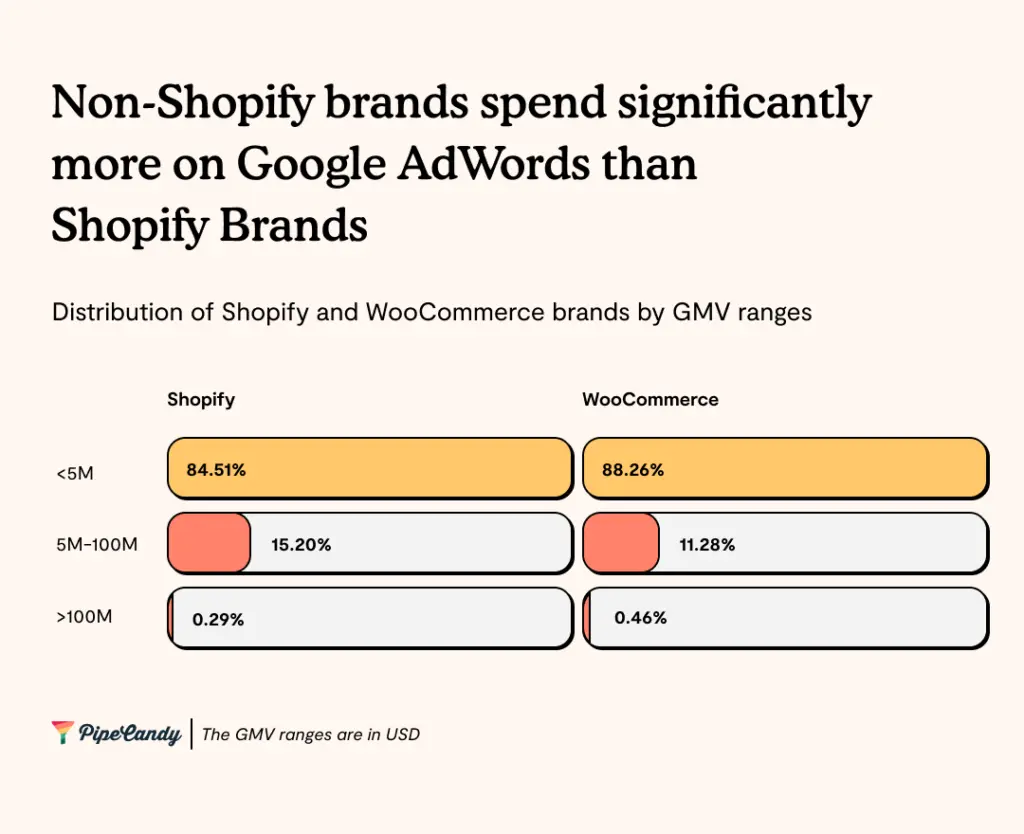
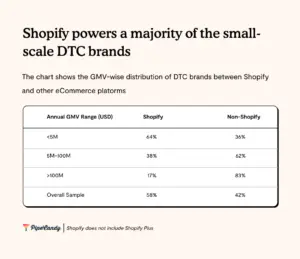
Shopify is used predominantly by DTC brands with annual GMV less than USD 5M. As the GMV increases, the adoption shifts to other platforms.
PipeCandy’s data suggests that Shopify brands spend a lot less on Google Ads than non-Shopify brands. The difference in budgets is more significant amongst brands generating less than USD 5M in GMV.
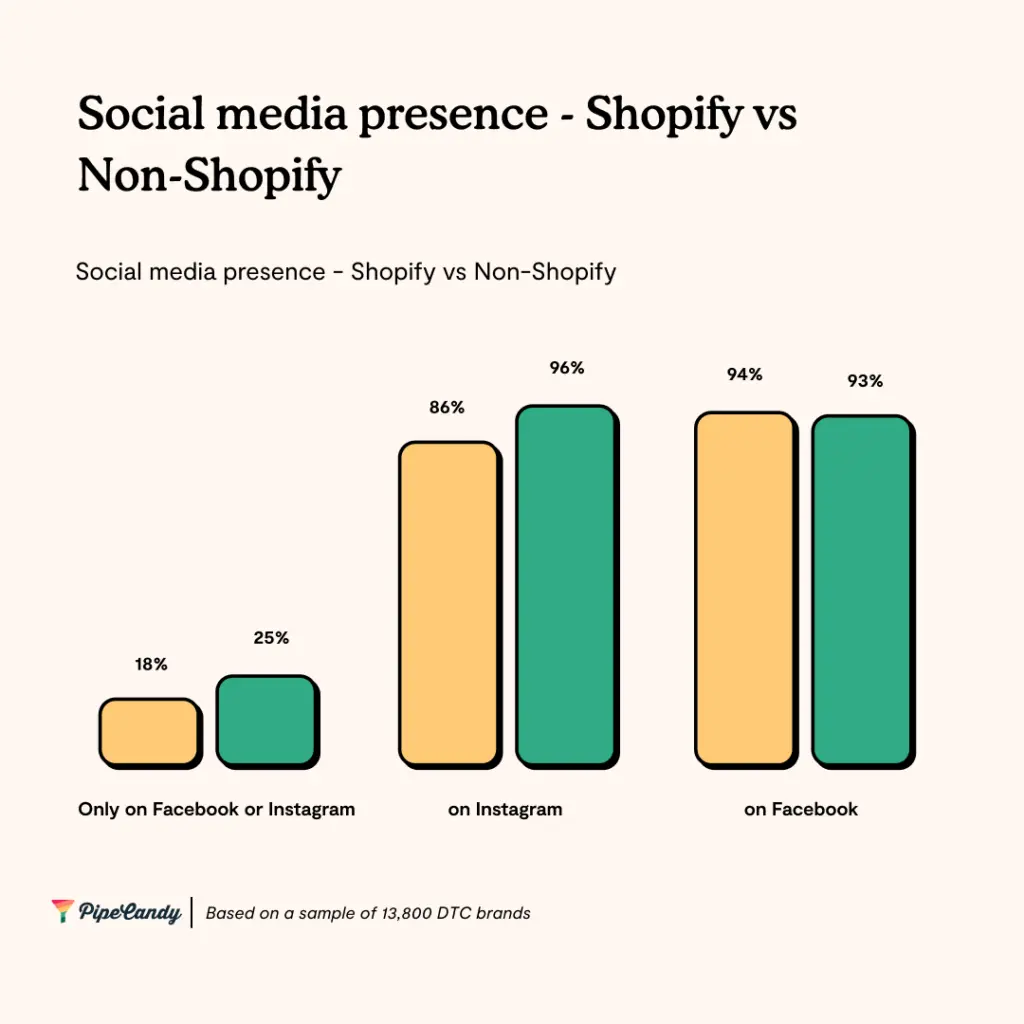
96% of all Shopify brands have an account on Instagram compared to 86% of non-Shopify brands. A quarter of all Shopify brands have presence only on Facebook or Instagram compared to 18% of non-Shopify brands.
Rising shipping and advertisement costs would encourage many DTC brands to surrender their bottom lines to Amazon in exchange for predictable demand at a predictable cost and may pose a challenge to the DTC ecosystems.
In the past two years, Shopify’s App Store has more than doubled the number of apps and updated its revenue-sharing model allowing developers to pocket 100% (previously 80%) of the first USD 1M they make on its platform. Developers earned more than USD 230M in 2020 by creating apps for Shopify. The revised model can create better incentives for developers to build more apps and of higher quality for small DTC merchants. Shopify has also embedded multiple products into the ecosystem starting with its payment processing system and multiple acquisitions to enable Buy Now Pay Later (BNPL) and other emerging payment methods. In short, Shopify is geared to stake its battle out of the storefront and into fulfillment and payments.


