Wondering if Facebook is worth investing in as a marketing and advertising platform? Check out these Facebook statistics before you make your final decision.
Facebook is one of the most important social media marketing sites in the world, owing to a huge user base. Even though it has been 19 years since its launch, the platform is still growing in popularity among both individuals and businesses. This makes it an integral part of most marketers' social media marketing plans. And, if you still doubt its capabilities as a marketing channel, then these statistics will definitely change your mind. In this post, we list 32 Facebook statistics that you should know in 2023. So, let's get started.
32 Facebook Statistics You Need to Know in 2023:
Facebook Corporate Statistics
Here are some statistics on Facebook's revenue, reach, and the number of employees. Facebook recently changed its corporate name to Meta, and it describes its purpose as to build technologies that help people connect with friends and family, find communities, and grow businesses.
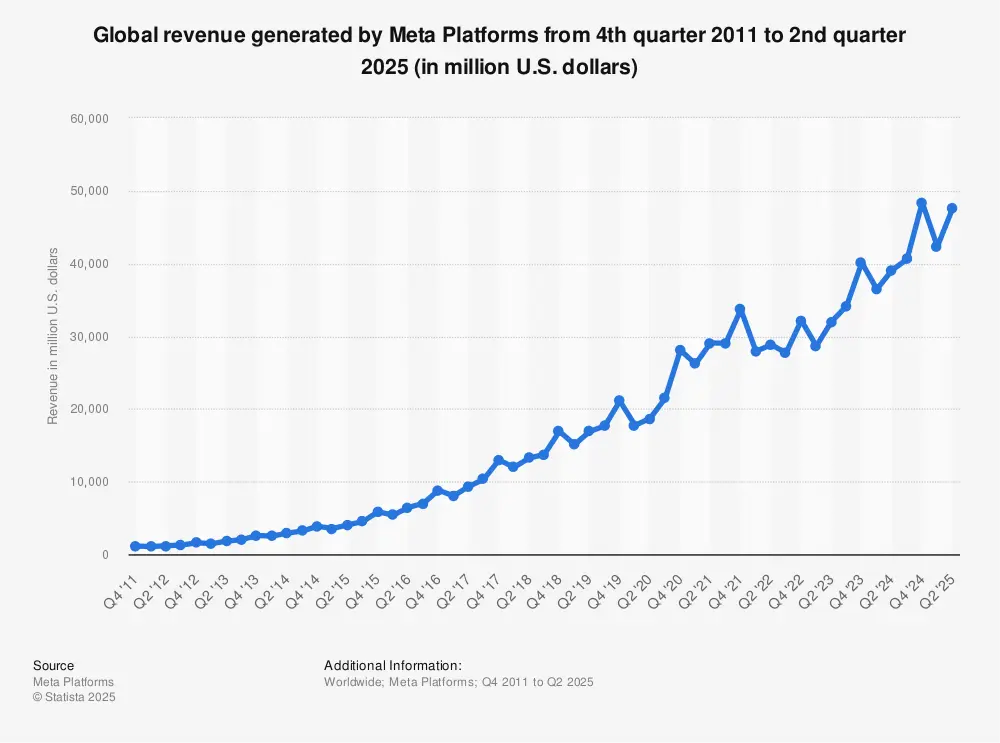
1. Global Revenue
In 2022, the global revenue for Meta (Facebook) was $118.1 billion, which increased from $117.9 billion in 2021. Approximately $60 billion came from the Facebook app.
Meta's revenue for Q3 2022 was $27.7 billion.
2. Regional Revenues
North America is extremely important for Meta (Facebook) revenue, even though it only has 10% of its users in that region. $49.1 billion of Meta's revenue was generated in the U.S. and Canada in 2022.
In comparison, $14.2 billion of revenue was earned in Europe, $4.4 billion in Asia-Pacific, and $3.2 billion from the rest of the world.
3. Profit
Not only does Meta (Facebook) take in considerable sums of revenue, it is also highly profitable. Global profit in 2021 was $95.2 billion (on that $117.9 billion revenue). This is up considerably on 2020's $69.2 billion. This profitability has continued through 2022, with Meta's Net Income for Q3 2022 being $21.9 billion.
As Facebook, the company has turned in a profit every year for more than a decade. Its profits in 2015 and earlier were all less than $10 billion. However, after announcing a $12.4 billion profit in 2016, they only took a year to exceed $20 billion profit and broke the $30 billion level for the first time in 2020.
4. Geographic Footprint
Meta (Facebook) has offices in 39 cities around the world. It also has 13 data centers globally.
5. Number of Employees
There are over 87K employees working in different offices at Meta around the world.
6. Market Capitalization
As of the end of November 2022, Meta's stock price was $118.1. This gives the company a market capitalization of $303.5 billion.
Global Usage Statistics
In this section, we will discuss statistics related to the usage and audience demographics of Facebook. All the statistics in this section have global numbers.
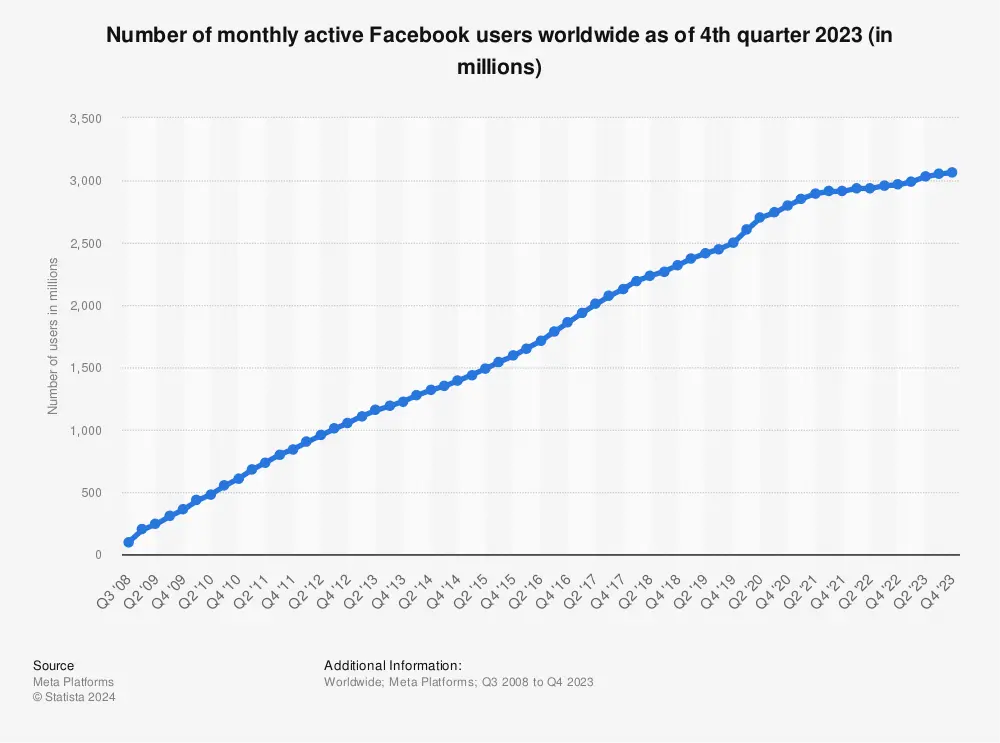
7. Active Monthly Users
Facebook had over 2.9 billion active monthly users as of Q3, 2022. This makes it the biggest social networking site in the world. Also, the number of users almost doubled in the last five years, clearly indicating that it is still popular and relevant.
8. Global Audience Segmentation - By Country
As of January 2022, most of the Facebook users were from India (~329.6 million users), followed by the US (179.6 million users).
A look at the top countries ranked by the number of Facebook users shows that it is quite popular in Asia and South America.

9. Global Audience Segmentation - By Age
There are more Facebook users aged between 25 and 34 than any other age bracket. People aged between 18 and 24 form the second-largest segment of Facebook users, followed by those in the 35-to-44 bracket.
This indicates that Facebook is popular among young and middle-aged people, but not as much with teenagers and older people.
10. Global Audience Segmentation - By Gender
56.6% of the global Facebook users are male, while 43.4% are female.
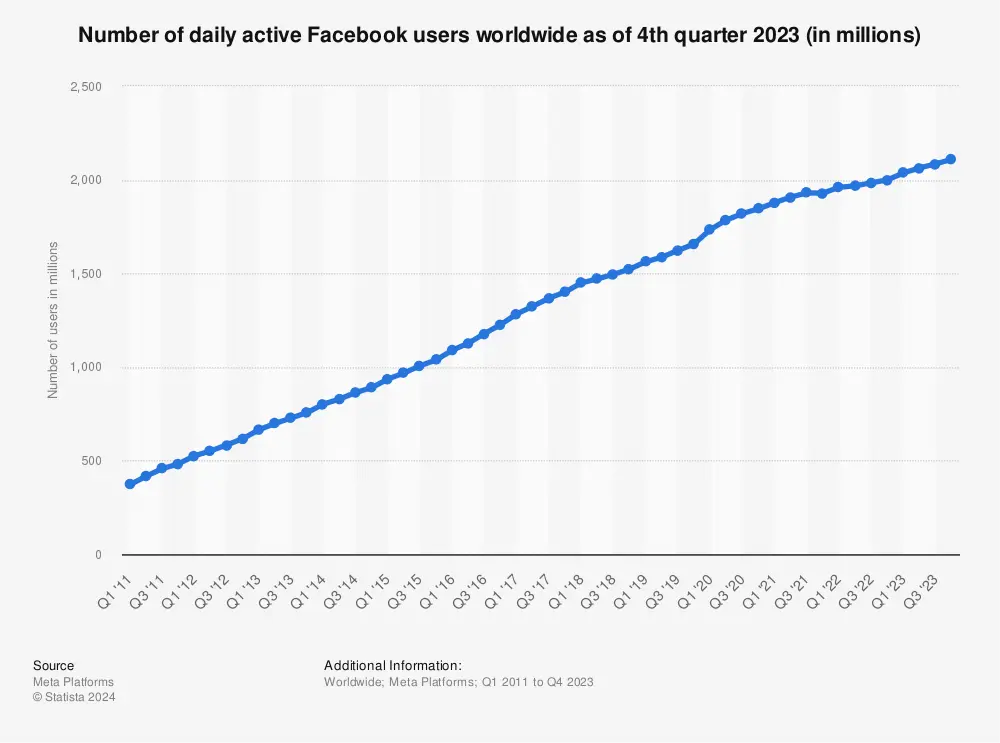
11. Daily Users
As of Q3, 2022, over 1.98 billion people use Facebook daily. These represent ~65% of the monthly active users of the platform, showing that most users of Facebook are active users.
12. Daily Content Shared
According to Facebook, users share over 100 billion messages on a daily basis. Also, the number of Stories shared on the platform is over 1 billion.
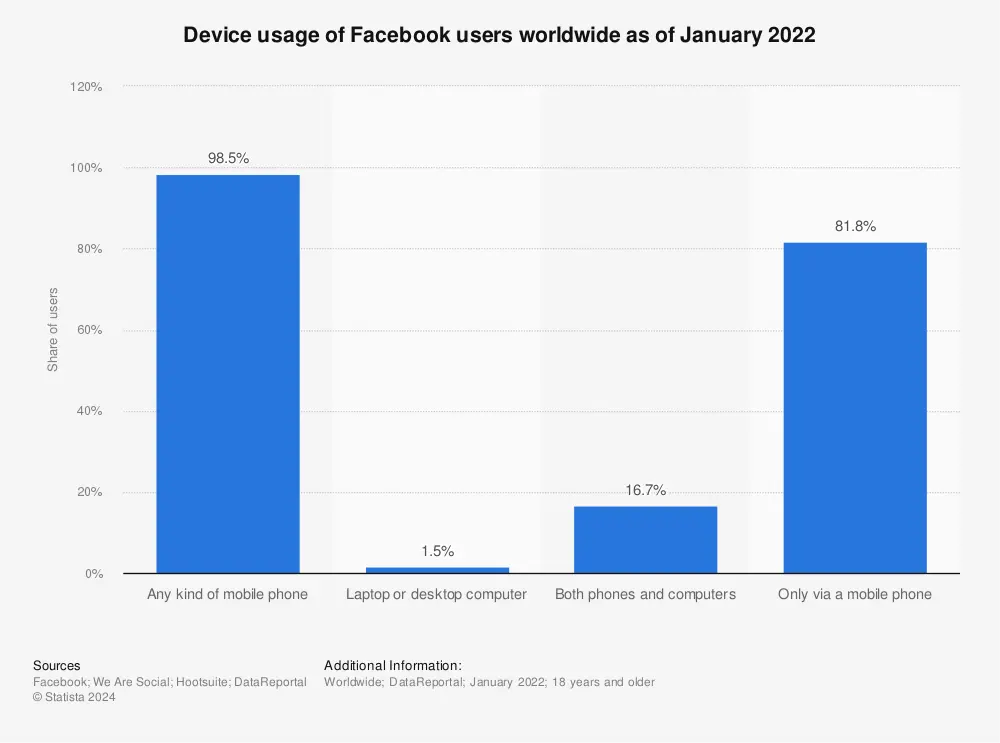
13. Facebook Usage - By Device
81.8% of Facebook users access the platform using only their mobile phones, and 16.7% use both mobile and desktop devices. A whopping 98.5% access Facebook utilizing some form of mobile device.
What marketers can learn from this is that they need to make their Facebook content and ads mobile-friendly.
14. The Most Popular Android Apps in the Google Play Store
Ignoring Google-owned apps that come preloaded on stock Android devices, the most downloaded apps in the Google Play Store as of July 2022 were:
- WhatsApp (8.413 billion downloads)
- Facebook (6.95 billion downloads)
- Facebook Messenger (5.67 billion downloads)
- Instagram (4.197 billion downloads)
- TikTok (2.843 billion downloads)
Meta owns the four most downloaded Android apps.
Facebook Statistics for Businesses and Marketers
Facebook is an important social media marketing platform for businesses. In this section, we will list statistics that relate to the business use of Facebook and give you reasons to use it for business purposes.
15. Number of Businesses Using Facebook
According to Facebook, there are over 200 million businesses on the platform. This shows the importance of the platform as a sales and marketing channel for businesses. They use it for advertising, promoting their products or services, engaging with their customers, and more.
However, this also means that it is not easy to compete for audience attention on this platform, and you need a solid Facebook marketing strategy for that.
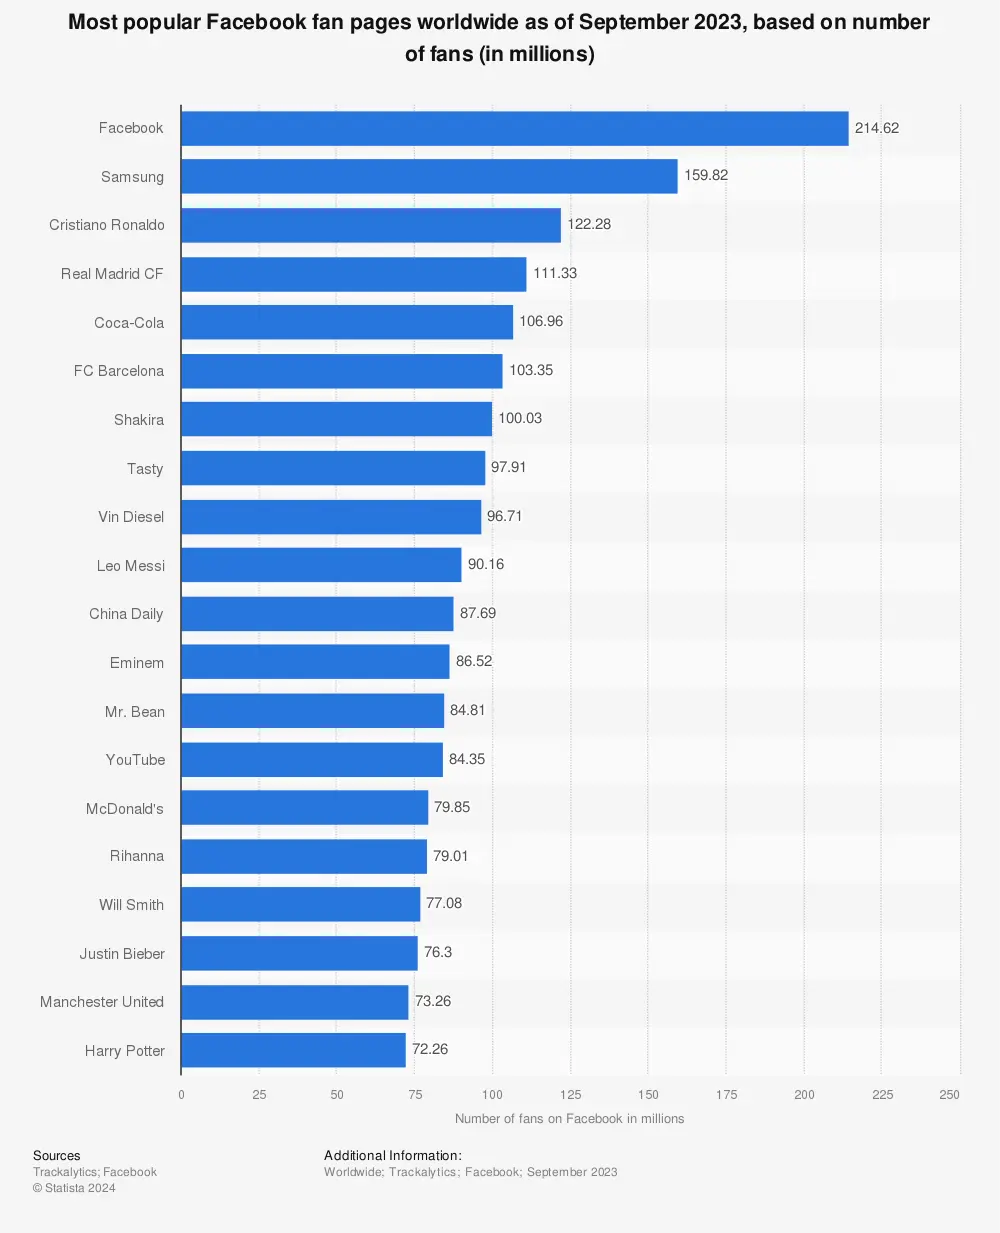
16. Most Popular Brands on Facebook - By Number of Followers
As of June 2022, Samsung was the most popular brand on the platform, after Facebook, with over 159.8 million fans. The other popular brands on Facebook appear in the image below.
17. Most Popular Type of Content on Facebook
According to data from Datareportal, link posts were the most common type of content on Facebook in July 2022, accounting for 52.7% of all posts. Photo posts took second place, at 28%. Video posts have risen from a mere 5.47% in 2014 to 17.7% in 2022. Status posts are now so rare that they make up only 1.6 of all Facebook posts.
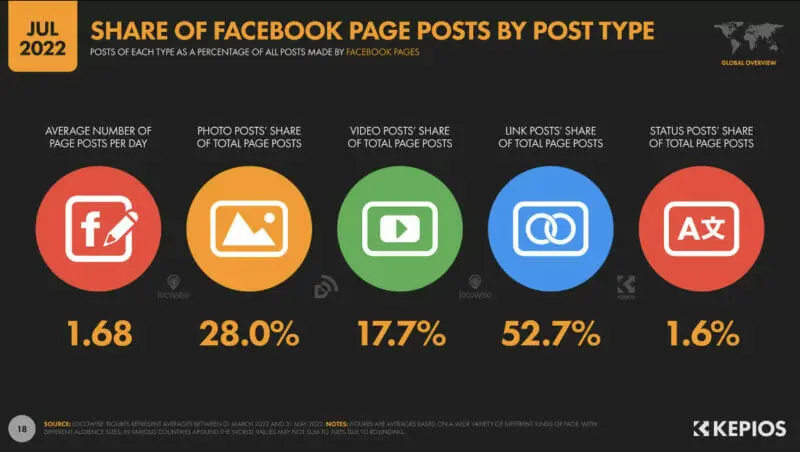
Source: datareportal.com
On the other side, Datareportal's Facebook post engagement data paints a very different picture. Photo posts generate the most engagement at 0.12%. Status posts have an engagement rate of 0.11%, video posts 0.09%, and link posts a miserable 0.03%.
This indicates a considerable fall in overall Facebook engagement over the last couple of years. Previously, video engagement stood out, but it is now lower than several other post types. It will be interesting to see if this is just a statistical blip or whether people have tired of videos on Facebook.
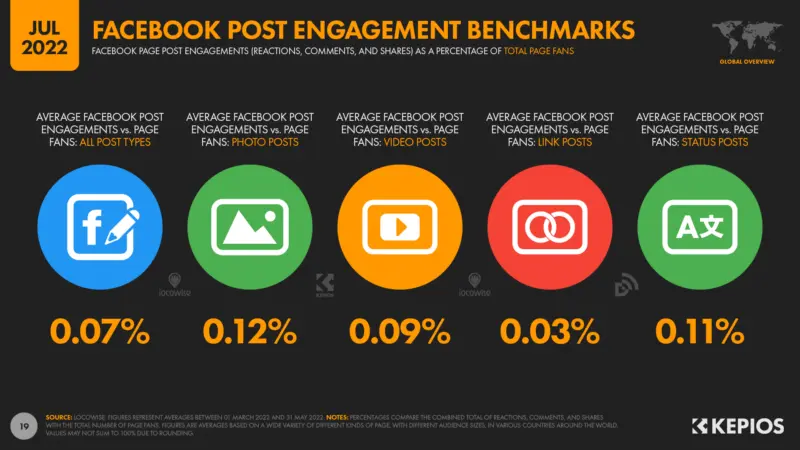
Source: datareportal.com
18. Facebook Post Engagement Rate by Page Size
Oberlo data emphasizes a common pattern for social media and influencer marketing. The average engagement rate for larger accounts tends to be considerably smaller than for smaller accounts.
The average Facebook page post engagement rate for pages with fewer than 10,000 fans is 0.31%. This falls to 0.21% for pages with between 10,000 and 100,000 fans. It drops even further for larger accounts, averaging just 0.05% for Facebook pages with more than 100,000 fans.

19. Facebook Advertising Revenue
In Q3, 2022, Facebook collected $134 billion in advertising revenue. The annual projections for fiscal year (F.Y.) 2024 are $170 billion, which is much higher when compared to previous years.
20. Time Spent on Facebook Per Day
According to data from Thesocialshepherd, users spend an average of 57 minutes on Facebook per day. This sums up to 28 hours per month and 20.000 minutes spend on Facebook per year.
21. Number and Usage of Facebook Groups
As of August 2022, over 10 million groups were on Facebook, with over 1.8 billion people using them each month. There are over 70 million admins and moderators running active Facebook groups.
Facebook Statistics for the U.S.
The U.S. is the local market for Facebook, even though it is behind India in terms of the number of Facebook users. Given that the platform started there, let's look at some of the Facebook statistics on the platform's U.S. usage.
22. U.S. Adults Who Say They Use Facebook
According to a Techjury survey, 71% of U.S. adults say they use Facebook. This figure has remained relatively constant since 2016. This makes Facebook the most used social platform in the U.S., apart from YouTube, which 81% of U.S. adults admit to using.
23. Total Number of Users
In 2022, Facebook had 179.65 million users in the U.S. The number of Facebook users in the U.S. is forecast to grow to 260 million users by 2027.
24. Facebook User Segmentation - By Age Group
23.6% of Facebook users in the U.S. belong to the 25-to-34 age group. The second-highest share of users (18.2%) is the 18-to-24 age bracket, followed closely by users aged 35-to-44 years, with 18.1%.
25. Facebook User Segmentation - By Gender
54.8% of Facebook users in the U.S. are females, while the remaining 45.2% are males.
This is in contrast to the global average of more men using Facebook than women.
26. Facebook Usage - By Reason
- to message friends and family
- post or share photos or videos
- keep up to date with news and current events
- follow or research brands and products
- look for funny and entertaining content
27. Facebook is Still the Most Popular Network in the U.S
Facebook holds the first position in the U.S as the most popular social media, according to a DataReportal study, with nearly three in four (74.2%) adults using it.
28. Facebook's Share of All Social Media Site Visits
In September 2022, Facebook accounted for nearly 64% of all social networking site visits in the U.S., beating other platforms like Pinterest (12.08%) and Twitter (10.87%). This shows that Facebook is still the most popular social networking platform in the U.S.
Statista does note that Generation Z appears to prefer video-first social platforms like Snapchat, TikTok, and YouTube.
Facebook Messenger Statistics
Facebook Messenger is an important part of many marketers' social media strategies and deserves a special mention. Here are some statistics related to it:
29. Global Usage and Popularity
Facebook Messenger is the third most popular messaging platform in the world, after WhatsApp and WeChat. It has over 988 million monthly active users, as per the last update.
Here are the numbers for other popular messaging apps:

30. Facebook Messenger Users in the U.S.
As of June 2022, Meta's Messenger app surpassed all predictions and reached 184 million users in the US only. Out of which, 23.8%, was 25-34 years, making it its largest audience.
31. Presence of Chatbots
As of 2022, Facebook Messenger had over 300,000 active chatbots responsible for the exchange of over 20 billion messages between people and businesses.
32. Businesses Using Facebook Messenger
Webtribunal reported that in 2022 there were 60 million monthly active businesses actively using Messenger.
Conclusion
Facebook is, and will continue to be, an important social media network for both individuals and businesses. The use of Facebook for business purposes has been steadily increasing, and if you haven't joined the bandwagon yet, it's high time that you do.
These Facebook statistics are enough to present a business case for investing in Facebook. So, go ahead and formulate your Facebook marketing strategy right now.
SUGGESTED

The Facebook Stats Every Marketer Should Know: A Complete List
Here's a complete list of Facebook stats for marketers. Read this blog to learn...

Top 25 Facebook Tools for Businesses
Need help with Facebook marketing? Here are 25 of the top tools (some of them free) that...

How to Make Money on Facebook in 2024
Discover 5 proven ways to make money on Facebook whether you're a business an influencer...