Overview
Iconosquare was founded in 2011. Back then, the fledgling startup went to market with the name “Statigram”, and a tool dedicated to gathering statistics about one’s Instagram account. And as social media evolved, so did the platform. Fast-forward a decade, and you’re able to track stats for Instagram, Facebook, TikTok, LinkedIn, and Pinterest.
Finding the best way to approach social media is no simple feat. It requires data and lots of it. And while data holds tons of valuable insights, data alone doesn’t tell a clear story of your brand’s performance in a busy and noisy market. That’s where Iconosquare comes in. It's an analytics, management, and scheduling platform.
Sure, these features sound common today, especially when they’re listed all at once. After all, they are what you’d expect from a social platform. The major difference? Iconosquare delivers some of the most in-depth analytics we have ever seen, and it does so in a beautiful way. And when you think about other must-have features, like the ability to establish an industry benchmark for your brand’s performance in comparison to competitors, and the option of listening to what people are saying about your brand and products, you quickly see that there’s much more value to be gained.
Pricing
Single: 49 euros/mo (billed annually)
This plan is ideal for Small Businesses and Professional Marketers. It offers management of up to 10 social profiles, 12 months of data retention, and both email and live chat support. Designed for a single user.
Teams: 79 euros/mo (billed annually)
Suitable for up to 10 users, the Teams plan allows the management of up to 50 social profiles and extends data retention to 24 months. Users benefit from a dedicated Customer Success Manager and tailored onboarding and training.
Custom: Customized pricing
Tailored to agencies or multi-location businesses, this plan offers unlimited users and data retention. It allows for more than 50 social profiles. The Custom plan is developed in collaboration with our sales team and includes tailored onboarding and training.
Discount Offer: Clients opting for a yearly subscription get a 22% discount.
All features are now available across all plans. The difference in pricing is based on the number of social profiles managed. This change allows all users, regardless of their plan, to access the full range of Iconosquare features. A detailed breakdown of all features is provided below.
The Details
Iconosquare is a strong contender in the social media marketing platform space. It brings together the most important aspects of social under one roof, making it possible to deliver your best campaigns and track them with pin-point precisions. It’s offering is segmented into three core components. These include analytics, publishing, and monitoring. For each, you get a complete suite of features to help get the job done.
Tools: Mobile apps (iOS and Android)
Feature Breakdown
Analytics
Analytics are meant to take care of the pressing challenge of quickly uncovering trends. And in Iconosquare, that’s easily accomplished. You get a range of easy-to-read graphs that display brand performance. Track follower evolution, average engagement rate per post, reach, and impressions history. You can also go as far as tracking the success of Instagram Stories, their completion rate by story type, and establish the best time to post Stories for a stronger and more impactful strategy.
Here’s a detailed look at what you’re able to track:
Community: Community analytics offer a closer look at your audience. Gauge where they are located, the languages they speak, and their age groups and gender. You’re also able to see how well your account has grown over time with a look at followers gained and lost.
Content: Content analytics cover important metrics explored above, giving you a look at behaviors and how they influence content consumption. Track history, distribution, density, and distribution per post by the hour.
Engagement: Track engagement by account and post to see how content is received by your audience. Engagement measures average likes and reactions, the number of comments received, likes/reactions and comments growth history, and shows the most engaging posts. You’re also able to use engagement metrics to discover your best times to post content.
Reach and impressions: Measure reach of posts and stories. Identify your widest reaching content, its reach and impressions history, and track reach by post type, followers hours online, and more.
Profile activity: Track profile activity and measure the evolution of your profile. This includes a look at views, the number of clicks on your website, email and directions links, and also click-through rates.
Page performance: The Page Performance tracker shows the evolution of your page views and your likes and unlikes. You’re able to identify tabs viewed the most, and visualize your click history.
Detailed post analytics: Measure reach, impressions, content saves and video views. Also establish other key identifiers like follower age, genders and languages. In addition to metrics covered above, you can also track video posts. Get details on video views, average time watched per view, view engagement rate, and total time watched.

Stories and advanced analytics: Stories analytics show reach, impressions, saves and video views.
Industry Benchmarks: Industry Benchmarks is one of our favorite features. It’s a look at over 100 industries, giving you the opportunity to find yours and compare your performance using metrics. You can benchmark metrics like follower growth, average engagement on reach per post, posting frequency, the number of stories per day, the average completion rate by story, and more.

Tags and mentions: Measure and understand how your brand or profile is being mentioned on Instagram with metrics like mentions by type (comment, photo tag, caption), breakdown of mention by media type (photo, video, carousel), mentions history, and more.

Hashtags: Hashtags analytics help visualize performance of an Instagram hashtag. You can spot trends for top posts, likes, and comments received. This data can be exported for further analysis.
Competitors Analytics: Similar to Iconosquare’s Industry Benchmark feature, you get to go a little deeper and track specific competitor brands. This feature is made for Instagram and Facebook and helps you visualize competitor follower growth, engagement rates, average reactions and likes, comments, and posting habits.
Adding a competitor is relatively easy. Click on Competitor, head to Overview, click on the blue '+' at the top of the page and enter their exact Instagram username. Next, select your competitor from the dropdown menu. Note: Only Instagram business accounts can use this feature.

Promoted Posts Analytics: Gauge the performance of Instagram and Facebook promoted posts. Establish reach, engagement, impressions, and more to get a good idea of how to improve promoted posts and maximize on virality. Promoted posts analytics do not include Carousel posts or video views.
Charts exports: Export data from any chart in CSV or PNG format.
Analytics exports in XLS and PDF: Download daily, weekly, monthly, quarterly or yearly XLS exports for your analytics. You can also schedule regular exports and have them automatically emailed to stakeholders.
Custom dashboard: Iconosquare comes with a customizable dashboard. You’re able to build one to capture insights important to your brand and campaigns, and for each social profile you manage. Dashboards can also be exported as reports and shared with team members and clients.
Building a dashboard is intuitive. You get a list of metrics neatly placed in the right-hand menu. From there, drag and drop what you need from each section.

Monitoring: Monitoring is one of the smarter additions to modern-day social media tools. It’s a great way to stay on top of conversations about your brand and products. Iconosquare lets brands listen and engage audiences. You can respond to, moderate and export what’s being said on your posts.
You also have access to Tags and Mentions Analytics. These help you break down your mentions on Instagram using metrics like mentions by type (either the photo, caption or comments), mention by post type, mentions history, and more. And all of this can be easily viewed in a feed.
Campaigns and Campaigns analytics: A feature not often considered, but very insightful is Iconosquare’s Campaigns Analytics. It gives you a look at the performance of all publications you've posted for a given event.
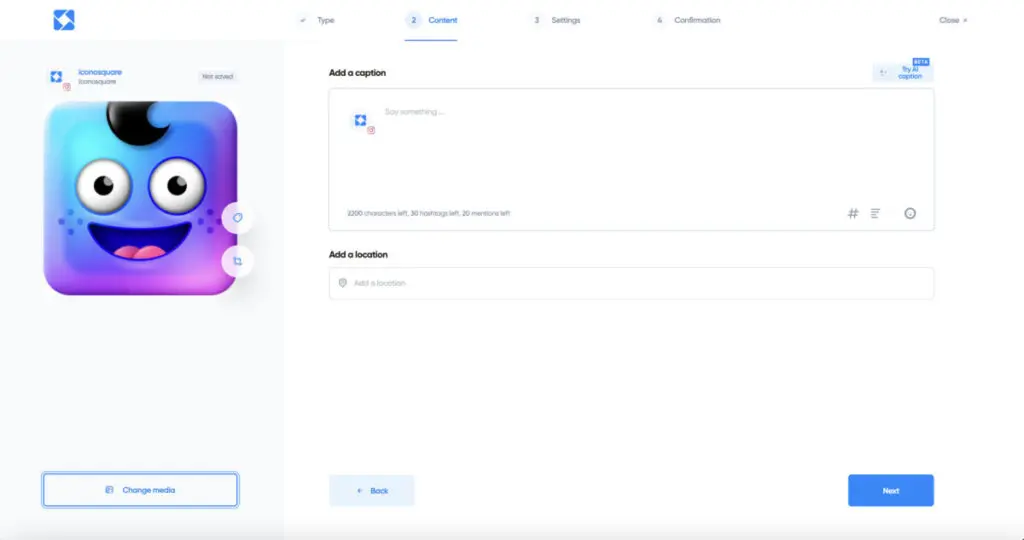
Post Scheduler: As post scheduling tools go, Post Schedule is versatile and easy-to-use. It leverages drag-and-drop functionality, making it easy to order content. Posts also offer previews to ensure your content is optimized before it’s published. You can also add photo and video posts automatically to Instagram and Facebook.
With Iconosquare, the user can schedule on Instagram, Facebook, TikTok, LinkedIn, and Pinterest. The scheduler also allows you to add saved captions or hashtag lists to posts -- a time saver for busy social media managers. You can schedule your first comment and cross-post content to other profiles, something proven to help boost engagement, and a tactic we love.

Automatic publishing and tagging: Tagging is a smart way to help your content get found on social platforms. You can tag accounts and locations in image posts when posting to Instagram using automatic publishing. You can also tag your location when posting to Facebook.
Note: Tagging isn't available for Story posts, but it can now be done with Instagram carousels.
Media library: Iconosquare provides a media library where you can upload images using Dropbox or OneDrive. It's easy to use and allows you to structure content to quickly find and use it. It also tags images already used to save you from posting the same content twice.

Instagram Reels Auto Posting: Iconosquare has recently introduced their new auto posting feature for Instagram Reels. This feature is incredibly helpful for users who don't have time to manually post content all the time, or who simply want to get their content out there without needing to be tied down to their phone. With the auto posting feature, you can now upload and schedule pre-made Reels videos in advance. Not only is this a great way to save time, but it also increases the chances of reaching a larger audience due to its convenience and speed.
Conclusion
Iconosquare is a powerful tool. Its feature set is a perfect blend, making it easy to fall in love with and use. Often, analytics tools seem clunky, almost too complex to use or make sense of, but that’s not the case here. Your data is quickly unpacked in an easy-to-understand format, using visuals that tell a clear story.
It’s no secret that there are other tools out there that offer analytics, post scheduling, and monitoring, but not all as packaged as well as Iconosquare. If you’re looking for a tool that won’t just help you get content out, but will help you improve your marketing performance, give Iconosquare a go. You’ll love the simplicity of the tool, how clean it is, and most importantly, the insights you gain.
Frequently Asked Questions
Is Iconosquare free?
Iconosquare does not offer a free tool but does come with a 14-day free trial.
What Iconosquare pricing plans are available?
Iconosquare offers three plans. These include "Single" (49€/mo), "Teams" (79€/mo), and "Custom".
What is included in Iconosquare reporting?
Iconosquare reporting includes a range of metrics. You can use reporting to track profile pages, tabs, and various post types.
Which platforms can I connect to Iconosquare?
Iconosquare supports Instagram, Facebook, TikTok, LinkedIn, and Pinterest.
Iconosquare
-
Features
-
Ease of Use
-
Support