eCommerce sales saw an unprecedented surge during the pandemic. With the relaxation of restrictions and the reopening of physical stores, the eCommerce sector has started readjusting itself towards pre-pandemic levels. The declining trend is also evident in the data of web traffic to eCommerce and Direct-to-Consumer (DTC) sites in the US. At the same time, in-store sales in the US have been increasing.
Wages are increasing, unemployment is at historic lows, and inflation is at its highest. The costs associated with eCommerce including shipping, fulfillment, labor, and customer acquisition, have all been on the rise. Consequently, digital prices have been increasing, but not as much as retail prices. Consumer sentiment has been declining; people are spending less than they did last year - the Visa Spending Momentum Index has breached the 100-point mark. The proportion of eCommerce in total retail sales is moving towards pre-pandemic levels. A lot depends on which direction the economy is headed.
STATE OF ECOMMERCE PRE & POST PANDEMIC REPORT
The State of eCommerce: Pre- and Post-Pandemic (2022):
Retailers, Marketplaces, and Brands
During the pandemic, brands were the most resilient compared to online retailers and marketplaces. While brands experienced a gradual increase in sales with the onset of the pandemic, retailers and marketplaces saw a sudden spike. Lockdown restrictions encouraged people to shop online for essential items. Large retailers and marketplaces benefited the most as customers looked for places where they could buy a variety of items in one place.
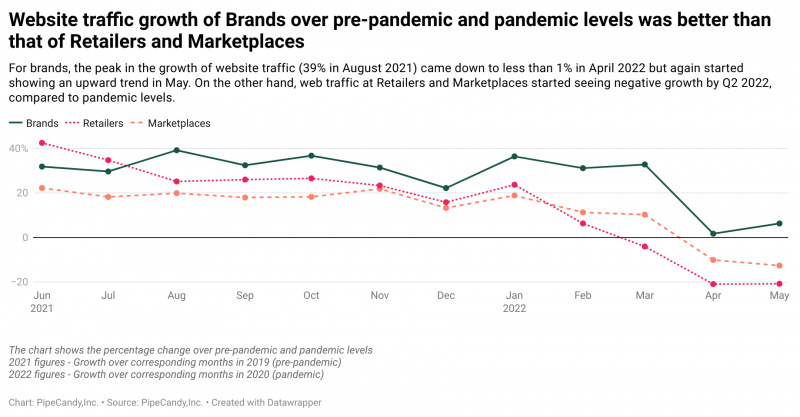
Post-pandemic, retailers, marketplaces, and brands had an almost similar fall in website visits. Once customers returned to outdoor activities and shopped in stores, they were browsing and purchasing less online. When the online traffic growth was compared to pre-pandemic levels, brands were the only ones experiencing positive traffic growth over pre-pandemic levels, until May 2022.
Having witnessed a peak in online sales during the pandemic, eCommerce will remain an integral part of most companies in the future. While inflation forces people to cut back on their purchases, eCommerce companies should be ready to see a further fall in site visits and online sales. A balance between online and physical stores will be the way forward. Additionally, companies would continue to invest in DTC channels to get even closer to the customer.
Product categories
The pandemic brought drastic changes in consumer buying behavior. People who had never shopped online took to purchasing their essentials through web stores, for the first time. Food and Beverages, Electronics, and Home and Garden saw a sudden jump in sales. The sales of items such as Motor Vehicle Parts and Apparel dropped as people were confined to their homes.
As the pandemic restrictions eased, traffic to all major eCommerce categories slowed down. With increased mobility, consumers were visiting sites less for online purchases and were reverting to spending on discretionary items. Hence, 2021 saw sales increase in Outdoor activities, Entertainment, Apparel, etc. The excitement of return to the normal and lockdown savings kept demand high for these items in 2021.
By 2022, customers again started returning to the harsh realities of wage increases not keeping pace with high prices and inflation. For many households, this meant reprioritizing staples into their budget over non-discretionary items. However, having experienced the convenience of online shopping during the pandemic, it would continue to remain popular among customers.
The Rationale for a Comparison
The impact of Covid-19 on the economy was quite unprecedented. Closure of shops, restrictions on the mobility of people and goods etc significantly affected the retail, eCommerce, and DTC sectors. By the time the restrictions were eased, physical stores opened, and people once again ventured out freely, the state of retail, eCommerce, and DTC had changed drastically. Besides the pandemic, we also witnessed high inflation rates, supply chain issues, shifts in demand, increased costs of shipping and customer acquisition, etc.
We analyzed data on eCommerce companies and DTC brands to understand how eCommerce companies, DTC brands, and retailers have been impacted during the pandemic. There is a clear difference between the time durations when the pandemic restrictions were strict and when they were eased.
What changed during the pandemic period?
The onset of the pandemic had governments across the world announcing complete lockdowns that saw the closure of physical stores worldwide. Customers then turned to online stores, resulting in an unprecedented increase in eCommerce sales. During the second quarter of 2020, Amazon’s sales increased by 57%. Physical stores had to close and new players kickstarted their eCommerce game. As a result, the number of eCommerce merchants increased tremendously. As physical store sales shifted to online retail, the proportion of eCommerce sales to total retail sales also saw an increase during the pandemic.
Pandemic-related restrictions also meant less manpower at ports, which couldn’t handle as much as they used to. Logistics and supply chain issues cropped up forcing retailers like Walmart to chart their vessels and manufacturers to order raw material a lot more in advance. Shipping containers started piling up in ports across the world, which meant that they were not available for shipping, pushing the cost of shipping containers up. For instance, the cost of shipping containers from Shanghai to Los Angeles increased tenfold.
During the initial stage of the pandemic, when the demand for various products fell, manufacturers halted production and laid off people. This led to a shortage of labor when demand finally picked up. Labor issues persisted despite companies paying a lot more to get employees on board. This also meant a shortage of truck drivers, adding to other supply-chain / logistics issues. Truck drivers are now paid more than before and this has also contributed to the increasing shipping cost, which is finally passed on to the consumers, contributing to the rising inflation.
eCommerce merchants – DTC brands, in particular – were heavily relying on Facebook Ads to reach and target / retarget customers. When Apple reiterated its commitment to users’ privacy with iOS updates, the cheapest advertising mechanism - Facebook Ads - became less efficient. This has had eCommerce merchants rethinking their marketing strategy and contributed to the increasing cost of customer acquisition.
The post-pandemic period
As the pandemic began to ease around June 2021, retailers started opening up at physical locations. The reopening of physical stores is a dampener to the astronomical growth of eCommerce witnessed over the pandemic. Over time, it is expected that the pandemic-induced eCommerce growth will adjust itself and eCommerce sales would take up its rightful place. While some product categories would lose a major chunk of their pandemic customers, others wouldn’t lose as much - that would be one interesting aspect to analyze.
Inflation is at its highest in forty years. On the one hand, supply has been limited due to shipping issues and manufacturing problems. On the other, prices have increased every step of the way: transportation, cost of customer acquisition, and labor – all furthering the effects of inflation.
Then, there is the ongoing Ukraine war. More than 300,000 American companies have supply chain dependencies on Ukraine or Russia. As Russia is a significant exporter of fuel, the war has played a major part in rising fuel costs, which in turn contributes further to rising shipping costs and inflation. Amazon has introduced a 5% fuel and inflation surcharge while other parcel carriers, on an average, have hiked rates by 5.9%.
Shortage of truck drivers, which also contributes heavily to inflation, is expected to stretch into the future as there are not many young people to sign up for the role as older people retire.
Given these circumstances, what does the future look like for eCommerce? Will eCommerce be able to retain the majority of consumers it acquired during the pandemic? Did the pandemic influence different product categories differently? We analyzed eCommerce companies and DTC brands to bring you insights in this regard.
Key areas of analysis
In this report, we analyze PipeCandy’s proprietary data and macroeconomic data on consumer spending, Digital Price Index, and in-store sales to support insights derived from the analysis of the Census data on US eCommerce sales. We drill down deeper into business types ⎼ Retailers, Marketplaces, and Brands ⎼- and major product categories to derive deeper insights.
Global eCommerce vs US eCommerce
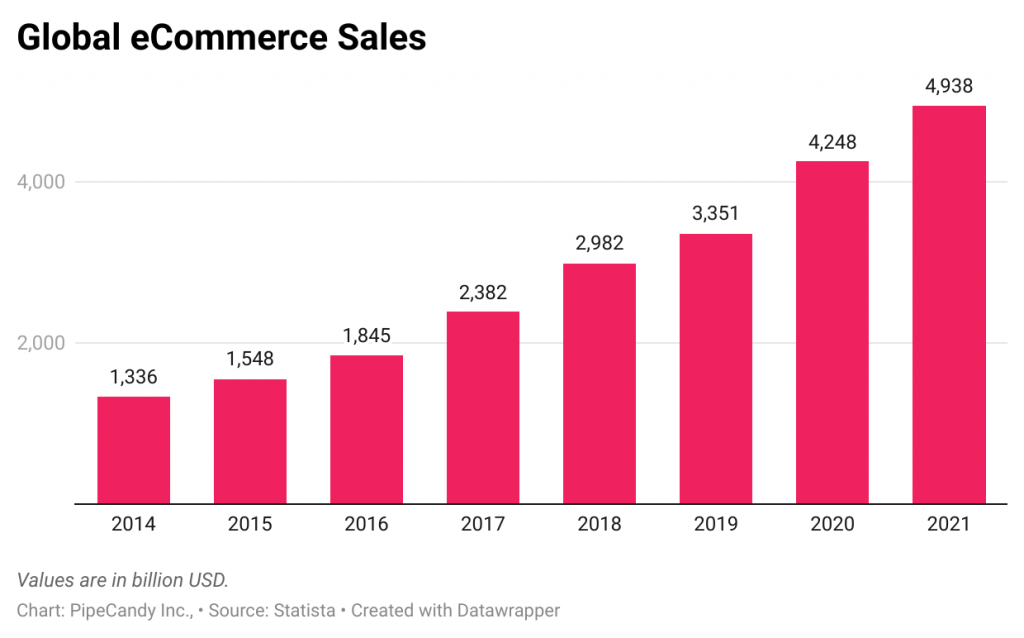
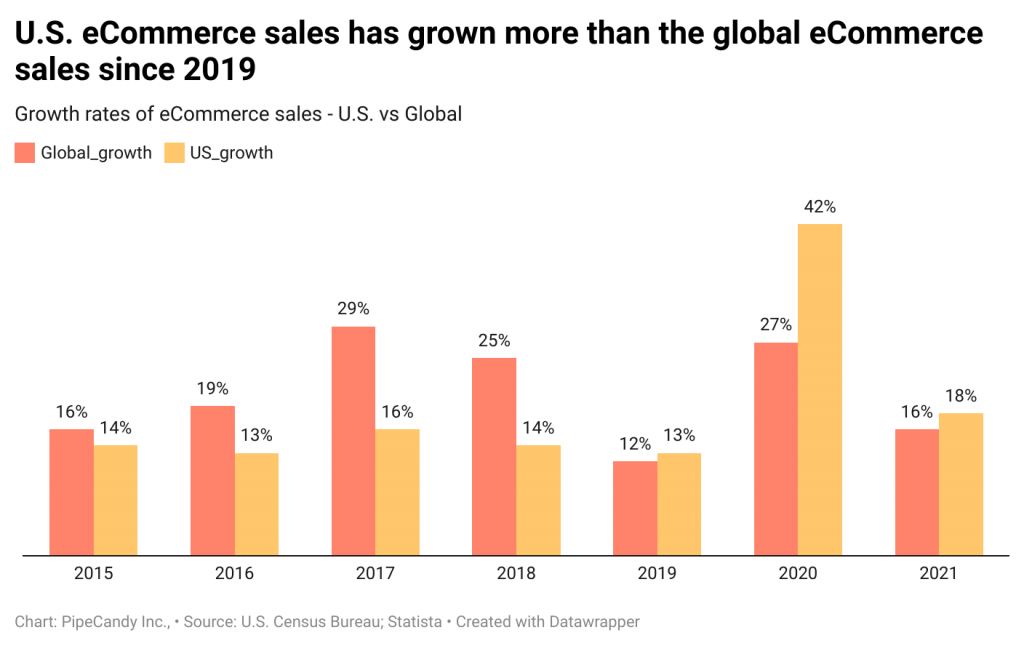
The global eCommerce market has more than tripled in the last seven years to reach USD 4.9T in 2021. The global eCommerce market which was growing at a CAGR of 20% till 2019, had a 28% growth in 2020. The growth rate is estimated to have come down to 14% in 2021.
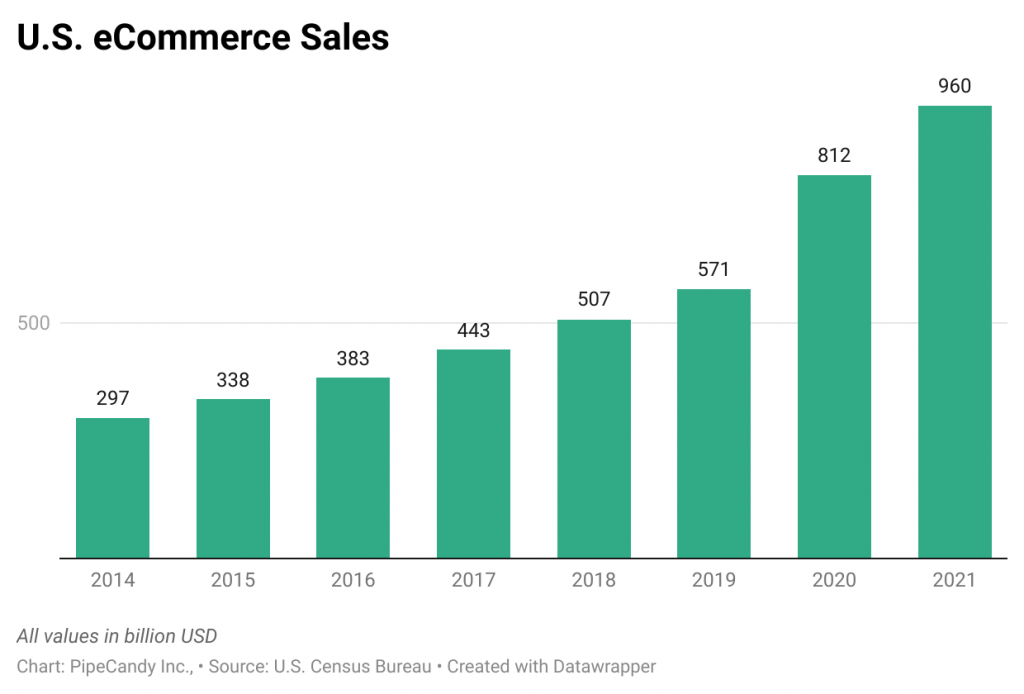
The US is the second largest eCommerce market with about a third of China’s eCommerce sales.
Until 2018, the US eCommerce market had been growing at a rate lower than the global eCommerce growth rate. Since 2019, the US eCommerce industry has grown at a faster clip than the global eCommerce market and the streak continued through the pandemic year where the eCommerce growth rates - both global and country-wise - more than doubled.
The US eCommerce market grew at a CAGR of 14% from 2014 to 2019 and at an annual growth rate of 42% from 2019 to 2020. The growth rate for 2021 was down at 18%. Post-pandemic, both the global and US eCommerce markets have adjusted back towards pre-pandemic growth rates.
How have retail and eCommerce sales been faring in the US?
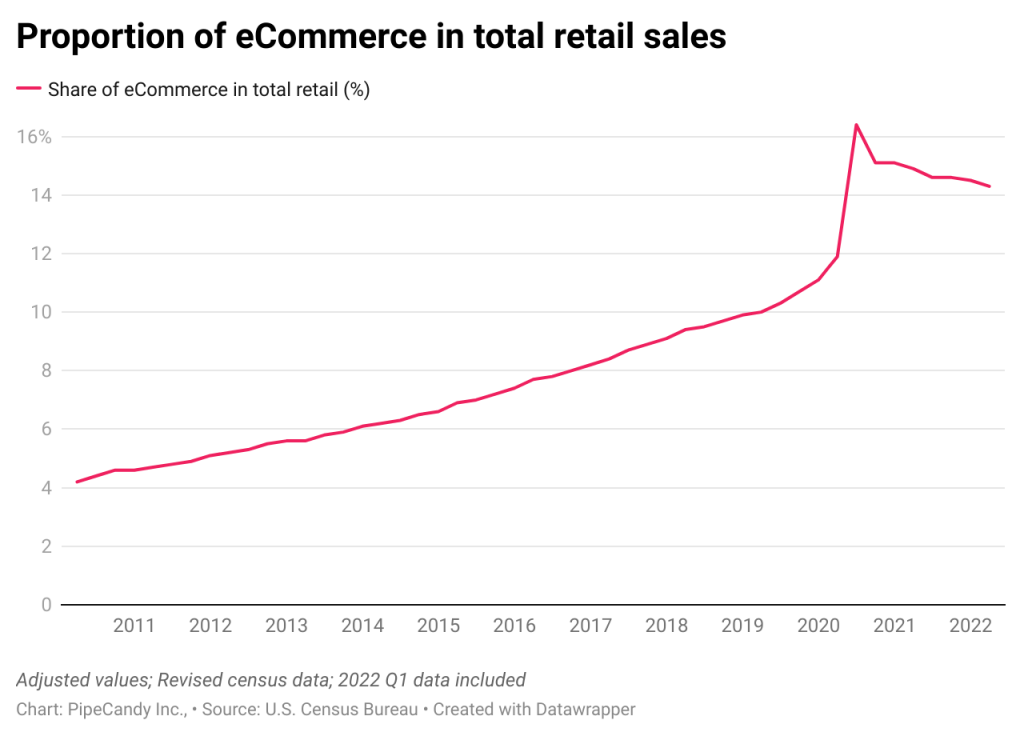
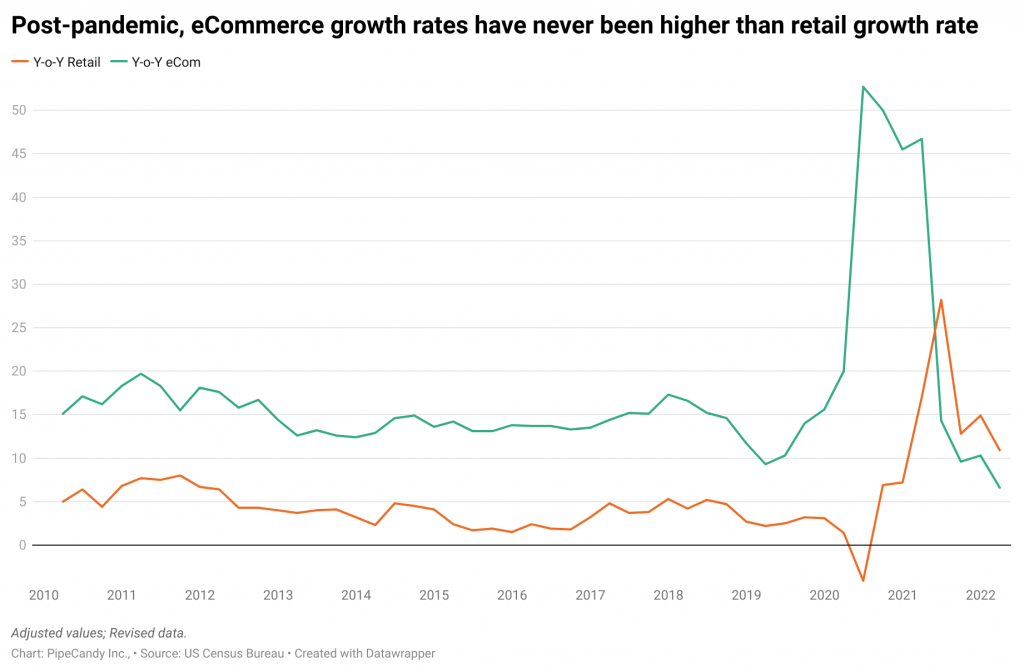
The share of eCommerce sales in total retail sales in the US had been increasing at a compounded growth rate of 14.2% from 2010 to 2019. The year-on-year growth rate increased to 31.4% in 2020. In 2021, the growth rate readjusted to 15%.
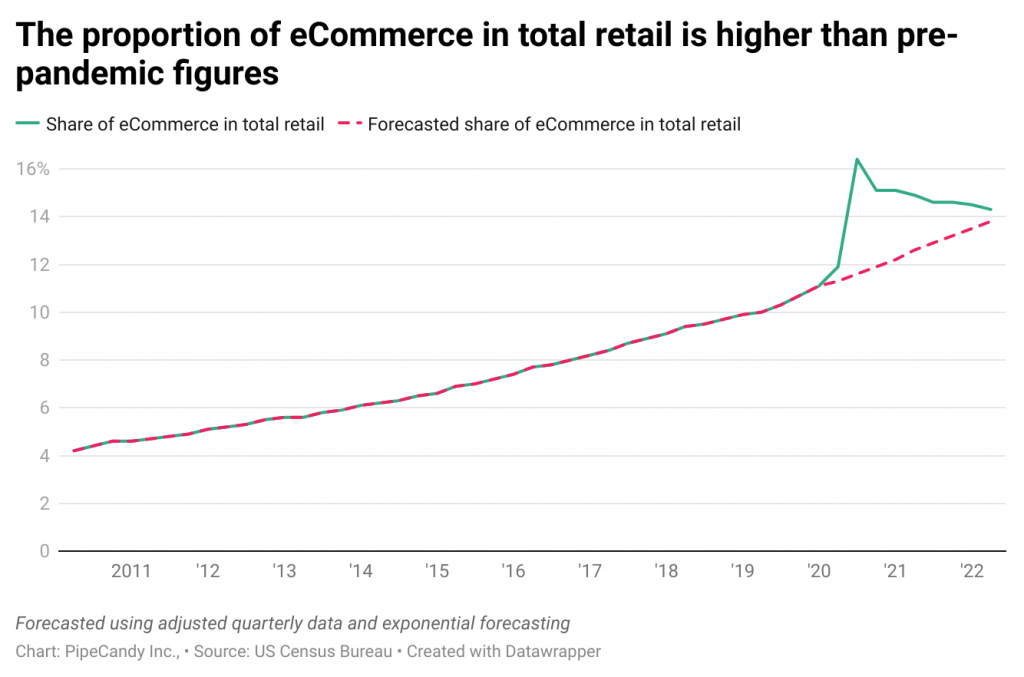
The chart shows that the sudden spike in eCommerce sales in 2020 has readjusted itself towards what eCommerce sales would have been if the pandemic had not struck. The eCommerce sector seems to have lost most of the pandemic-induced sales, though there are category-specific variations.
Until the pandemic, eCommerce sales had always grown at a higher rate than total retail sales. The difference between the growth rates of eCommerce and retail sales is more pronounced in 2020 when the pandemic-related restrictions forced physical stores to shut shop and customers turned to online purchases.
Ever since the restrictions were eased and physical stores reopened, the eCommerce growth rate has remained lower than the growth rate of retail sales.
Traffic to eCommerce and DTC
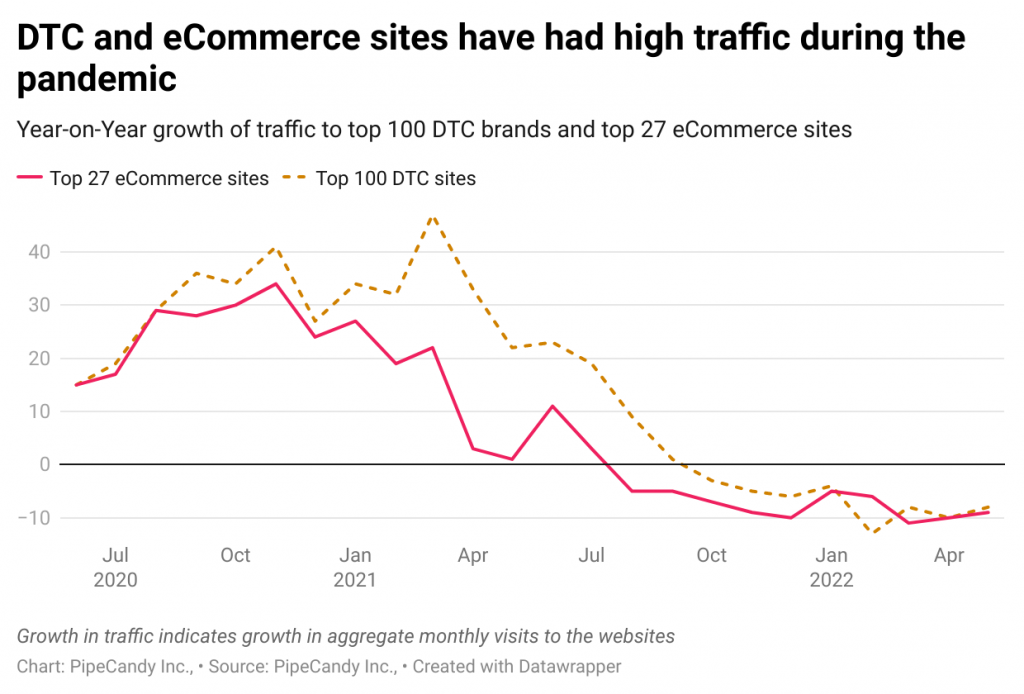
PipeCandy’s proprietary data corroborates the Census data that traffic to Direct-to-Consumer (DTC) and eCommerce sites has increased during the pandemic and is readjusting itself. Our traffic data is based on the number of monthly visits to the websites.
The year-on-year growth in web traffic has become negative during the second half of 2021. This confirms the readjustment that is happening in the eCommerce sector and is derived from an observation of the top 27 eCommerce sites (that account for 80% of all eCommerce sales in the US) and the top 100 DTC sites.
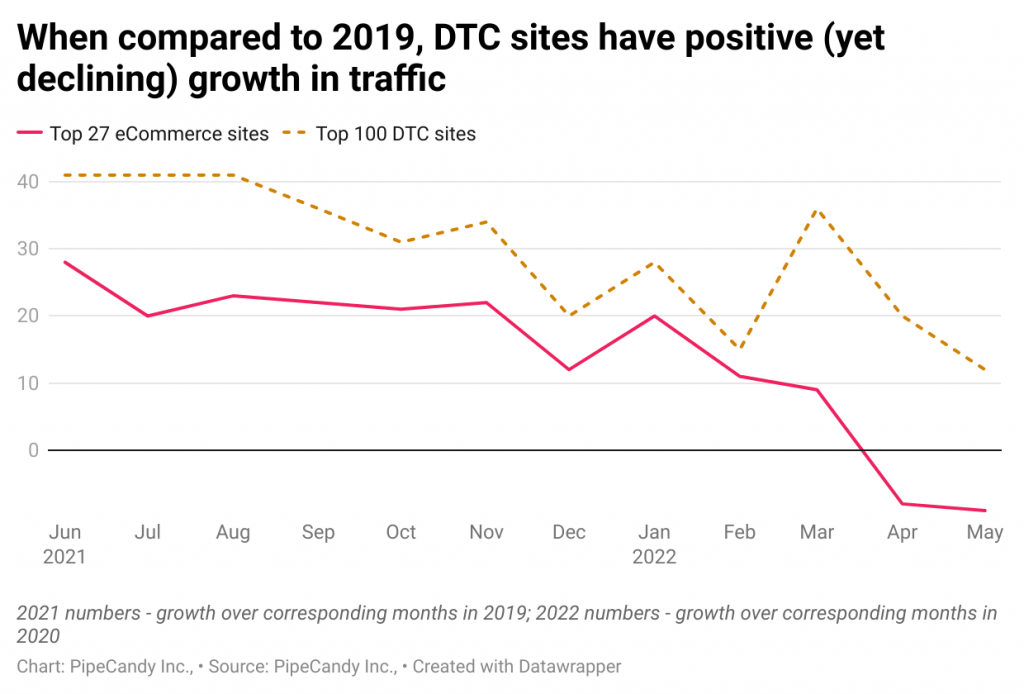
Despite the year-on-year decline, growth in traffic to DTC sites is higher than the pre-pandemic levels. The growth in traffic to the top 27 eCommerce sites during April and May 2022 has been lower than in 2020.
Economic Indicators
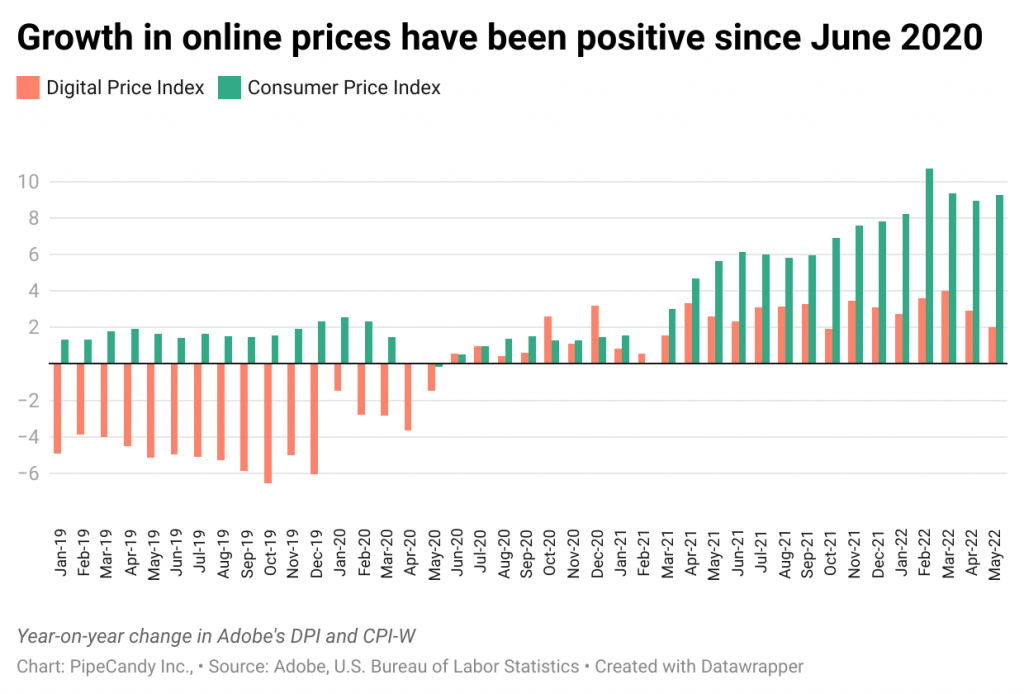
Online prices have been increasing
The Digital Price Index (DPI) has been on the rise since June 2020; Consumer Price Index has been increasing at a higher rate. The rise in online prices can be attributed to a variety of factors that include increased costs of shipping, warehousing, and customer acquisition, and issues with logistics, supply chain, and manufacturing.
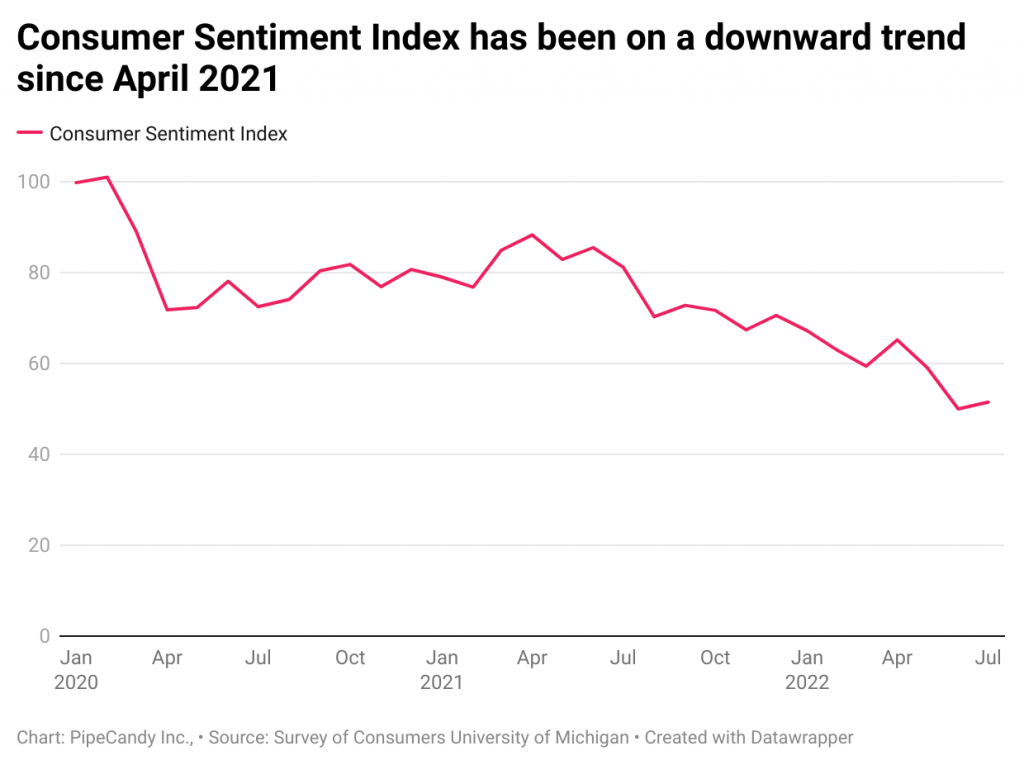
Consumer sentiment has been on a decline
The Consumer Sentiment Index, published by the University of Michigan, takes into account the [expected] financial standing of an individual in the past [upcoming] 12 months, their perception of how the economy has fared financially in the past 12 months, and how they expect it to be in the forthcoming 12 months, and whether they think if it is a good time to buy major household items like refrigerators and televisions.
Consumer sentiment in the US declined from about 100 points in January 2020 to about 50 points in June 2022, the lowest since 1952. While the Ukraine war and the resultant rise in the prices of gasoline initially contributed to the decline in consumer sentiment, high-interest rates, depleted personal savings, and low confidence in the economic policies of the government are playing a more significant role these days. The preliminary figures for August 2022 show 1.5 points increase in consumer sentiment, stemming from lower uncertainty over long-term inflation.
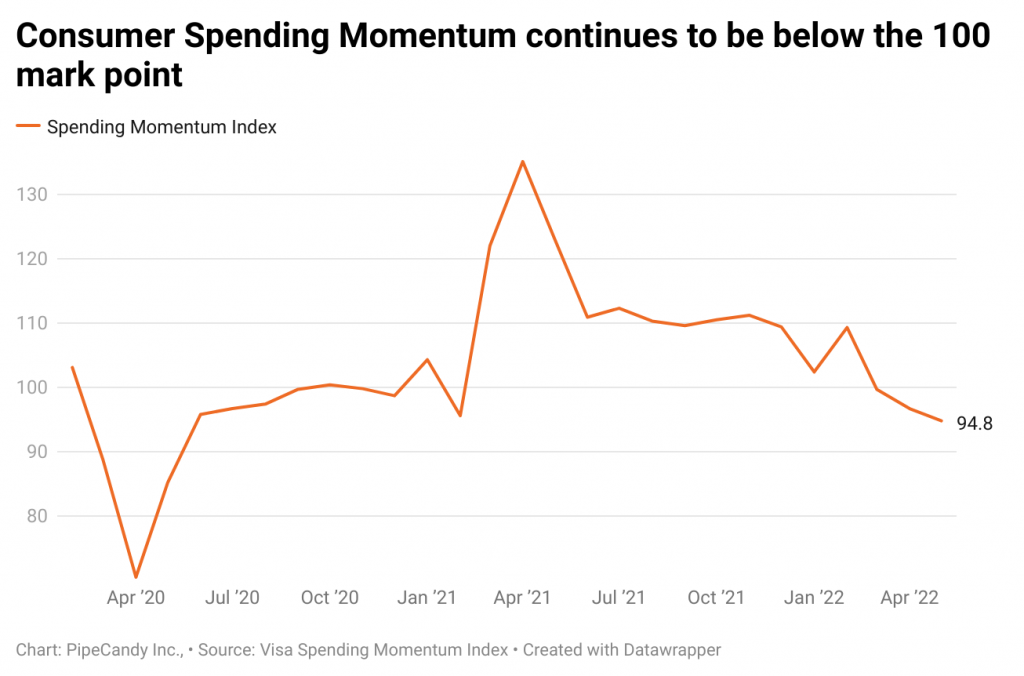
People are spending less than they did last year
The Visa Spending Momentum Index (SMI) is based on transaction details of millions of Visa-branded credit and debit cards. The transaction data is aggregated using a diffusion index framework where index values are scored from 0 to 200. When the Visa SMI rises above 100, the consumer spending momentum is strengthening and when it falls below 100, the spending momentum is weakening as fewer consumers are spending more relative to the previous year.
The SMI has been on a declining trend since April 2021, when the index peaked at 135. In May 2022, it was at a low of 94.8 breaching the 100 mark. This decline corresponds to the period between March to May 2021, during which the consumer spending index was above 120.
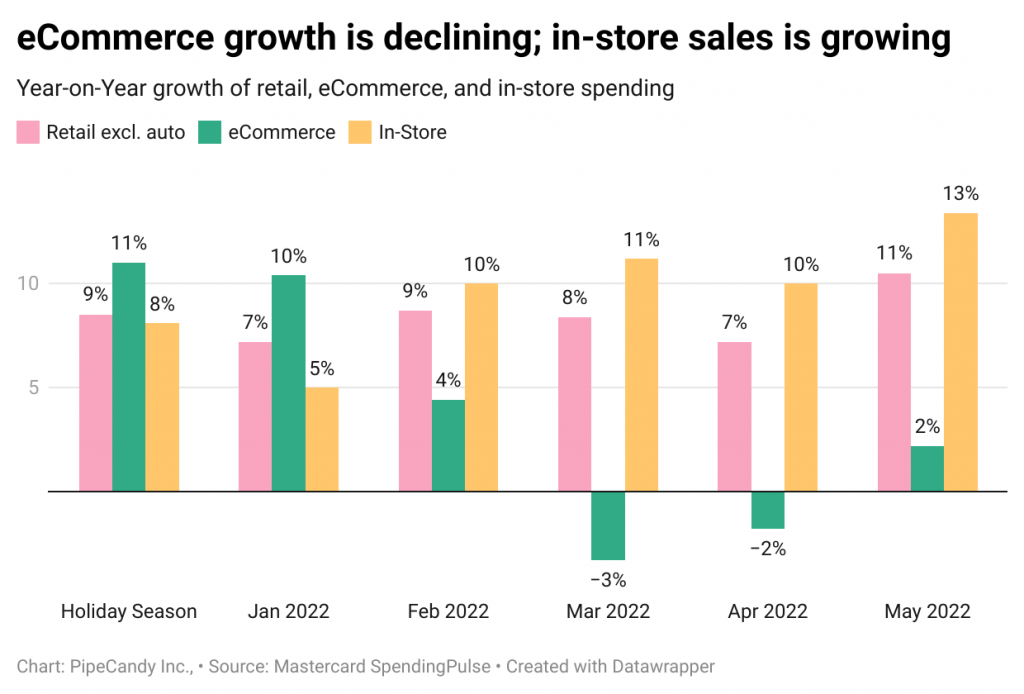
In-store sales is increasing
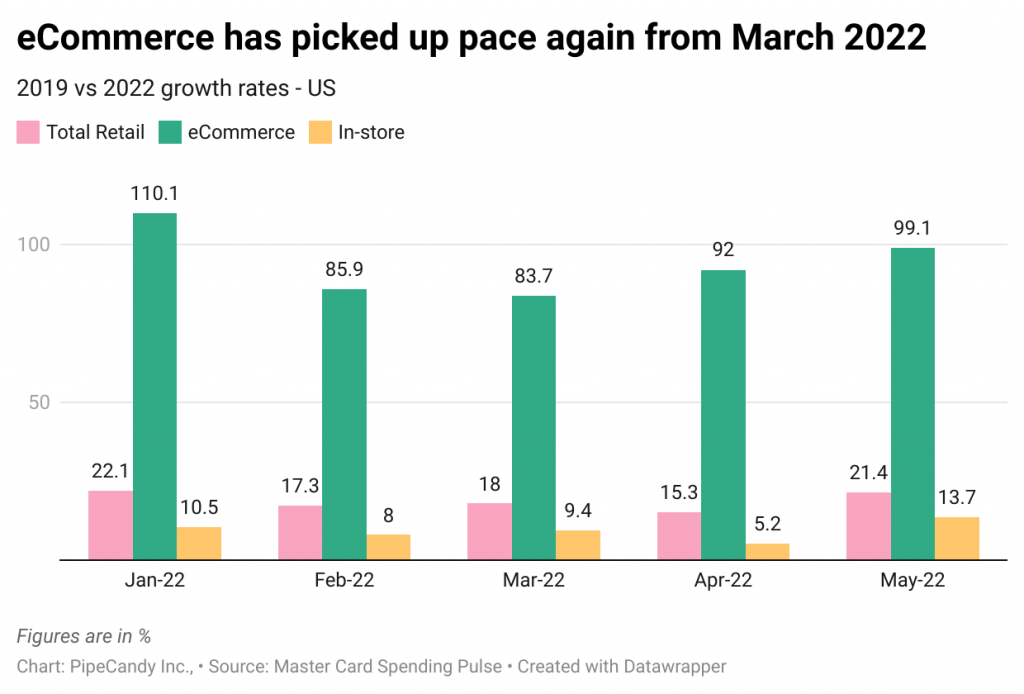
eCommerce spending has had a declining growth rate since the beginning of 2022. The growth of eCommerce sales was, in fact, negative in March and April. Despite the rebound of four percentage points in May, eCommerce sales continue to be on a declining trend.
Despite the drastic changes in eCommerce due to the pandemic, eCommerce is at a much higher level than where it was in 2019.
What does the future hold?
eCommerce grew disproportionately during the pandemic since physical stores remained closed. Once physical stores reopened (sometime around June 2021), the growth in traffic to DTC and eCommerce sites started declining. So did the share of eCommerce sales in total retail sales. The readjustments have happened. From here, the future of eCommerce will largely depend on the general economic conditions.
Inflation is at its peak; consumer sentiment has declined; in-store sales are rising; people are spending less than they did in 2021. Despite the decline in the year-on-year growth rates of eCommerce, sales via this channel remains well above the pre-pandemic figures.
At PipeCandy, we used quarterly, unadjusted retail and eCommerce data provided by the US Census Bureau from 2010 to 2019 to forecast how the proportion of eCommerce in total retail would have grown from Q1 of 2022. These [exponential] forecasted figures assume that the pandemic never happened and is based purely on the 2010 to 2019 trends. We plotted it against the actuals. The graph reveals that eCommerce did benefit heavily from the pandemic and currently enjoys a greater share of total retail than it would have otherwise.
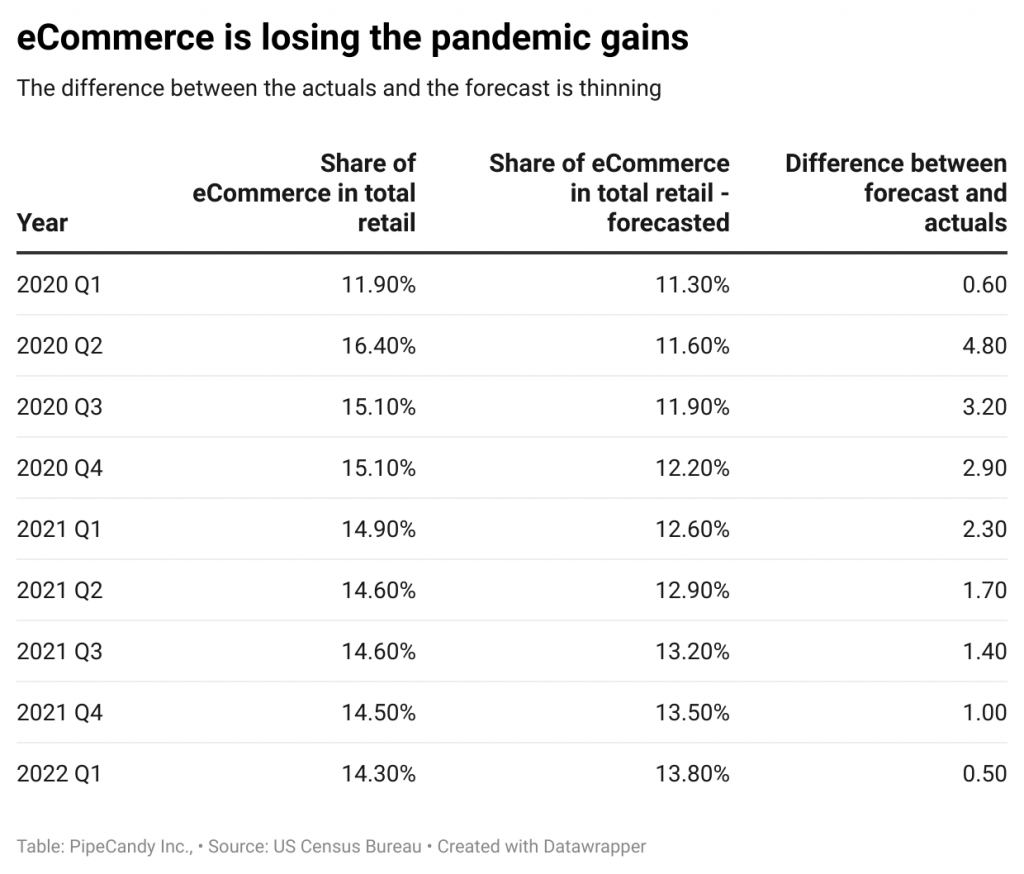
While it is indeed true that eCommerce currently accounts for more of total retail than it should have, it should be noted that eCommerce is losing its pandemic gains. We compared the actual share of eCommerce in total retail and the forecasted figures. The difference between these two values was as high as 4.8 percentage points in Q2 of 2020, from which it has continuously declined to a mere 0.5 percentage points in Q1 of 2022. This means that the share of eCommerce in total retail is almost where it would have been, had the pandemic not happened – the gains of the pandemic are almost washed out.
When eCommerce saw an unprecedented rise during the pandemic, eCommerce/DTC players and facilitators raced not only to deliver the increased volume of orders but also to deliver them in shorter periods of time. A great deal of investment went into acquiring more shipping containers, trucks, warehouse space, and warehouse technologies. These investments now serve several different purposes. For instance, Amazon is looking to sublet at least 10M square feet of warehouse space and end leases with landlords; and, Shopify has included B2B businesses in its Total Addressable Market. While companies have begun using new investments made during the boom for different uses, it is crucial for these players that most online shoppers who experimented with eCommerce during the pandemic continue to shop online. A lot seems to depend on how the economy fares in the near future.
How Retailers, Marketplaces, and Brands Weathered the Pandemic
Different types of merchants adapted themselves to the pandemic in different ways. As restrictions were placed on people’s mobility, many eCommerce sites started offering same-day delivery. Omnichannel retailers commenced curbside pickup and Buy Online and Pick up In-Store (BOPIS) services. Large retailers set up their own DTC channels. Many smaller businesses turned to marketplaces, leading to an unprecedented increase in new merchant signups on marketplaces.
To throw more light on how the pandemic transformed different categories of eCommerce players, this Report presents an analysis of the eCommerce sales and site traffic of Retailers, Marketplaces and Brands.
We find that Brands weathered the pandemic better than Retailers and Marketplaces. Brands have always had an online presence and that came to their aid when restrictions were imposed due to the pandemic. However, as the report reveals, the pandemic did not benefit all retailers and brands equally.
Well-known brands, large wholesale retailers, and big marketplaces benefited disproportionately, as they were able to better work around the inventory and shipping issues during the pandemic. For instance, the top four marketplaces - Amazon, Walmart, eBay, and Etsy - that account for 52% of all eCommerce sales in the US, experienced a Y-o-Y growth of 51% in 2020 and 65% in 2021. At the same time, over 700K B2C physical goods eCommerce companies saw a decline in their market share.
With rising inflation, grocers who had an Everyday-Low-Price (EDLP) strategy were more attractive to consumers than those that relied on promotions to attract customers.
US eCommerce - Pre vs Post Pandemic
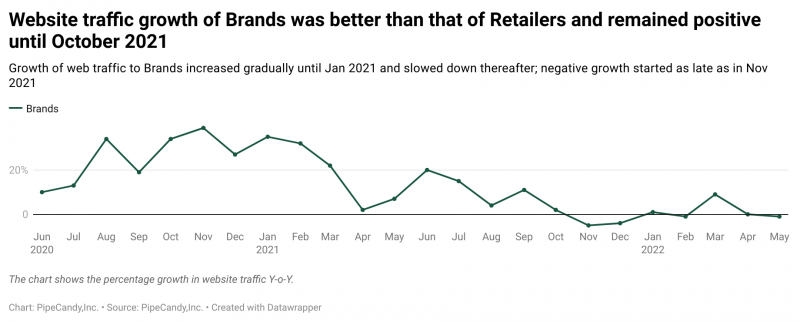
Brands had the most stable growth in web traffic, during the pandemic
The pandemic and related restrictions did not impact brands adversely, as they already had a strong foothold in the eCommerce market. When physical stores became a liability, they just turned their focus on online channels. In times of supply chain uncertainty, the first-party customer data they had on hand helped brands meet customer demands on time. Among the three categories, Brands were the most resilient throughout the pandemic. They had already entered the market with less reliance on physical outlets and hence managed to survive the pandemic better. Direct access to customer data helped them meet their demands on time.
The Y-o-Y traffic growth for brands such as Apple, Chewy, Gap, Nike, and Nordstrom was found to be more stable than it was for Marketplaces and Retailers. They enjoyed high traffic until Q1 2021 and negative traffic growth started as late as Q4 2021.
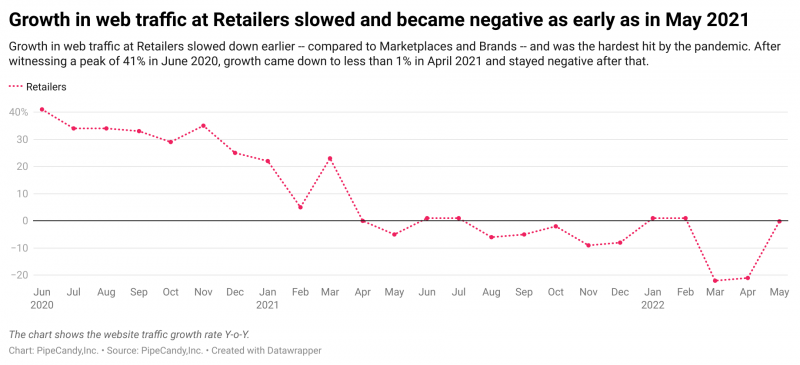
Large retailers became a one-stop shop for essentials
Large retailers quickly became people’s favorite stop for all essential items during the pandemic. Owing to their size, large retailers were able to efficiently work around the shipping and inventory shortage issues, thus making products available to customers on time. Target’s online sales grew 17% in 2020 over 2019 (4% in 2019 over 2018). Shopping with large retailers also meant that customers could purchase all their requirements from a single retailer.
When the pandemic-related restrictions were lifted, top retailers like Best Buy, JCPenny, Kohls, and Macy’s were also the ones to lose site traffic quickly. Traffic on their websites could very well have shifted to foot traffic in the respective physical stores, as customers strived to avoid delivery charges to accommodate inflated prices.
Traffic to Marketplaces spiked because of their range of product offerings
The revenue of Marketplaces such as Amazon, eBay, Etsy, Walmart, and Wish skyrocketed during the pandemic as people shifted to buying everything from face masks to grocery items to electronics online. In Q2 2020, while Walmart’s eCommerce sales increased by an unusually high 97% Y-o-Y, Amazon’s net sales rose by 40% Y-o-Y. Amazon was able to maintain around the same rate of growth for the next three quarters.
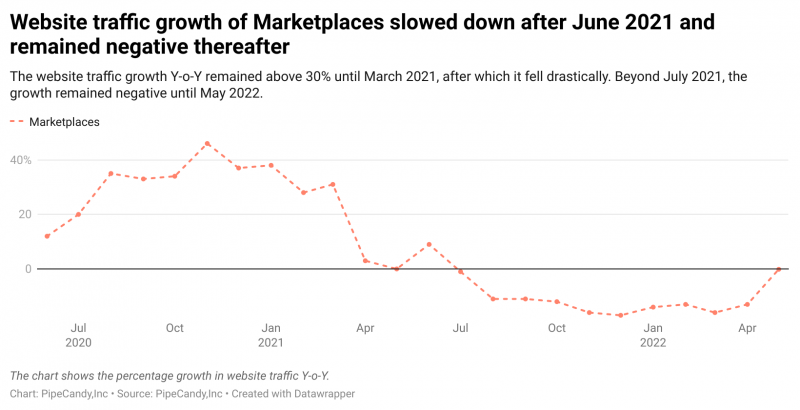
Post pandemic, their Y-o-Y traffic slowed down (except for June 2021) and became negative by August 2021. As consumers headed back to stores, planned travel, and engaged in outdoor entertainment activities, they visited fewer websites. In Q2 2021, the passenger load factor of US Air Carriers (domestic and international) increased by 70% Y-o-Y and Vehicle Miles traveled rose by 32% Y-o-Y.
Brands have had an extended growth over Retailers and Marketplaces
Traffic to the eCommerce sites of Brands has continued to remain high even during the post-pandemic period. In Q1 2022, the average traffic growth was 33% whereas the average growth rate in the last six months of 2021 was 32%. In April 2022, it fell drastically to less than 1%, but again started showing an upward trend after that
Product categories
According to the US Census Bureau, eCommerce sales in the Food and Beverage category had the highest Y-o-Y growth in 2021, followed by Health and Personal care, and Building and Garden supplies. When the pandemic restrictions were eased, people started venturing out, and started spending on travel, lodging, restaurants, and entertainment. By 2022, the excitement of lockdown relaxations receded, inflation hit 40-year highs, and people revised their spending behavior to focus on essentials.
Analyzing the top 27 eCommerce stores (that account for about 80% of all eCommerce sales in the US) and the top 100 DTC brands, we found that the online traffic for Brands, Retailers, and Marketplaces fell as consumers returned to in-store purchases for regular grocery shopping and fashion purchases. However, having witnessed the convenience of online shopping during the pandemic, it would continue to be popular among consumers.
US Retail Sales
Total Retail Sales
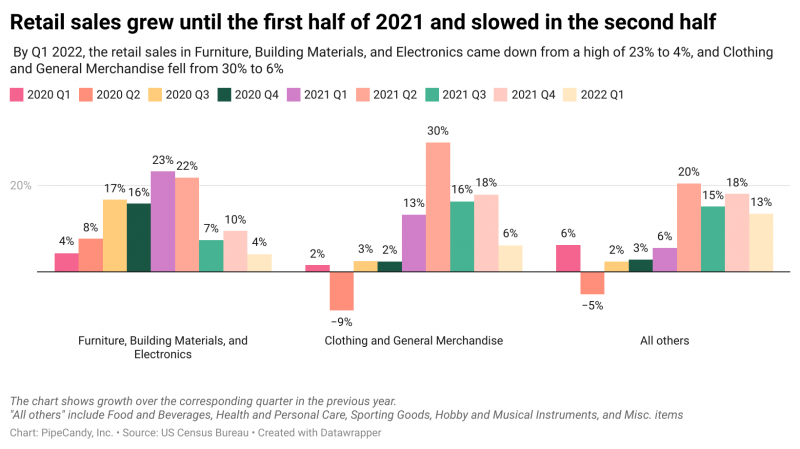
The retail sales in Furniture, Building Material, and Electronics grew in Q3 2020, continued the growth trajectory until Q2 of 2021 and declined thereafter. Retail sales in Clothing and General merchandise was moderate, except in Q2 2021, when they increased by 30% (Y-o-Y). In the same quarter, people returned to their daily physical activities and the demand for clothing and accessories increased drastically and leveled again.
eCommerce Sales
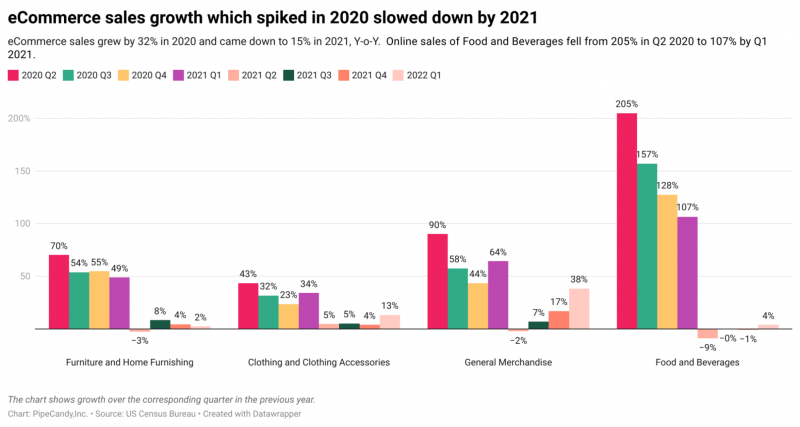
There was a flip in consumer’s spending patterns in product categories pre- and post-pandemic. When pandemic restrictions were enforced, people restricted their movement outdoors. This not only reduced consumer spending on Motor Vehicle Parts and Apparel, but also made people spend more on products related to Home interiors, Home offices, and Health and fitness. This expenditure was mostly made online as physical stores were closed then. Therefore, in 2020, there was a spike in the online sales of Electronics, Building materials, Garden equipment, General merchandise, Food and beverage, and Sporting goods. By 2021, the exponential growth in the web traffic of most eCommerce product categories slowed down as physical stores reopened and consumers embraced their pre-pandemic lifestyle
Fashion and Apparel
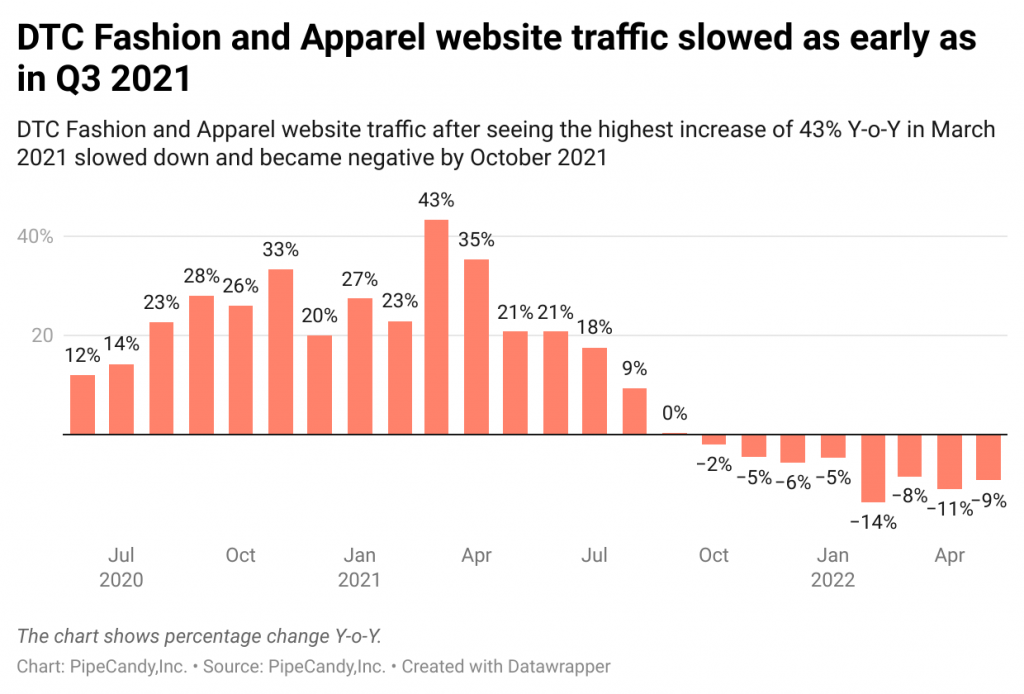
59% of all DTC brands in the US are in the Fashion and Apparel category, making it the most dominant product category. Unlike retailers in fashion and apparel who had negative growth in online traffic between Q3 2020 to Q1 2021, brands maintained an average growth rate of 28%. US consumers spent 16% more time on social media in 2020. The additional time spent online boosted brand-customer relationships - 72% of surveyed consumers, according to a McKinsey report, stated that they now interact with a brand online.
Website traffic to Fashion and Apparel brands witnessed the highest Y-o-Y growth in March 2021 at 43% and slowed thereafter until it became negative in September 2021. The growth rate has remained negative since then, majorly due to the extremely high traffic in 2020-2021, influenced by the pandemic. Fashion and Apparel being an industry where touch and feel dictate a purchase, another equally major reason would be the return of the customers to the physical stores.
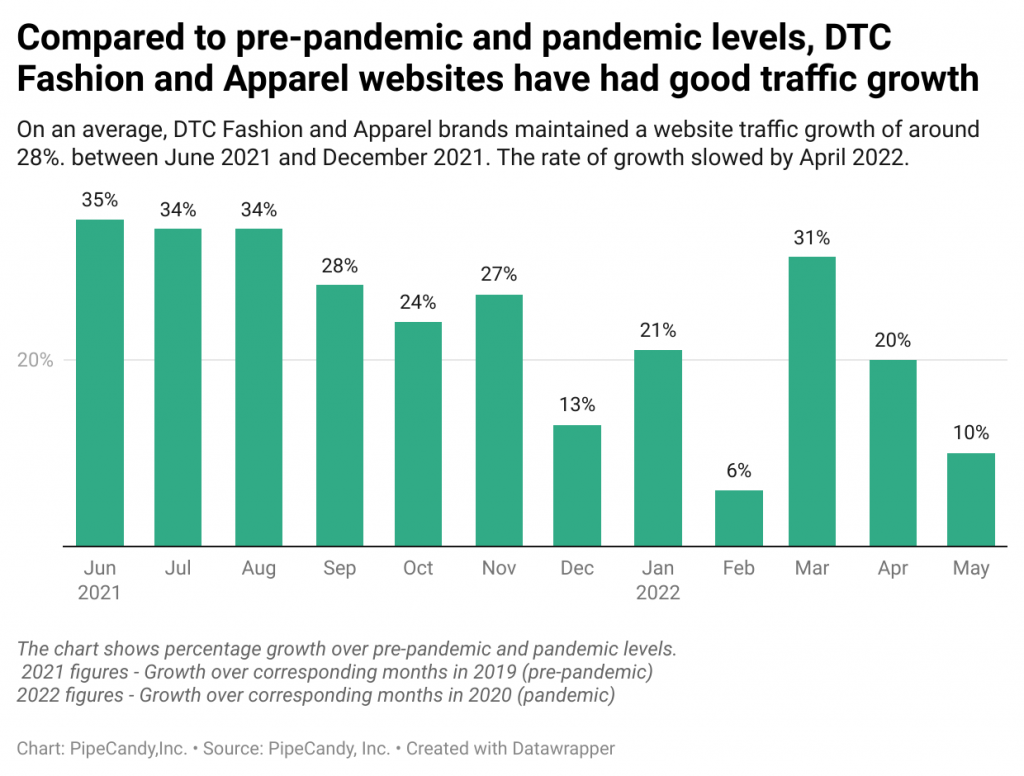
When compared to pre-pandemic levels, the growth in site visits has remained positive, indicating a more positive perception of online purchases of fashion and apparel than before the pandemic. Again, owing to the touch and feel of the requirement of fashion and apparel purchases, the traffic growth is not as high as it is for the product category of Electronics and Appliances.
Home and Garden
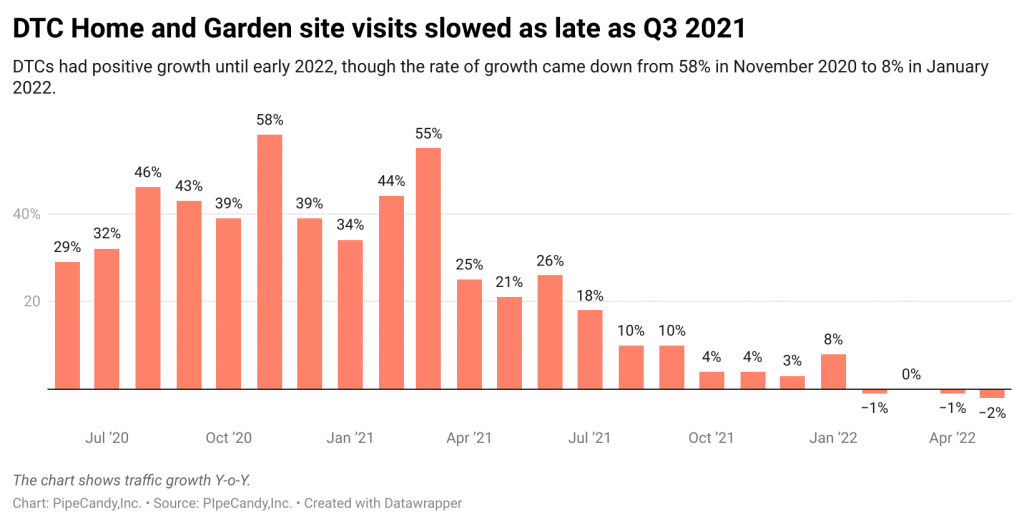
Home and Garden accounts for 7.6% of the US DTC merchant base. The traffic for the Home and Garden brands slowed down by April 2021 but had positive growth until January 2022. With more time spent at home, people turned to garden and home decor activities, which resulted in an increased demand for kitchen appliances and household items. Post-pandemic, as outdoor activities resumed, consumers' spending shifted to other categories such as apparel, footwear, gasoline, transportation services, food and accommodation services, etc. According to the US Bureau of Economic Analysis, while these categories saw negative growth in 2020, they started witnessing double-digit growth post-pandemic.
The yearly growth in traffic for Home and Garden DTCs continued to slow after May 2021. High prices forced consumers to prioritize essentials while they revised their spending patterns.
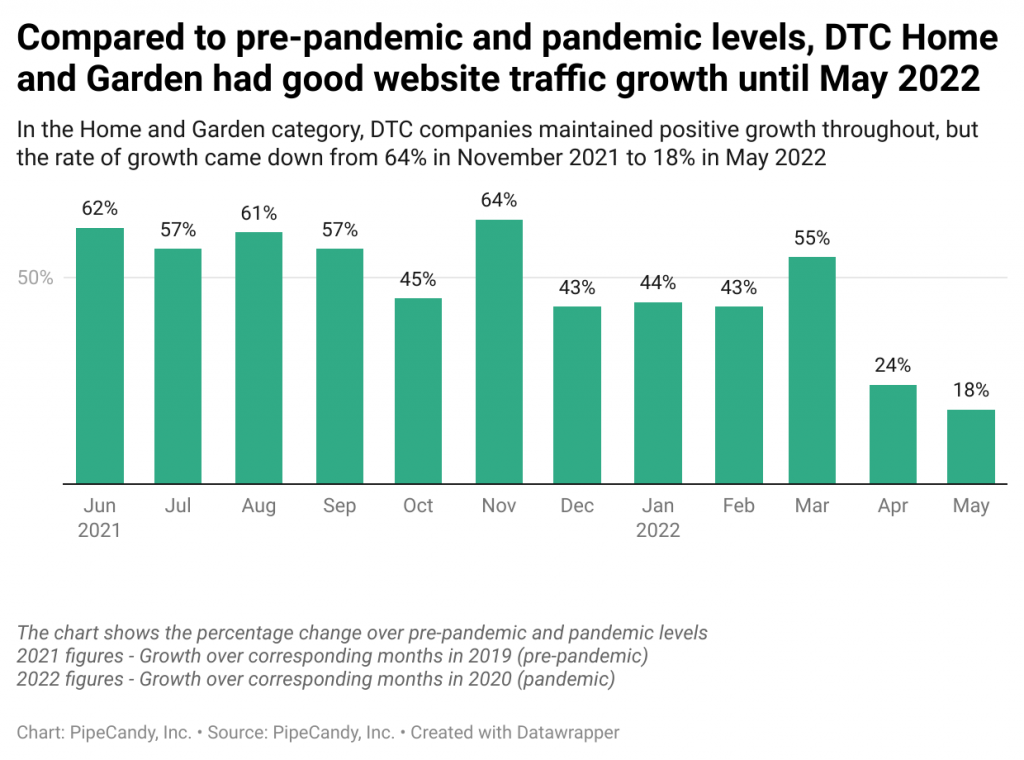
When compared to pre-pandemic levels, the category had a good traffic growth even until Q2 2022. This indicates that the pandemic has made people warmer towards purchasing Home and Garden products online that they continued visiting the respective sites.
Food and Beverages
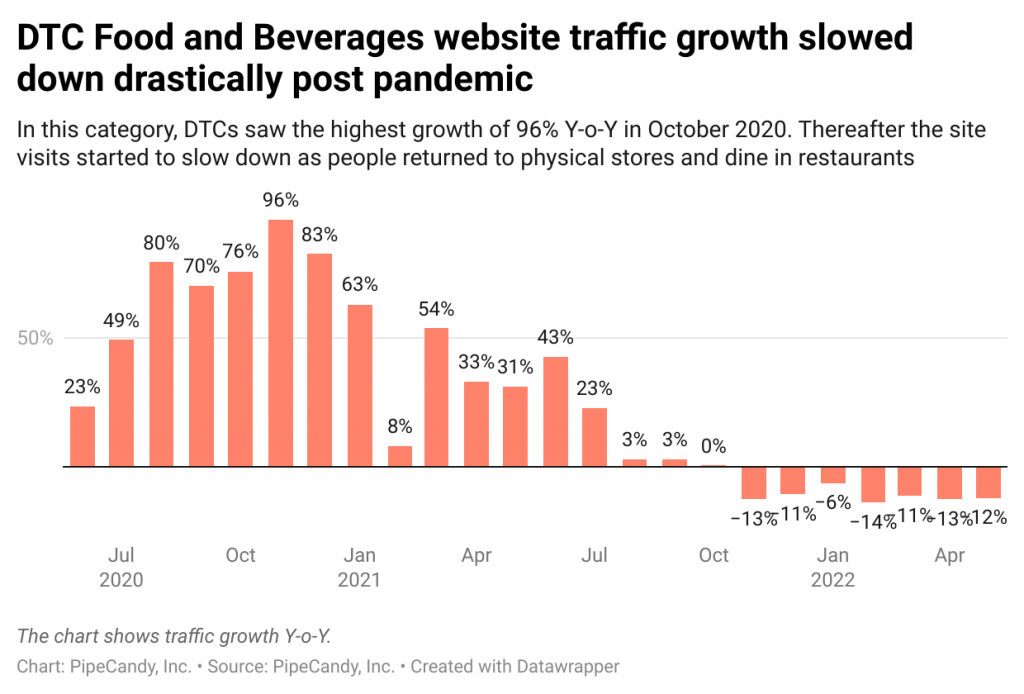
Food and Beverages accounts for 7.4% of the US DTC market. During the pandemic, consumers were more willing to try exotic drinks to overcome boredom while confined to their homes. Hence, the market was flooded with new flavored beverages. Inflation, strong savings, and the wish to try unusual flavors gave a boost to the demand for affordable private labels.
Brands in the Food and Beverages category which had traditionally relied on grocery retailers to sell their products started exploring the omnichannel route to boost their sales. Amidst the pandemic, Pepsi created two DTC sites PantryShop.com and Snacks.com and, Heinz launched ‘Heinz to Home’ where consumers could order directly from the comfort of their home. Food and Beverages brands enjoyed positive growth Y-o-Y until Q3 2021 after which, like other categories, their site visits reduced as outdoor activities resumed.
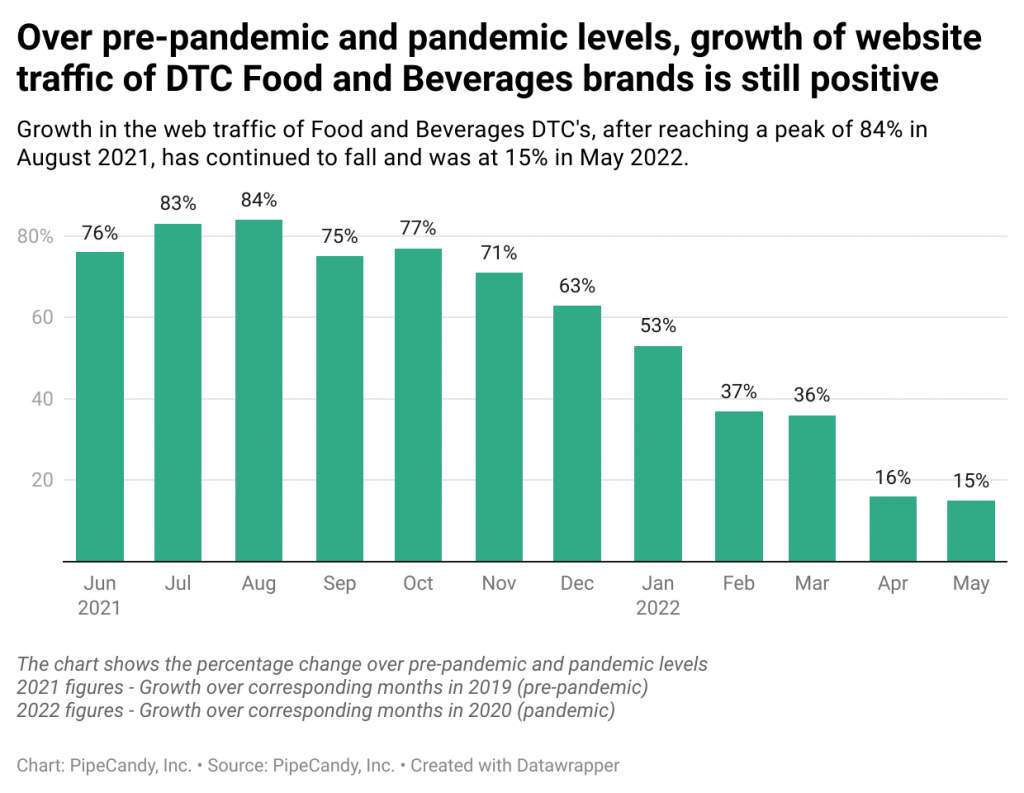
When compared to pre-pandemic levels, DTC Food and Beverages brands had a fair amount of traffic until May 2022, though it continuously slowed down. As consumers returned to outdoor activities, dined in restaurants, and traveled, they were spending less time browsing and purchasing online.
Consumer Electronics and Appliances
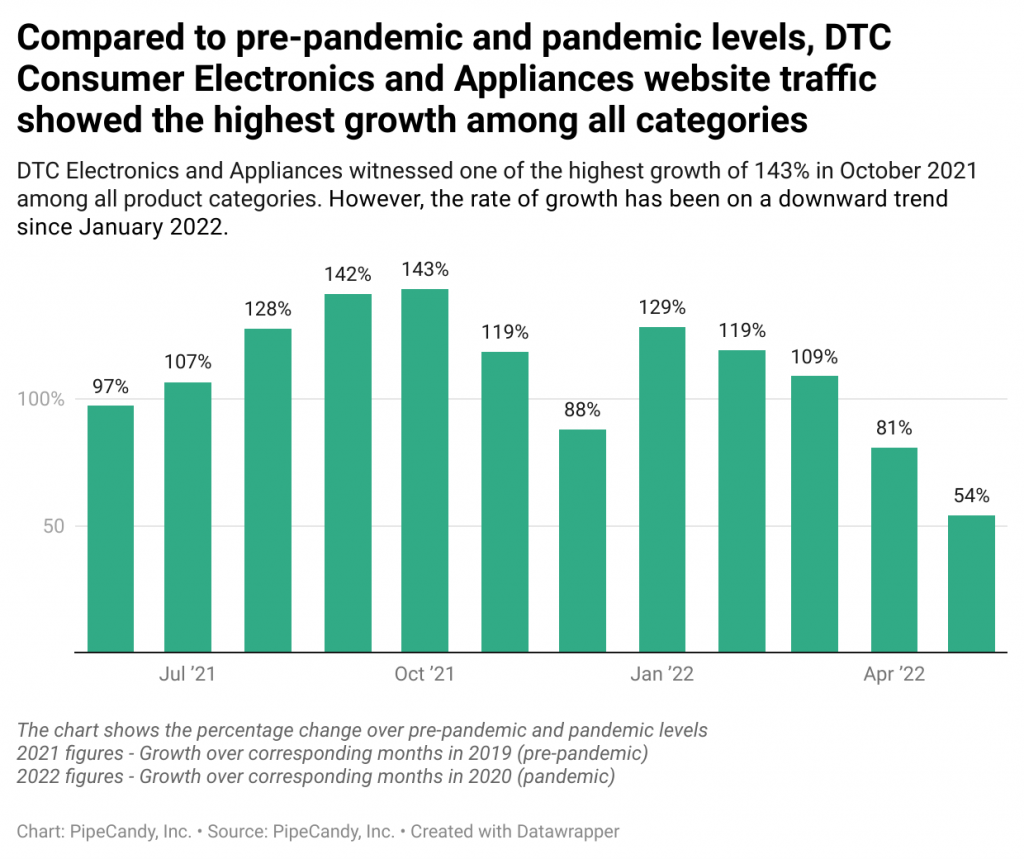
DTC brands in the Consumer Electronics and Appliances category remained strong through the pandemic. The highest Y-o-Y growth in web traffic for Consumer Electronics and Appliances brands was 151% in October 2020, after which it slowed down and hit 7% in March 2022
When compared to pre-pandemic levels, it had good traffic growth until May 2022. Though the rate of growth fell from its peak of 143% in October 2021 to 54% in May 2022 , the pandemic seems to have favored this product category the most.
Future Outlook
eCommerce saw unprecedented growth during the pandemic. Restrictions that forced people to stay indoors naturally led to people embracing online shopping like never before. Once the pandemic restrictions were eased and people started venturing out, physical retail started picking up speed. This meant a slowdown in eCommerce growth.
During the same period, costs associated with eCommerce - costs of customer acquisition, transportation, logistics - kept increasing. Supply chain constraints and manufacturing issues persisted. On the macroeconomic front, stimulus checks endowed people with higher disposable income. Combined with low unemployment rates and increasing wages, inflation gained strength. The proportion of eCommerce in total retail continued to decline. It is now at a level only slightly higher than what it would have been, had the pandemic not happened.
Food and beverages and Consumer electronics segments saw a massive increase in online traffic during the pandemic. Post-pandemic, while traffic slowed, they had good traffic growth as late as in May 2022, over pre-pandemic levels.
While eCommerce penetration in Computer and Consumer Electronics and Apparel and Accessories has been converging to the pre-pandemic levels, grocery is one of the categories where it still is above pre-pandemic levels. Food and Beverages’ share of eCommerce is 0.5% more than the forecast of 5%. Grocery as a category crossed double-digit penetration of 11% in 2021, close to the overall eCommerce penetration of 15%. The category saw a huge influx of new grocery eCommerce buyers during the pandemic. Post pandemic, many consumers have continued to shop groceries online.
The demand for the Fashion and Apparel category remained high in 2021 as consumers bought workwear, formals and eventwears. However, the pendulum shifted in favor of physical store purchases.
Consumers’ real spending on goods remained unchanged in June 2022 over the previous month but was down 3% Y-o-Y. While the spending on durable goods has been flat since mid 2021, for non durables it has trended down since the beginning of 2022.
Despite the slowdown in eCommerce, retailers and brands who have seen a peak in their online sales during the pandemic will continue to reach out to customers through omnichannels and get closer through DTC methods.
As retailers clear off excess inventory accumulated during the pandemic times, promotional activities seen in July 2022 will continue to be an important strategy in the near future.
Methodology
Traffic to the website - Traffic Rank is an indicator of the popularity of a website. It is calculated based primarily on the number and frequency of visits / sessions to a website in a month.
Retailers - Retailers sell multiple brands, in addition to selling their products/brands. In this report, we have used data from the following retailers - Best Buy, Dick’s Sporting Goods, JCPenney, Kohls, Kroger, Lowes, Macy’s, Staples, Bed Bath & Beyond, Costco, The Home Depot, Newegg, Office Depot, Sam’s Club, Target, Walgreens and Wayfair.
Marketplaces - Marketplaces are platforms that enable third-party sellers to list their products on the marketplace. They may provide additional services like advertising and logistics. While we classify Amazon as a marketplace, Target is classified as a retailer. This is because Target allows third-party sellers only by way of invitation and also is the deciding authority on how, when, and where the product is displayed. Our analysis of marketplaces is based on the traffic data of Amazon, eBay, Etsy, Walmart, and Wish.
Brands - Brands are online stores that sell only their products. They do not sell products of other brands. In this report, we have analyzed data of the following brands - Apple, Chewy, Gap, Nike, and Nordstrom.
Economic indicators
Consumer Price Index - The Consumer Price Index (CPI) measures the change in prices paid by consumers for goods and services. The CPI reflects the spending pattern of consumers. The CPI-W population represents about 29 percent of the total U.S. population and is a subset of the CPI-U population.
Consumer Sentiment Index - The Consumer Sentiment Index, published by the University of Michigan, takes into account the [expected] financial standing of an individual in the past [upcoming] 12 months, their perception of how the economy has fared financially in the past 12 months and how they expect it to be in the upcoming 12 months, and whether they think if it is a good time to buy major household items like refrigerators and televisions.
Data from the US Census Bureau - We have used quarterly eCommerce time series data from the US Census Bureau to understand the state of the retail and eCommerce industry in the US, the growth of eCommerce in recent years, category-level growth of eCommerce sales, and the growth in the proportion of eCommerce sales in total retail.
Digital Price Index - Digital Price Index (DPI), released by Adobe, provides the most comprehensive view of how much consumers pay for goods online. It analyzes one trillion visits to retail sites and over 100 million SKUs across 18 product categories. The DPI is modeled after the Consumer Price Index (CPI), published by the U.S. Bureau of Labor Statistics, and uses the Fisher Price Index to track online prices. The Fisher Price Index uses quantities of matched products purchased in the current period (month) and a previous period (previous month) to calculate the price changes by category.
Mastercard SpendingPulse - Mastercard SpendingPulse reports on national retail sales across all payment types in select markets around the world. The findings are based on aggregate sales activity in the Mastercard payments network, coupled with survey-based estimates for certain other payment forms, such as cash and check.
Mastercard SpendingPulse defines “U.S. retail sales” as sales at retailers and food services merchants of all sizes. Sales activity within the services sector (for example, travel services such as airlines and lodging) are not included. We have used data from Mastercard SpendingPulse to understand the diverging trends between eCommerce and in-store sales in the US.
Visa Spending Momentum - The Visa Spending Momentum Index (SMI) is an economic indicator of the health of consumer spending. When the Visa SMI rises above 100, the consumer spending momentum is strengthening and when it falls below, the spending momentum is weakening as fewer consumers are spending more relative to the previous year. We have relied upon the Visa SMI to analyze patterns in consumer spending over some time.
