
If you’re putting a social media strategy into place, you need the means to track your performance and see how your audience is receiving your content.
While there are a number of social media analytics tools to choose from, Twitter Analytics is a completely free tool that can help you get the most out of your Twitter presence.
With Twitter Analytics, you can track your most popular tweets, growth in followers, engagement rate, and more. We’ve created a complete guide to help you learn how to use Twitter Analytics and which metrics you should be tracking.
How to Use Twitter Analytics:
What Are Twitter Analytics?
Twitter Analytics is a completely free analytics tool that lets you dive deeper into the performance of your tweets and your Twitter profile as a whole.
This includes things like likes, retweets, followers, quote tweets, and more. Having an idea of which types of content your audience prefers can help guide and adapt your strategy so you’re publishing optimized content that generates results.
Why Track Twitter Analytics
We’ve touched on this lightly, but let’s talk benefits. Why should you track your analytics? What can they tell you? Let’s cover a few of the top reasons you should be tracking your insights and analytics.
Understand what content your audience prefers.
If you regularly track your tweets’ performance, you’ll soon be able to discover which types of tweets generate the most impressions and the most engagement. Obviously, this means your audience prefers that type of content.
Gathering this data can help direct your strategy and ensure you stick with tweets that will reach the most people and increase your engagement and audience size.
Track your overall growth.
Twitter Analytics makes it easy for you to track how far you’ve come, from sending that first tweet ‘til now. Watch how your followers have grown, your tweet impressions, reach, engagements, and more.
Plus, you can export your data into a CSV to upload into your own social media dashboards for further analysis.
Find the best time to tweet.
Access the Twitter Media Studio to track audience insights and find out the best time of day to tweet based on when your specific audience is most active.

Source: media.twitter.com
The darkest blocks are during the best time frames to create new tweets. While there are best practices based on overall Twitter activity, knowing the best time to tweet based on your followers can help improve your performance.
How to Access Twitter Analytics
Accessing Twitter Analytics is easy. When you’re on the desktop Twitter app, click the More button in the left-hand navigation, then click Analytics.

From here, you’ll be taken to the main analytics dashboard where you can check your progress and monthly stats.

You can also simply type analytics.twitter.com in your browser to head directly to the analytics app.
8 Twitter Metrics to Track
Now that you know how and why to access your Twitter analytics, let’s cover some of the top metrics you need to track, how to find them, and what they mean for your overall performance.
1. 28-Day Summary
The first section in your Twitter analytics will be the 28-day overview of how your Twitter marketing strategy is playing out.
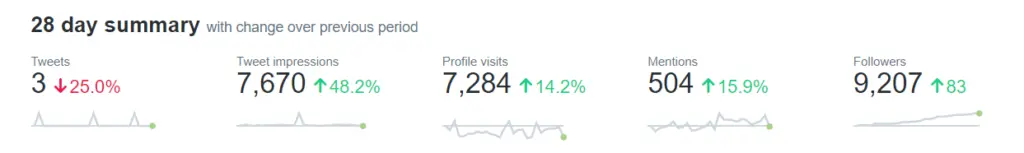
In this quick overview, you can see the number of tweets you wrote along with the number of impressions, profile visits, mentions, and Twitter followers you received within the last 28 days.
This appears alongside a comparison to the previous 28 days to let you know if your Twitter performance has increased, decreased, or remained stagnant. These won’t always have positive numbers, but you do want to work to see a general increase over time.
2. Monthly Overview
If you scroll down on your main analytics dashboard, you’ll see a monthly performance overview with your top tweet, mention, follower, and media tweet from each month.
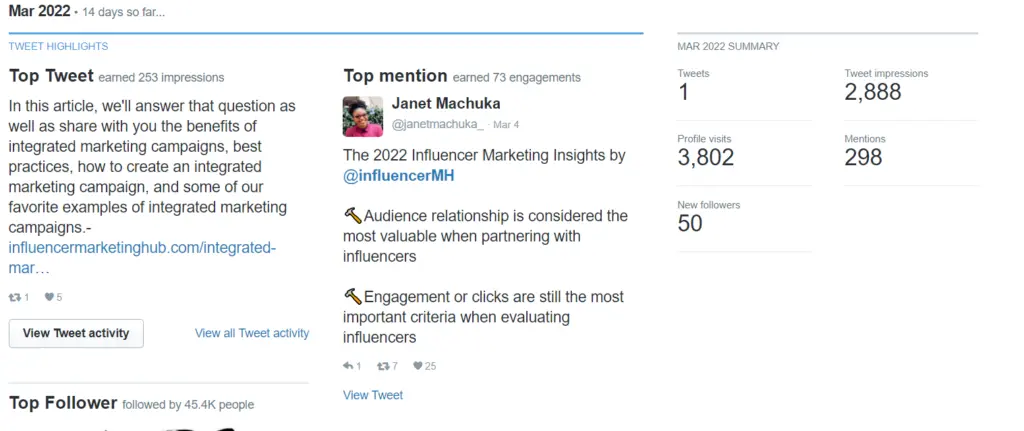
Scroll back through each of the months to see if you can find any trends across your most popular tweets. Make note of these so you can continue to tweet that type of content each month.
On the sidebar, you’ll also get a nice overview of the month’s total metrics. How many tweets you published, how many impressions they got, how many times users visited your profile, how many mentions you received, and how many new followers you gained.
As you scroll, you can compare month to month to make sure your monthly metrics are steadily increasing, proving that your Twitter strategies are working.
3. Impressions
In the top navigation bar, click Tweets to access metrics for your individual tweets. At the top, you’ll see how many impressions your tweets have gotten during the selected time period.
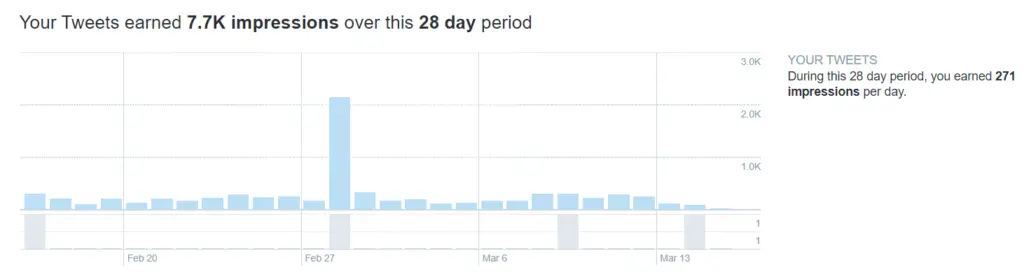
It’s automatically set to 28 days, but you can customize to view whatever time frame you’re measuring.
Your impressions tell you how many times your tweets have been seen. Here, you’re able to see the total number of impressions your tweets have received as well as a daily average based on your selected time period.
As you scroll down, you can see data from your individual tweets, with the first column showcasing the number of impressions for each of your tweets.
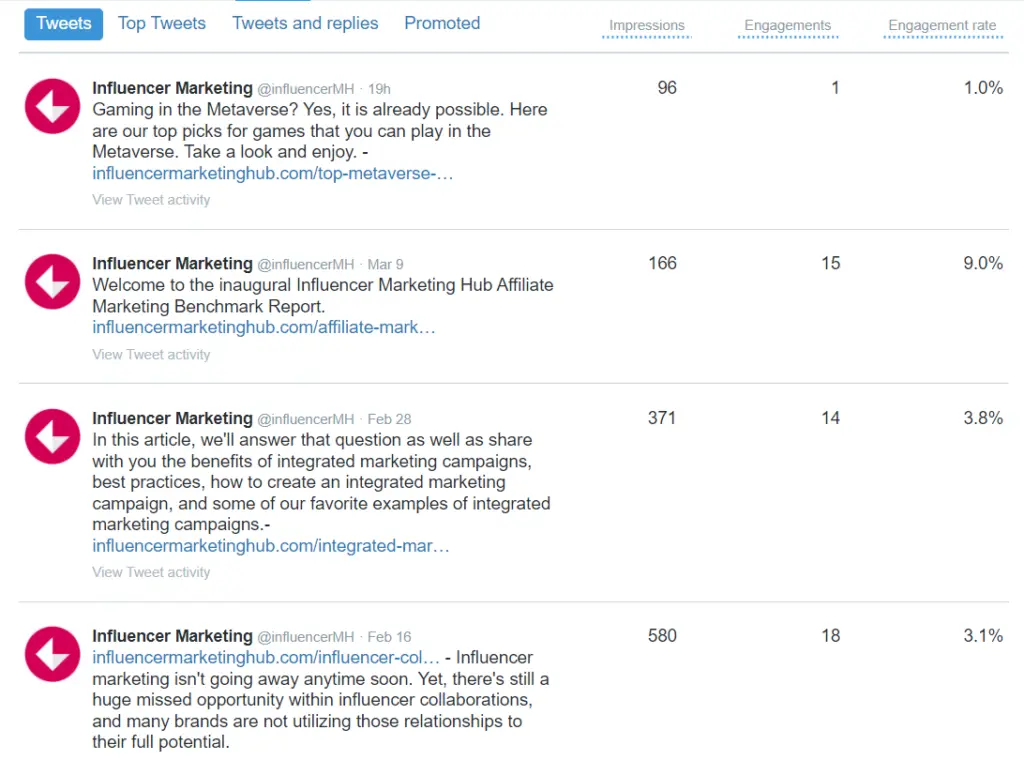
This tells you how many times each of your tweets has been seen by other users.
4. Engagements
In this same area, you can also see the number of total engagements each of your tweets have received in your selected time frame.
This could be anything from clicks or likes to retweets or replies. We’ll talk more about the various types of engagement shortly.
When you see each engaging tweet, pay attention so you can publish similar content in the future and see if you get the same results.
5. Engagement Rate
And the final column next to each tweet showcases your engagement rate. This is an important metric to track, and Twitter makes it easy by calculating it for you.
Your engagement rate = engagements / impressions.
Obviously the higher the engagement rate, the better the tweet’s performance. You want as many people as possible to engage with your tweet. If you’re noticing that a lot of people are seeing your content, but no one is interacting with you, you may need to adjust your social strategy a bit.
While on the subject of calculating, we have a Twitter Money Calculator that helps you figure out how much your tweets are worth.
6. Engagement Types
If you click on one of the tweets in the list, you’re able to see a more detailed view of your tweet activity.
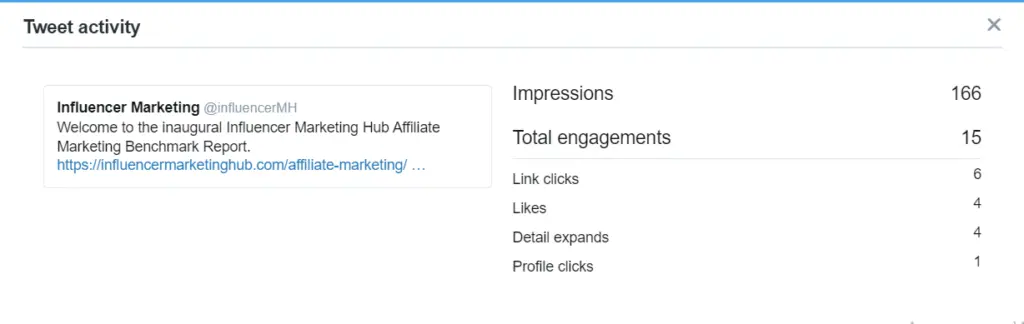
Here, total engagements are broken down into different types so you’re able to get an idea of exactly how people are interacting with your content.
Engagement types include:
- Detail expands: The number of people who clicked on your tweet to learn even more. They may be interested in seeing responses, or what else you posted if the tweet was part of a thread.
- Media engagements: The number of people who clicked on the media accompanying your tweet, i.e., if you shared a photo or video. Your photo may have been cropped on their screen, so they wanted to get a closer look.
- Likes: The number of people who liked your tweet. It’s a sign of interest, appreciation, or support for your content.
- Replies: The number of people who responded to your tweet. This is a sign that the content was interesting enough for someone to comment on it.
- Retweets: The number of people who retweeted your content, or shared it onto their own profile. This is a sign that someone appreciated your content so much, they wanted to share it with their own followers.
- Link clicks: The number of people who clicked on a link accompanying your tweet. It’s a good idea to keep an eye on this to see how often people are clicking what you’re sharing—especially if you regularly share blog posts and webpages from your site.
- Profile clicks: The number of people who clicked over to visit your profile. This could be to see your other tweets or to learn more about who you are and what you do.
- Follows: The number of people who followed you from a specific tweet.
Look at your total engagements as well as how they’re broken down to understand how people are interacting with different tweets.
7. Average Tweet Performance
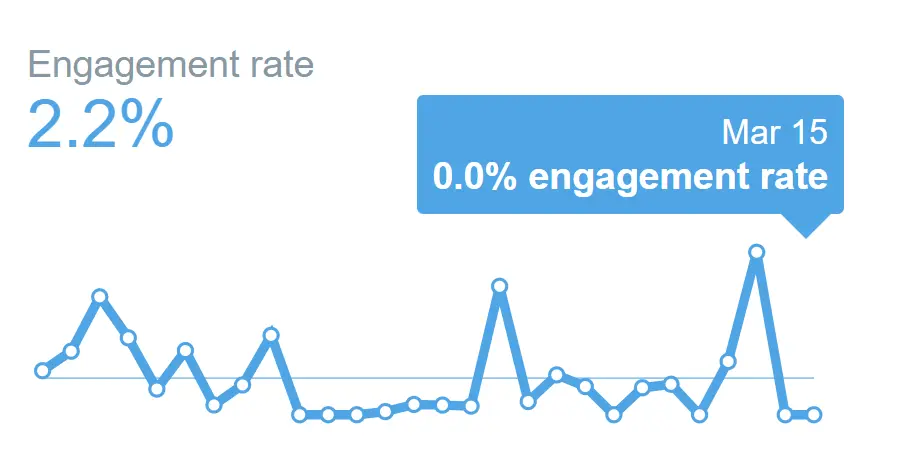
Another great metric to pay attention to is your average tweet performance in the right sidebar. Here, you can view mini graphs showing your engagement rate, link clicks, retweets, likes, and replies over the time period you’ve selected, along with a daily average.
At the top, you’ll see your average tweet engagement rate and how it’s progressed over the last 28 days (or whatever time period you’ve selected).
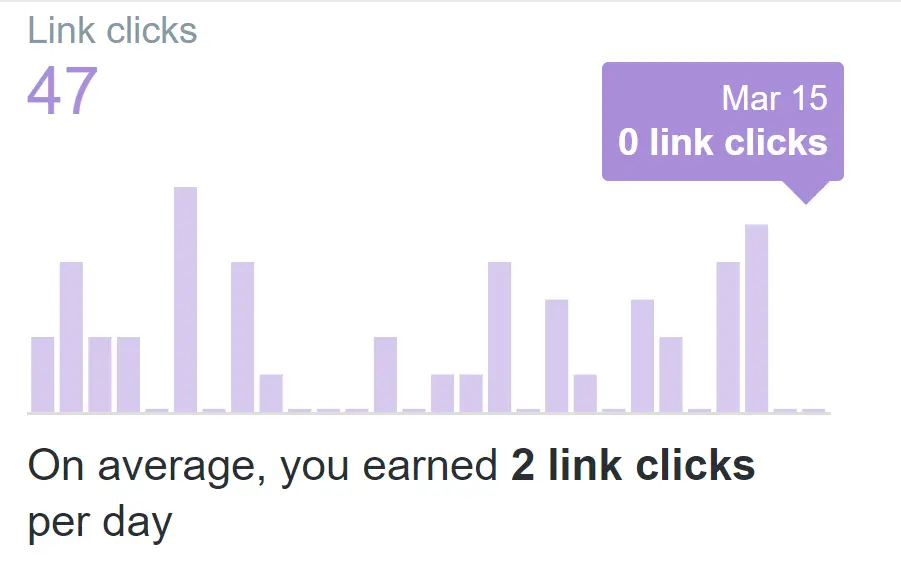
The next section shows off your total link clicks, a bar graph showcasing how many you received each day, as well as a daily average.
Below link clicks, you can view your retweet data. Again, you have your total retweets, a mini bar graph with daily numbers, and your daily average.
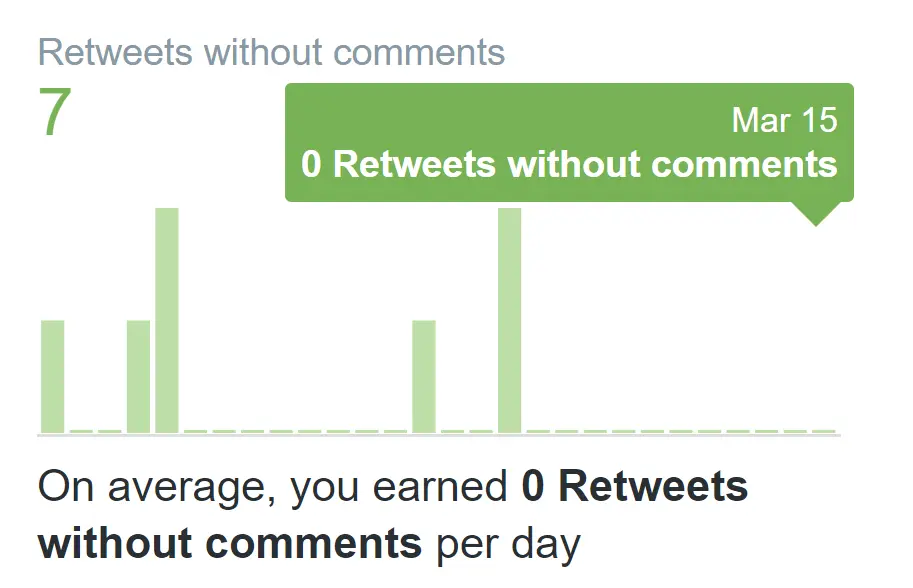
When it says “Retweet without comment,” it means this is people who opted to simply “Retweet” rather than “Quote tweet.” Here’s an example of the two options below:

The fourth section covers your total, daily, and average likes.

And finally, you have data on your total, daily, and average replies.

These numbers will always vary day-to-day, but it’s a good idea to keep an eye on them to ensure you’re consistently getting good engagement with your tweet content.
8. Top Tweets
Underneath the impressions table, select the Top Tweets option from the subnavigation menu to view metrics on your most popular tweets from your selected time frame.
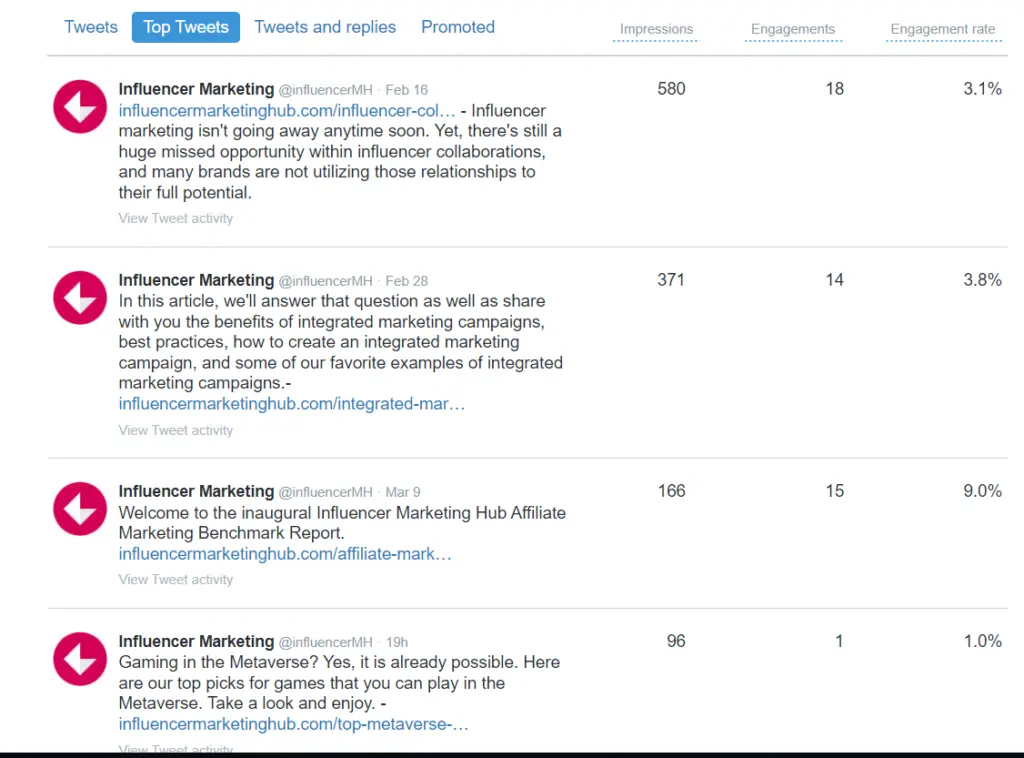
See the number of impressions and engagements, as well as the engagement rate of each individual tweet. And again, click on each of your top tweets to see the different types of engagements that were made.
Being able to hone in on your best tweets can help direct your social media marketing strategy and make sure you’re creating content that your audience actually cares about.
Start Tracking Your Twitter Analytics
Knowing how to access and understand your tweet analytics is key for guiding your social strategy and ensuring you’re reaching the right audience with the right content. Keep this guide with you as you start measuring your various metrics so you know exactly what each one means and why it’s important.
Frequently Asked Questions
How can you see your Twitter analytics?
Head to analytics.twitter.com, or select the More menu in the left-hand navigation on your Twitter feed to view your analytics.
Is Twitter Analytics free?
Yes! Twitter Analytics is completely free to use for any Twitter user.
How can you access more in-depth Twitter insights?
Get access to more in-depth Twitter insights than you get with native Twitter analytics by exporting your data and inputting it into a spreadsheet to calculate even more data like your reach percentage or tweet length vs. engagement.
You can also use third-party Twitter analytics tools or hashtag tracking tools to explore even more.
How can you pinpoint fake Twitter followers?
Twitter is known for having some fake accounts or bots. To pinpoint whether your followers are filled with bots, look for accounts with no profile photo or that haven’t tweeted at all.
You should also be wary of accounts that are brand new, or that follow a bunch of people and have very few followers themselves.
What is a good engagement rate for Twitter?
Engagement rates between 0.02% and 0.09% are good rates to aim for. For a great engagement rate, look for something more along the lines of 0.09% to 0.33%, or even up to 1%.
SUGGESTED

Top 31 Social Media Analytics Tools For 2026
There are many third-party social media analytics tools. Here is a selection of such...

Top 7 Social Media Analytics Software
Stay on top of your social campaigns by using the right social media analytics software...
12 Social Media Metrics You Should Be Tracking
Wondering if your social media marketing is hitting the mark? Here are the 12 social...