In the early days of digital marketing, gauging success relied on responses; today, the landscape is defined by Key Performance Indicators (KPIs). These metrics provide a nuanced understanding of effective strategies. Tracking metrics isn’t just a choice. It’s the compass guiding your campaigns. Amidst diverse brand goals, certain universal metrics act as beacons, differentiating what works and what doesn’t.
Strategic Metrics Mastery and a Deep Dive into Digital Marketing KPIs:
- What Are Digital Metrics and Key Performance Indicators?
- Why Is It Important to Track Metrics and KPIs?
- How Can You Monitor KPIs in Digital Marketing?
- Essential Digital Marketing KPIs
- Search Engine Optimization KPIs: Navigating Online Visibility
- Social Media KPIs: Mastering the Social Sphere
- Paid Advertising (PPC) KPIs: Precision in Promotional Strategies
- Email Marketing KPIs: Elevating Engagement through Analytics
- Guidelines for Choosing the Best KPIs to Track
- Frequently Asked Questions
What Are Digital Metrics and Key Performance Indicators?
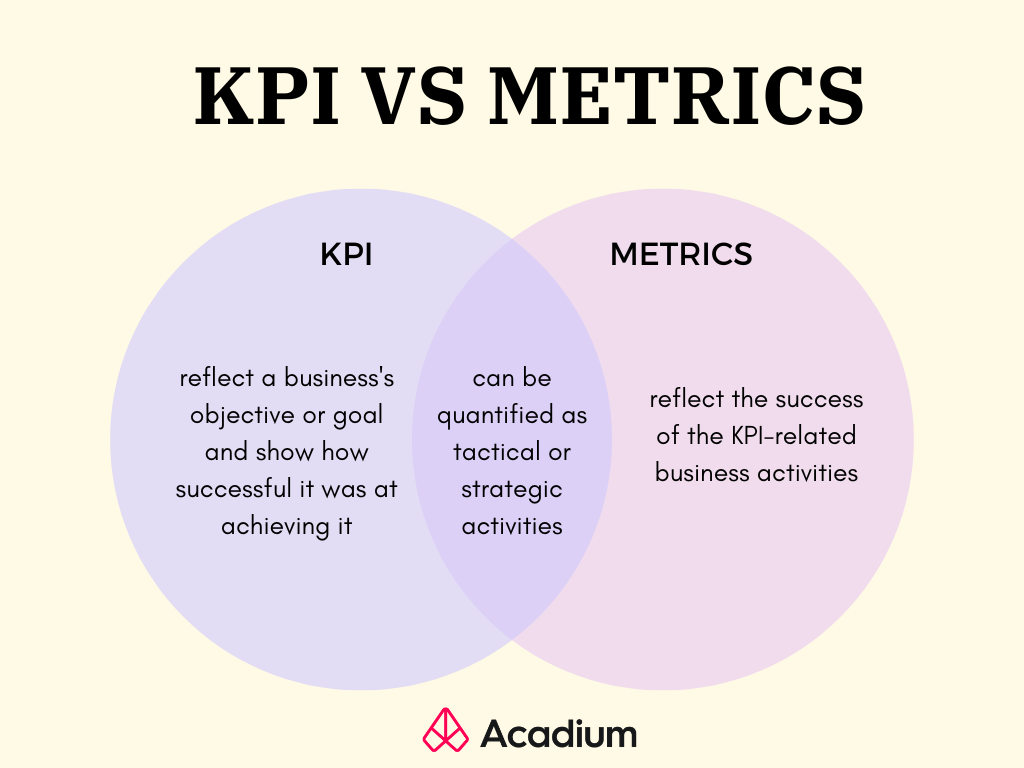
Digital marketing metrics and KPIs measure the effectiveness of your online efforts. Think of them as scorecards. Metrics are specific data points like website visits or social media followers. KPIs determine goal achievement, applicable to various business aspects.
Though used interchangeably, metrics and KPIs are distinct concepts. Metrics are countable actions or events, like users clicking a “Book a Consultation Now” button, providing data for analysis.
On the other hand, KPI is a performance metric that offers insights that steer decision-making. They can be high-level, impacting overall business performance, or low-level, focusing on departmental impact.
Digital marketing KPIs have standard values, enabling progress tracking. For instance, comparing industry-specific email open rates to the 38.49% average refines data accuracy so you can adjust your email marketing campaign based on your industry.
Source: acadium.com
Your digital marketing strategy is closely intertwined with digital marketing KPIs, covering essential areas like KPIs related to:
- SEO
- lead generation
- eCommerce
- paid and organic ads
- social media
These KPIs are sourced from various platforms and tools:
- Social media channels like LinkedIn, Facebook, Instagram, X, and TikTok
- PPC tools like Google Ads and Bing Ads
- Web analytics tools like Google Analytics and Adobe Analytics
- Lead conversion tools like CRM systems and sales team tools
- Content management systems like WordPress and HubSpot
- Marketing automation systems like Marketo
- Social listening tools like Brandwatch, Sprout Social, and Brand24.
- Contests and giveaways
Why Is It Important to Track Metrics and KPIs?
Tracking metrics and KPIs is vital for understanding your business performance. Numbers clarify what works and what doesn’t in your digital marketing efforts. Without this insight, it becomes tricky to allocate your marketing budget efficiently.
The good thing is nearly everything can be tracked today, allowing you to identify the sources of paying customers. You can also compare your KPIs to digital marketing report benchmarks to pinpoint areas for improvement and adopt best practices for enhanced campaigns. Armed with this knowledge, you can optimize your strategy by eliminating unprofitable aspects and improving successful ones.

Here are some more reasons why monitoring metrics and KPIs is a must:
Problem Solver
Leverage KPIs to solve issues by combining various metrics. For example, if facing a sales slump, tracking KPIs like call volume, appointment attendance, or trade event participation can aid in devising effective strategies to boost sales.
Goal Tracking
Whether it’s increasing website traffic or boosting online sales, monitoring these metrics ensures you stay on the right path. For instance, tracking conversion rates shows your success in turning leads into customers.
Return on Investment (ROI) Assessment
Informed decision-making demands that you have a clear understanding of whether your investments are generating positive returns or not. For example, analyzing the cost per conversion helps evaluate the efficiency of your advertising spend.
Continuous Improvement
Regularly monitoring metrics fosters a culture of continuous improvement. This ongoing evaluation enables you to refine and optimize your marketing strategies. For instance, analyzing customer feedback metrics can guide adjustments in product offerings or communication strategies for enhanced customer satisfaction.
How Can You Monitor KPIs in Digital Marketing?
Monitoring digital marketing KPIs provides important business insights for your marketing team. While managing this data across diverse channels demands effort, several methods, such as Google Sheets, Google Analytics, or dedicated KPI tracker software, can facilitate tracking. Among these options, using KPI dashboards proves the most efficient.
KPI dashboards are digital tools that offer a quick overview of your organization’s performance, well-being, and anticipated growth. They present data visually, ensuring a rapid understanding of key metrics and performance indicators. These customizable dashboards allow you to manipulate data presentation based on your business goals. Examples of metrics to monitor include:
- Reach and impressions
- Engagement
- Lead generation
- Website clicks and traffic
- Brand mentions
- Response rate and time
- Cost per acquisition
- Conversion rate
- Customer satisfaction
- Email bounce rate
- Profit margin
- Revenue per client
Set KPIs for both your business and individual employees. For instance, your business might aim to “increase website clicks to 2,000 in November,” while an employee could focus on “checking in with three customers daily.” Using a dashboard to monitor business and individual KPIs offers a quick assessment of your progress toward strategic goals.
KPI dashboards incorporate visuals like graphs and charts, enhancing data comprehension. A well-designed KPI dashboard delivers a comprehensive overview, aiding managers in identifying strengths and weaknesses and making necessary adjustments for optimal performance.
Here are the top KPI tracking software in the market today:
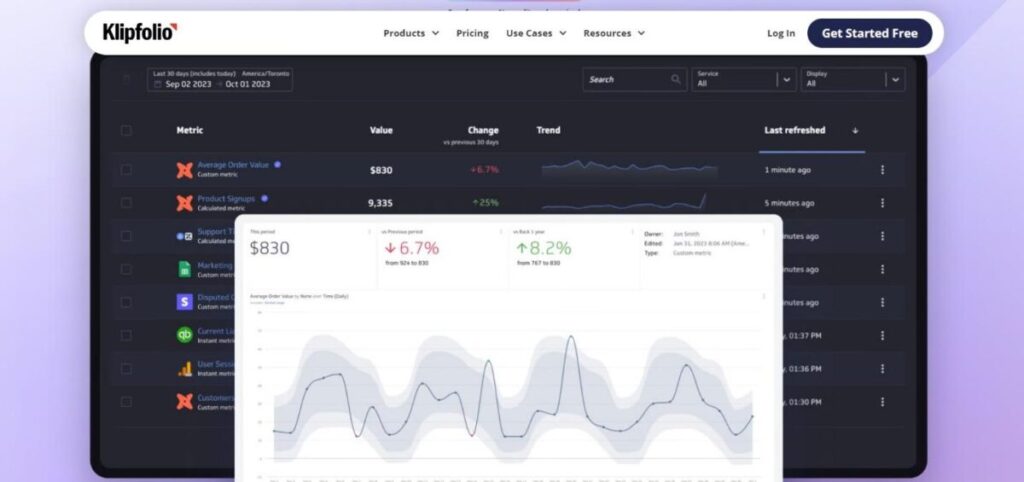
Klipfolio provides diverse features and integrations, making it suitable for businesses of any size. As a cloud-based software, it enables you to centralize your metrics, connect them to various data sources, and establish a unified catalog of reliable metrics. With over a hundred options, including spreadsheets, SQL, REST, and pre-built metrics, you can seamlessly link your team’s data to Klipfolio PowerMetrics. Once connected, simplifying messy or incomplete data becomes effortless with just a few clicks.
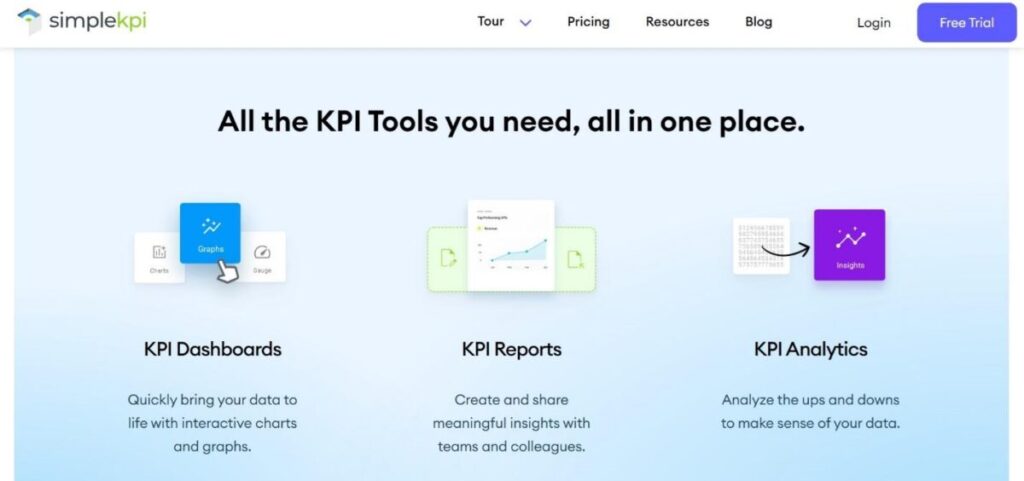
Despite its simplicity, SimpleKPI effectively tracks diverse metrics in finance, marketing, operations, and services, making it adaptable to any industry. The platform enables you to view your business KPIs effortlessly through interactive dashboards, facilitates accessible report-sharing with your team using collaboration tools, and provides in-depth data analysis features. SimpleKPI integrates seamlessly with popular software, ensuring compatibility, and offers 24/7 customer support.
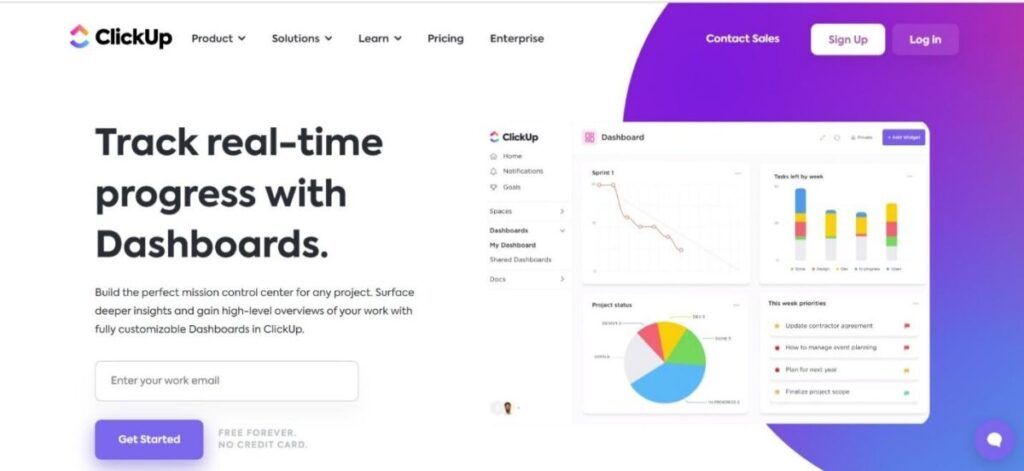
ClickUp, a comprehensive project management and productivity platform, integrates robust KPI tracking resources. It allows you to define and monitor KPIs, manage tasks, and oversee progress across various teams. The platform’s goal-setting features ensure alignment with performance expectations. Options like lists, boards, calendars, and Gantt charts provide flexibility in managing projects and tasks according to your preferences and project requirements.
Other KPI tracking software to consider:
- Hive: Hive’s Goals dashboard utilizes various metrics to provide a comprehensive organizational overview.
- Scoro: Offering a holistic view, Scoro’s KPI dashboard covers all aspects of the business. You can monitor projects, workflow, and financial KPIs in real time.
- DashThis: This tool offers a centralized dashboard presenting all campaign-related KPIs. With ready-made templates and a user-friendly interface, it facilitates robust analysis.
Essential Digital Marketing KPIs
Choose the right KPIs based on your business and digital marketing goals. Here are the common categories that apply to most companies in various industries.
General Marketing KPIs: Analyzing Overall Campaign Performance
Explore these essential marketing KPIs, universally applicable across various businesses and commonly featured on primary KPI dashboards.
-
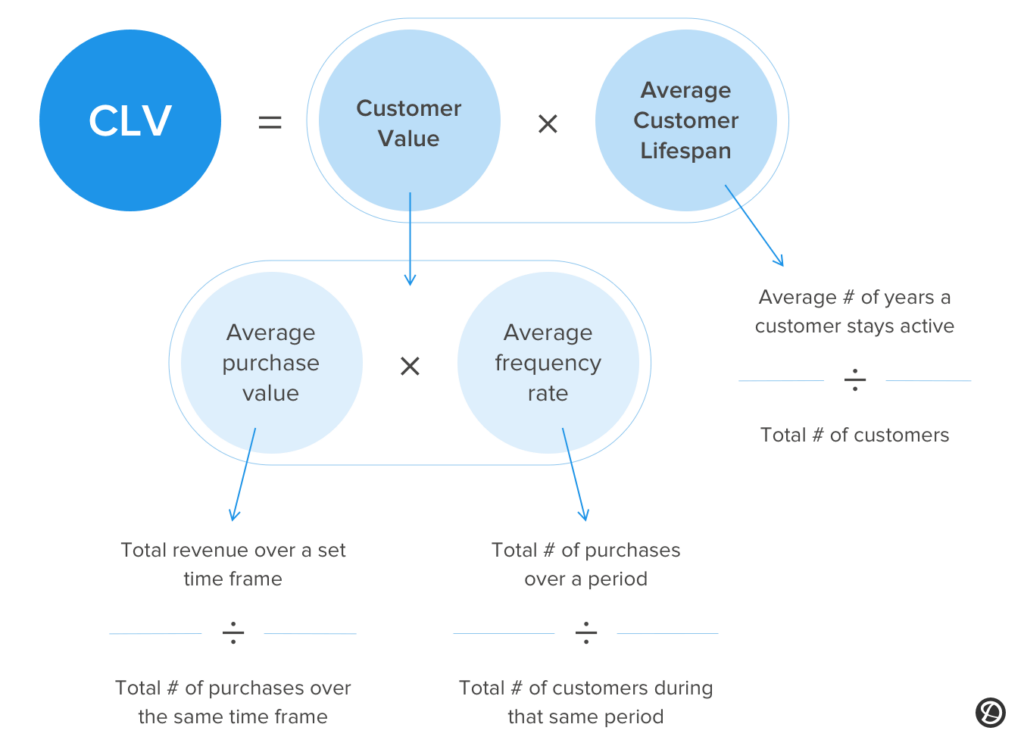
Customer Lifetime Value (CLV)
Customer Lifetime Value is the average revenue you expect from one customer. This could be recurring payments over years, one-time amounts, or a single payment based on your retention rate and product/service lineup. Customer value is their average spend and purchase frequency, while the average customer lifespan is how long they stick around.
Source: delighted.com
CLV matters because keeping existing customers is cheaper than finding new ones. Getting new customers is 5 to 10 times pricier than selling to existing ones. Plus, existing customers tend to spend 67% more.
-
Customer Acquisition Cost (CAC)
Customer Acquisition Cost is the total sales and marketing expense to gain a new customer within a specific timeframe. This cost encompasses campaign spend, salaries, commissions, bonuses, and overhead linked to attracting and converting leads into customers.
When you pair it up with CLV, you get a solid glimpse into future profitability as customers stick around.
-
Cost Per Lead (CPL)
Cost Per Lead (CPL) is a direct and effective metric for assessing your marketing efficiency. Lead generation is at the core of marketing and pivotal for successful sales, making it crucial for both departments to monitor how well marketing spend translates into leads.

Source: firstpagesage.com
CPL is typically used to measure the effectiveness of specific campaigns, whether it’s through Google ads, email marketing, or social media. It’s not just about individual campaigns; it gives insights into the overall efficiency of your marketing spend.
-
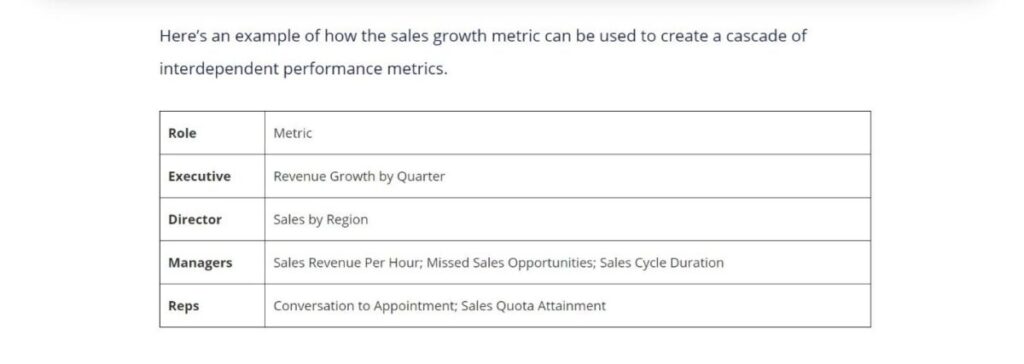
Sales Growth Rate
Sales Growth Rate is a critical KPI for every sales team and business owner. It shows how fast you’re closing sales in a set time frame, revealing the strengths and areas needing improvement in your sales strategy. Without revenue growth, you risk falling behind competitors. Sales growth is directly tied to revenue and profitability. It’s the heartbeat of organizations, influencing expectations on the sales team to deliver results when performance dips.
Source: klipfolio.com
- Return on Investment (ROI)
ROI is a ratio that gauges a company’s profitability. It’s a percentage derived from the original costs, telling you the cash made from an investment compared to the purchase price. Applying the formula is straightforward if you have the necessary data. To accurately understand your ROI, you must identify the specific costs and revenues relevant to your purpose.
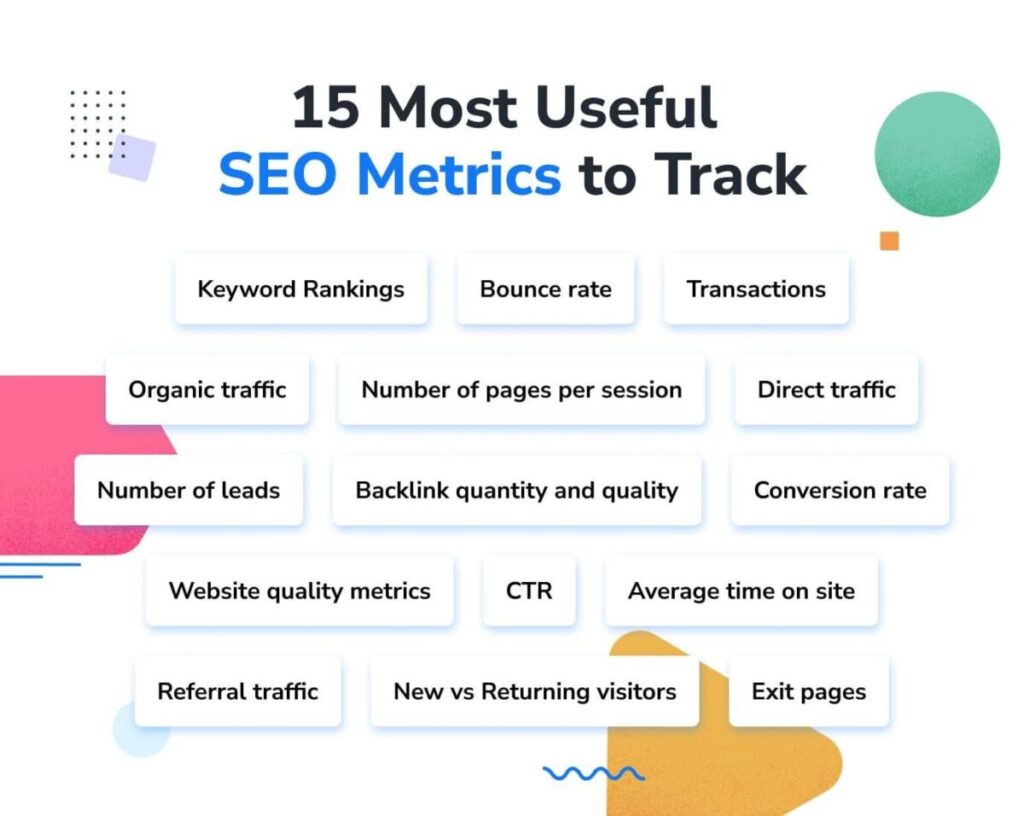
Search Engine Optimization KPIs: Navigating Online Visibility
Navigating through numerous SEO KPIs can be overwhelming and time-consuming. To streamline this process for your SEO campaigns, let’s focus on the crucial SEO metrics that demand your attention.
Source: mention.com
-
Conversion Rate
Your website’s conversion rate represents the percentage of visitors who accomplish a desired goal out of the total number of visitors. A high conversion rate signifies effective marketing and web design, indicating that people are interested in what you offer, and they can quickly obtain it.
There are two types of conversions:
- Macro-conversions are significant actions such as purchasing a product, requesting a quote, or subscribing to a service.
- Micro-conversions are smaller actions like signing up for email lists, creating an account, or adding a product to the cart.
The average SEO conversion rate is about 2.4%. This means that out of 100 people visiting a specific page on your website through SEO, approximately two or three will take a conversion action.
-
Search Traffic
SEO search traffic results from users finding a website through search engines like Google or Bing using specific keywords. Relevant metrics include total visits, unique visitors, organic traffic, and more, reflecting traffic from search engines. High search result rankings boost SEO traffic, a focused and cost-free form compared to paid ads.
-
Keyword Rankings
To improve your website’s visibility in search engine result pages (SERPs), monitor relevant keywords and optimize your pages accordingly. Thorough keyword research is essential to estimate your page’s potential reach.

Source: klipfolio.com
In the past, tracking small keywords was the norm to assess SEO success. However, with the evolution of semantic search, a single content page can now rank for multiple keywords and search contexts. Approximately 14.6% of search queries are phrased as questions, starting with who, what, where, why, and how.
-
Bounce Rate
A website’s bounce rate reflects the percentage of users who exit a page without taking any action. Monitoring this KPI is essential for enhancing your landing pages and retaining visitors to your site. It is a straightforward yet insightful gauge of your content’s appeal and alignment with the search queries that brought users to your page.
In contrast to many KPIs, a “high score” for bounce rate is undesirable. A high bounce rate suggests a need to capture visitors’ attention, presenting a challenge for conversions. Regularly monitoring bounce rates allows you to pinpoint areas for improvement on specific pages.
-
Backlinks
Backlinks play a vital role in the SEO strategies of many businesses and are considered one of the top three ranking factors in 2023, alongside quality content and search intent/relevance. Backlinks act as hyperlinks on other websites, directing users to your site.
Google places high importance on backlinks, significantly impacting your website’s visibility in search engine results. Some companies focus solely on accumulating backlinks in a numbers race, but quantity and quality matter. Acquire backlinks from reputable domains to enhance your website’s perceived value and trustworthiness.
Social Media KPIs: Mastering the Social Sphere
Social media KPIs gauge the effectiveness of your marketing strategy on platforms like Facebook, Instagram, TikTok, and others. There are numerous KPIs to follow. Here are a few you should always keep an eye on.
-
Likes, Comments, Clicks
Likes, comments, and clicks are the social media KPI trifecta. These indicators can tell you how your business’s social media exposure is doing.
Likes refer to the count of times a follower clicks the Like button on a post shared on social media.
Comments measure the frequency of follower comments on your posts. Comments can carry positive or negative sentiments, so a high number isn’t always favorable.
Clicks indicate how often users click on the link in your post, offering insights beyond reach into how people interact with your content outside the social platform.
-
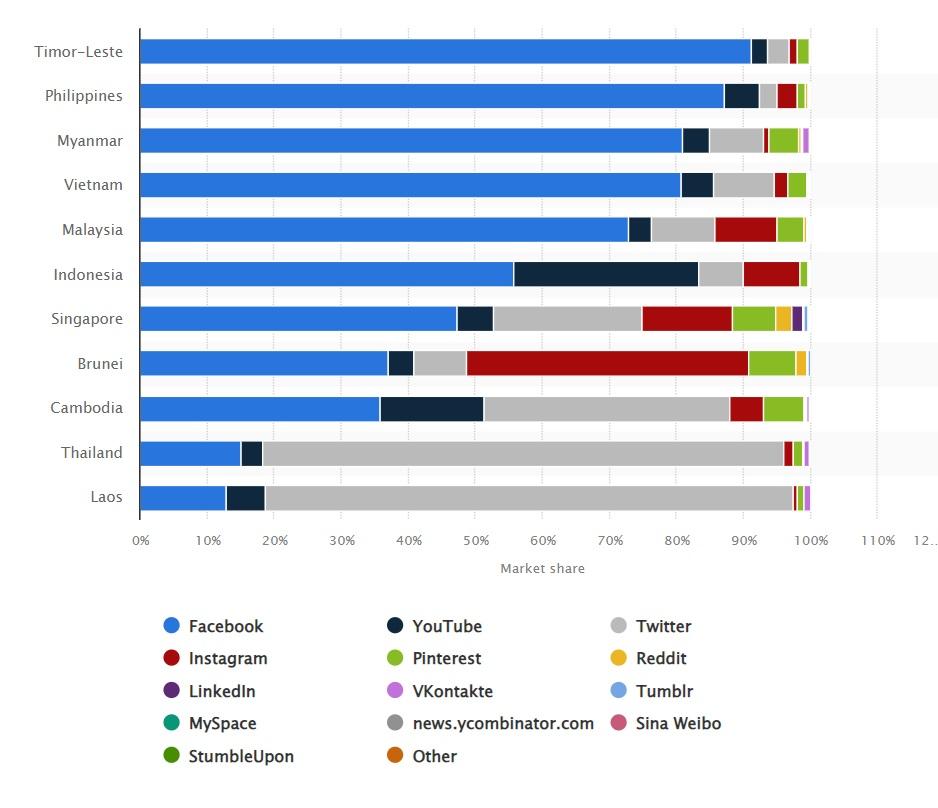
Social Media Traffic
Social media traffic acts as your online engagement speedometer. It indicates the number of visitors to your social media pages or profiles through links from other platforms. Higher traffic means more potential customers or followers.
Southeast Asia’s social media traffic this year:
Source: statista.com
-
Revenue
Revenue on your social media platform reveals the money generated, stemming from direct sales or website clicks converting into purchases. Depending on whether your network facilitates eCommerce transactions directly on the platform, you can access this figure through Google Analytics or your shop analytics.
Paid Advertising (PPC) KPIs: Precision in Promotional Strategies
PPC KPIs act as your digital detectives, unraveling the mystery of campaign success. They monitor impressions, clicks, and conversions, revealing the journey from ad visibility to customer acquisition. Below are the top PPC performance indicators to track.
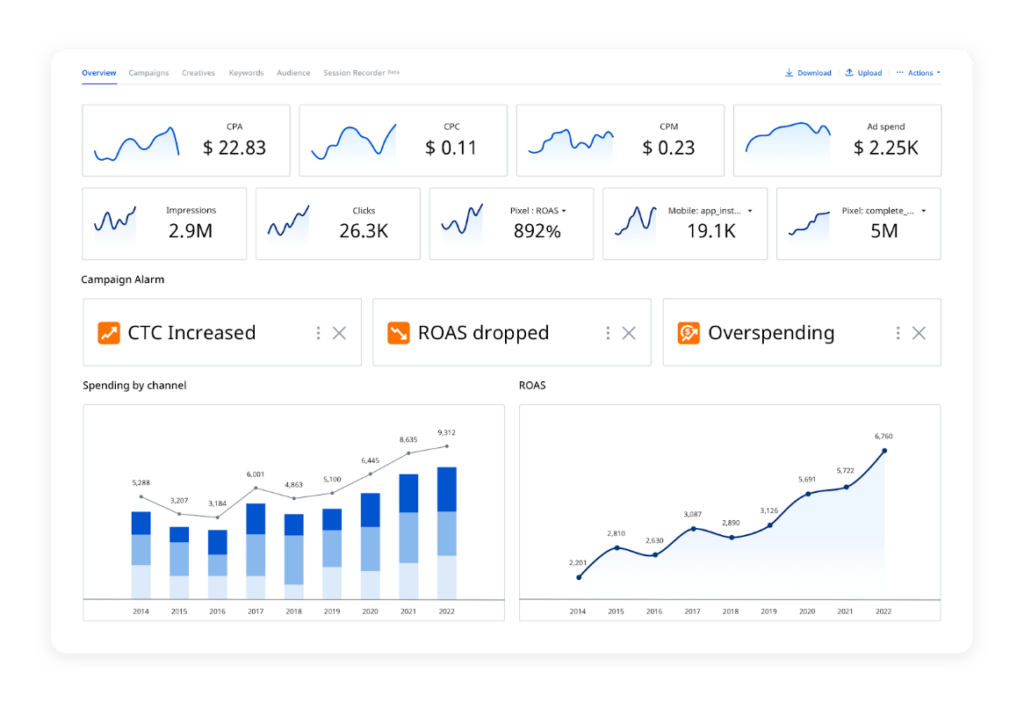
Source: adriel.com
-
Cost-per-Click (CPC)
CPC acts as your digital marketplace price tag, revealing the expense for each click on your PPC ad. It represents the cost of engaging a potential customer.
The average CPC on Google is $1.16.
A low CPC implies cost-effective ad spending, while a high one may signal targeting challenges or market competition. Monitoring CPC aids bid optimization, enhances reach, and ensures cost-effectiveness by avoiding overpayment for non-converting clicks.
-
Click-Through Rate (CTR)
CTR serves as your popularity gauge in the ad auction, measuring the percentage of people who view your ad and click on it. A high CTR indicates your ad’s allure, drawing in clicks and potential customers. As a pivotal KPI, CTR informs you about your ad’s relevance, persuasiveness, and audience reach. Conversely, a low CTR may indicate targeting issues, ineffective ad copy, or intense competition.
-
Quality Score
Quality Score is essentially your ad’s report card for relevance in Google’s eyes. Rated on a scale from 1 to 10, a higher score indicates a smoother user experience. This score significantly influences your ad rank, CPC, and, ultimately, your conversions.

Source: wordstream.com
Email Marketing KPIs: Elevating Engagement through Analytics
Email KPIs indicate your message’s reach, engagement, and conversion effectiveness. Here are some essential email marketing KPIs.
-
Open Rate
Open Rate serves as your email’s initial impression score, representing the percentage of recipients who open your message. A high Open Rate signifies more engaged guests. Influenced by subject line, sender name, and timing, a low Open Rate may suggest weak headlines, irrelevant content, or a stale email list.

Source: blog.hubspot.com
-
Signup Rate
The Signup Rate represents the percentage of individuals who encounter your call to action and proceed through your signup form, transforming into valuable leads. A high rate indicates compelling attraction and conversion of the right audience, while a low one may suggest a subpar offer, confusing forms, or misaligned targeting.
-
Unsubscribe Rate
The Unsubscribe Rate indicates the percentage of email subscribers choosing to stop receiving further emails from a sender. Calculate it by dividing unsubscribes by the number of delivered emails. A favorable unsubscribe rate is typically under 0.5%, signifying a healthy email list with engaged subscribers. This metric is vital for sustaining email deliverability by eliminating recipients who are uninterested in emails.
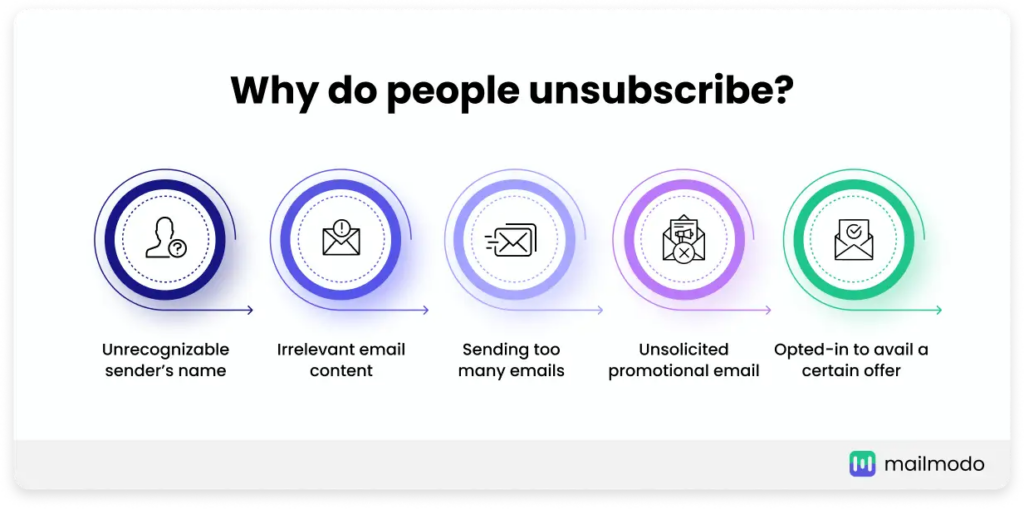
Source: mailmodo.com
Guidelines for Choosing the Best KPIs to Track
Choosing KPIs for digital marketing isn’t a universal decision. What’s effective for one company might not align with another’s needs. Here are fundamental principles to guide you in choosing the right KPIs tailored to your business and objectives.
-
Apply the SMART criteria.
When selecting KPIs, ensure they align with the SMART criteria:
- Specific: Tailored to a particular goal or task.
- Measurable: Easily quantifiable in numbers or percentages.
- Achievable: Realistic and attainable.
- Realistic: Rooted in a strong foundation.
- Timely: Accompanied by a defined time frame.
Businesses vary in needs, wants, and objectives, making a copy-paste approach unsuitable. SMART criteria assist in evaluating whether chosen KPIs align with business goals, bring value, and are measurable within a specified period.
-
Look at your goals and work backward.
Say you’re building a house. You wouldn’t just pile bricks. You’d start with a blueprint outlining the final masterpiece. KPIs are like that blueprint for your goals.
- Identify your ultimate goal. Clearly define what you want to achieve.
- Break down your primary goal into smaller, measurable milestones. This creates a roadmap for performance evaluation and optimization.
- Identify key drivers aligned with your goal. Determine the metrics that will propel you forward. For instance, focus on website traffic for brand awareness, conversion rates for sales goals, or employee engagement to foster a positive team culture.
Working backward from goals to KPIs promotes a targeted and efficient approach to monitoring and improving performance.
-
Select one or two metrics per objective to streamline tracking.
While your business has various components, not all are essential to monitor. Tracking too many metrics is inefficient and creates unnecessary work. Instead, look for the most impactful metrics for each objective.
For example, if enhancing employee training is a goal, measuring the percentage of trained employees or training time might not directly align with the desired outcome of skill development. Instead, focus on a measure like reducing errors resulting from the training.
Concentrating on a few key metrics ensures a more efficient and targeted approach to improving performance.
-
Choose your KPIs based on relevant factors.
Besides serving as performance indicators, they should possess additional characteristics indicating their effectiveness. Ask the following questions for each KPI under consideration:
- Can it be easily quantified?
- Can you influence change through this KPI, or is it beyond your control?
- Does this KPI align with both your objective and overall strategy?
- Is it straightforward to define and understand?
- Can it be measured accurately and promptly?
- Will it remain relevant in the future?
These criteria ensure that your KPIs reflect performance accurately and contribute meaningfully to your organizational objectives and strategies.
-
Avoid untraceable metrics.
While tracking is valuable, avoid metrics that mislead or offer limited insights. Do not track:
- Vanity metrics: These, like social media followers and download counts, may sound impressive but lack actionable insights.
- Lagging indicators: Reflecting past performance, these, including customer satisfaction surveys, don’t predict future potential.
- Misaligned metrics: Avoid those not aligning with your goals. For instance, prioritize delivering value over rushing through tasks when considering time to completion.
- Uncontrollable metrics: External factors like market trends, competitor actions, and economic conditions can distort analysis and are beyond your influence.
- Redundant metrics: Metrics like sales figures and revenue, web traffic, and user engagement provide similar information, creating clutter.
Focus on actionable, goal-aligned metrics that offer insights for improvement. By sidestepping these pitfalls, you can concentrate on tracking metrics crucial for your success.
-
Regularly review and report on your KPIs.
Monitor their performance monthly, quarterly, or at other predefined intervals. Continuous monitoring allows for the timely identification of underperformance or overperformance and understanding of the factors contributing to these changes.
To ensure team alignment and address interconnected measures and goals, communicate findings to all relevant parties. Instead of relying on error-prone spreadsheets, use customizable KPI dashboards for reporting. Create specific dashboards for departments involved in KPIs and another for executive teams, providing a high-level overview.
Final Thoughts
To assess your marketing strategy’s success, focus on key metrics rather than an array. Choose metrics essential to your business success and consistently track progress seamlessly. Simplify the monitoring process for ease and efficiency. This targeted approach ensures streamlined evaluation and optimization of marketing strategies, facilitating informed decisions aligned with your business objectives.
Frequently Asked Questions
What’s the difference between metrics and KPIs?
Metrics are raw data points like website visits, customer calls, or clicks. KPIs are chosen performance metrics that track progress toward specific goals.
How many KPIs should I track?
Concentrate on three to five impactful KPIs per goal area. Too many metrics can overwhelm and divert focus.
How often should I track my KPIs?
The frequency varies. Some KPIs need daily monitoring (like website traffic), while others can be reviewed weekly or monthly (such as customer retention).


