If you’ve been following the statistics that we’ve shared on Influencer Marketing Hub, you’ll know that mobile usage is on the increase. We’re growing much more comfortable using our mobile phones for browsing the web, shopping, and even purchases. Though, what about mobile apps specifically? Are we mostly using our phones to access web browsers or do apps take up more time? And where does mobile gaming fit into the picture?
Here are over 50 mind-blowing mobile app stats. Continue reading to find out how much time and money we spend and on what.
56 Mobile App Stats
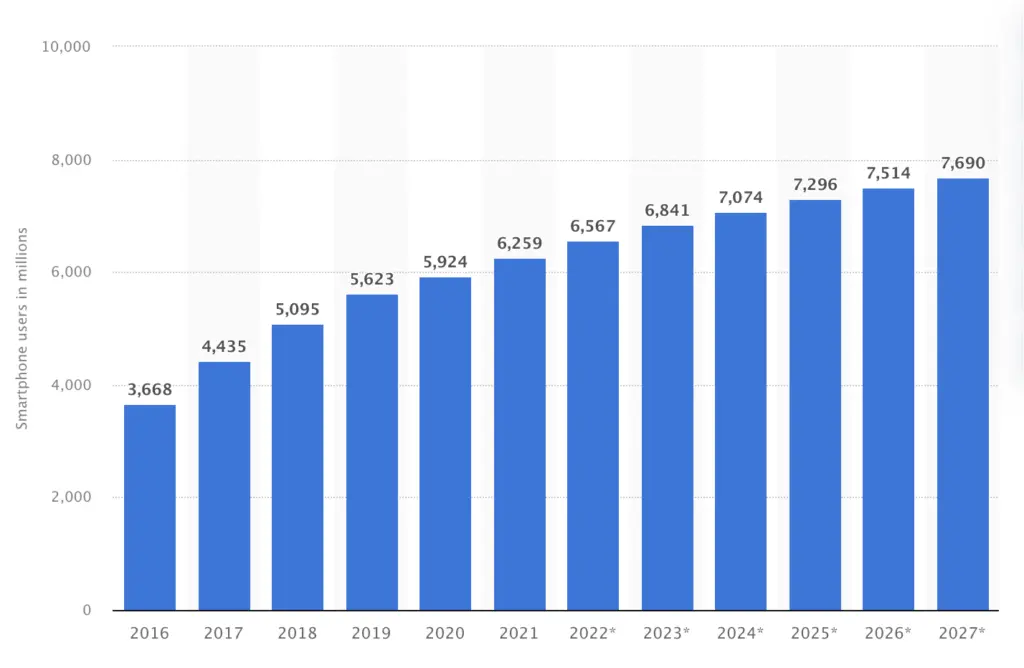
1. There Are 6+ Billion Smartphone Users
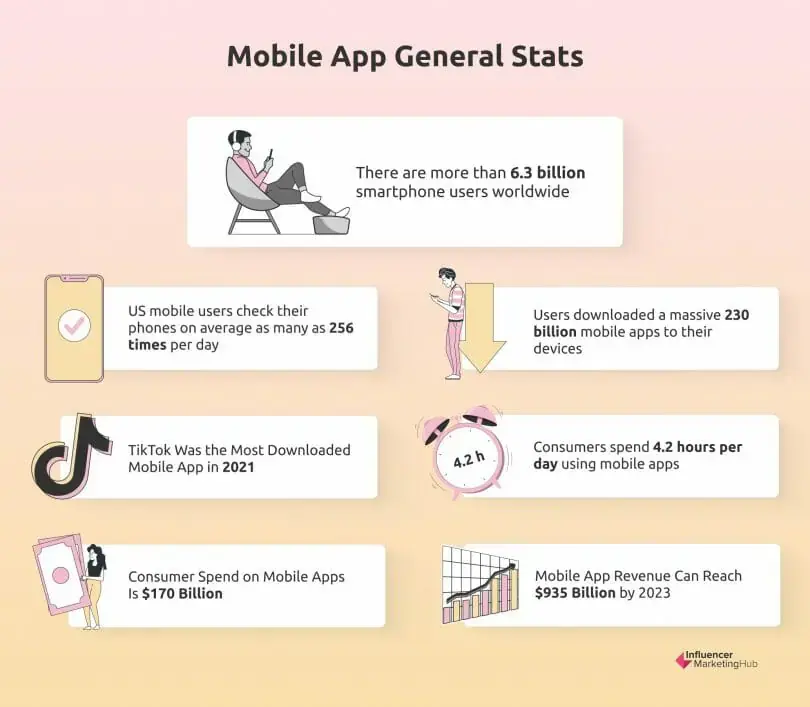
According to data shared by BuildFire, one of the most powerful app makers for iOS and Android, there are more than 6.3 billion smartphone users worldwide. What’s more, it’s anticipated that the number will continue to grow steadily to reach about 7.6 billion by 2027.
2. US Mobile Users Check Their Phones Hundreds of Times Per Day
If you feel guilty about your smartphone habits, maybe your phone addiction isn’t that bad… According to mobile statistics shared by Siteefy, a WordPress theme, US mobile users check their phones on average as many as 256 times per day.
3. Kenya Is the Leading Market
It might come as a surprise, but in 2021 Kenya was the leading global market when using year-over-year (YoY) growth in mobile apps downloads as a measuring stick. Kenyans downloaded over 60% more apps in 2021 compared to the previous year. In the second spot, it’s Pakistan with an increase of almost a third (27%).
4. 255 billion downloads in 2022
According to data.ai's State of Mobile 2023 report, mobile services broke records with 255 billion downloads in 2022. This shows a significant increase from the 230 billion downloads in 2021. The average time spent per day on mobile apps has reached 5 hours in the top mobile-first markets.

5. 2 Million New Apps and Games Released in 2021
Statistics shared in App Annie’s State of Mobile 2022 report reveal that publishers released 2 million new apps and games in 2021 alone. Games accounted for only 15% of 2021’s new releases. Google Play had the newest releases across all categories of apps and games by far (77%).
6. TikTok Was the Most Downloaded Mobile App in 2023
TikTok continued to be the most downloaded app in 2023, similar to 2021. Meta’s Instagram, Facebook, and WhatsApp also remained in the top five. TikTok’s video editing app, CapCut, also made it to the top five.
7. WhatsApp Is the Most Popular Messaging App By Far
As of the beginning of 2022, WhatsApp was the most popular global mobile messenger app in terms of monthly active users. Data shared by Statista reveals that a whopping 2 billion users are using the app each month, spending on average 18.6 hours per month on the app. Since 2014, it has been downloaded about 6 billion times.
In second spot, it’s WeChat with just over 1.2 billion users, while Facebook Messenger gets bronze with just shy of 1 billion users. Other mainstream social messaging apps like Telegram and Snapchat have about only a quarter of the number of monthly active users that WhatsApp has.
A lot of WhatsApp’s popularity can be linked to cost and it’s a cheaper alternative to operated-text messaging by means of SMS.
8. Social Media and Communication Apps Lead the Way
Top 10 most-downloaded non-gaming mobile apps of 2022 according to category, TikTok led the global mobile app market in 2022, securing its position as the most downloaded app with a staggering 672 million downloads. Following TikTok, Instagram and WhatsApp also demonstrated significant popularity, garnering 548 million and 424 million downloads respectively. Additionally, the instant messaging service Telegram was downloaded 310 million times by users worldwide. These figures underscore the immense global reach and influence of social media and communication apps.
9. Android Users Spend More Than 90% of Mobile Time Using Apps
More than 90% of the time that Android users from across the world spent on their mobile devices was spent on using mobile apps (and gaming). This means that only 7.5% of mobile time was spent using web browsers.
10. Consumers Spend Over 4 Hours Per Day in Apps
A report shared by data.ai (formerly called App Annie) about mobile data and analytics reveals that on average consumers spend 4.2 hours per day using mobile apps. To put this number into perspective, it’s up by 30% in just two years. In fact, in some markets (India we’re looking at you) it increased by as much as 80%.
11. 70% of Time Spent in Social and Photo/video Apps
The trend of spending most of our time on social and photo/video apps has continued in 2023. According to App Annie's State of Mobile 2023 report, 72% of the time spent on mobile is now spent using these two categories of apps. Gaming apps still make up a significant chunk of time at 10%, but entertainment apps have fallen to just 7%.
12. Brazilians Spend the Most Time Using Apps
In 2021, Brazilian mobile users spent the most time using mobile apps per day. Each day, they spent about 5.5 hours, up by about 1 hour and 40 minutes since 2019. Mobile users in Indonesia aren’t far behind, though. They spend about 5.25 hours interacting with mobile apps on a daily basis.
13. Android Users Spend More Than Double the Amount of Time on YouTube Than Instagram
When you do a quick comparison of the time spent on social media apps, YouTube takes the lead and by quite a significant margin. According to data shared in the Digital 2022: Global Overview report, Android users spend 23.7 hours per month on the YouTube app. It’s four hours more than on Facebook and TikTok respectively, five hours more than on WhatsApp, and over 12 hours more than on Instagram.
14. South Koreans Spend the Most Time on YouTube
While the average time spent per month on the YouTube mobile app is 23.7 hours, Android users in South Korea spent nearly as much time per month on YouTube as employees typically spend at work per week. In second place, it’s India with an average of 29.6 hours per month.
15. Turkish Mobile App Users Spend the Most Time on Instagram
The average number of hours per month that Android users in Turkey spend on Instagram is just over 20 hours. To put this into perspective, US mobile app users spend about only 7.7 hours per month on this social media app which is surprisingly lower than the global average.
16. UK Users Spend the Most Time on TikTok
While TikTok is the mobile app that generates the most downloads, compared to other leading social media apps, users don’t actually spend the most time on this app. Perhaps it’s because it’s mostly short-form videos as opposed to full-length tracks that get shared on a platform like YouTube. Either way, the average time spent on the TikTok app is 19.6 hours per month. In the UK, it’s the highest (27.3 hours), closely followed by Russia (26.3 hours).
17. Consumer Spend on Mobile Apps Is $170 Billion
Not only do consumers spend loads of time on apps, but also money. Global consumer spend on mobile apps added up to $33 billion in Q1 2022, while for the whole year the Digital 2022: Global Overview report estimates it at $170 billion. What makes this amount even more impressive is that it increased by over 18% in a single year.
18. The Average App Spend Is Less Than $30 per Phone
According to the Digital 2022: Global Overview report, the average app spend per smartphone for 2021 was $27.16.

19. Google Play Has the Most Apps
As of Q2 2022, Google Play was the biggest app store in terms of the number of available apps. In total, it has about 3.5 million apps — a third more than the Apple App Store that has more or less 2.2 million apps.
20. Amazon Appstore Has Nearly Half a Million Apps
Google Play and the Apple App Store might be synonymous with app downloads, but there are hundreds of alternative app stores for Android devices. For example, Amazon Appstore currently has nearly half a million apps available. It might be the leader in online shopping, but when it comes to app downloads it still has a long way to go.
21. There Are Over a Million Publishers on Google Play
Seeing that Google Play has more apps than Apple, you would expect that there will be more app publishers too, which is the case. According to Google Play Statistics and Trends for 2022, as of the end of August 2022, 1,061,994 app publishers have published apps on Google Play.
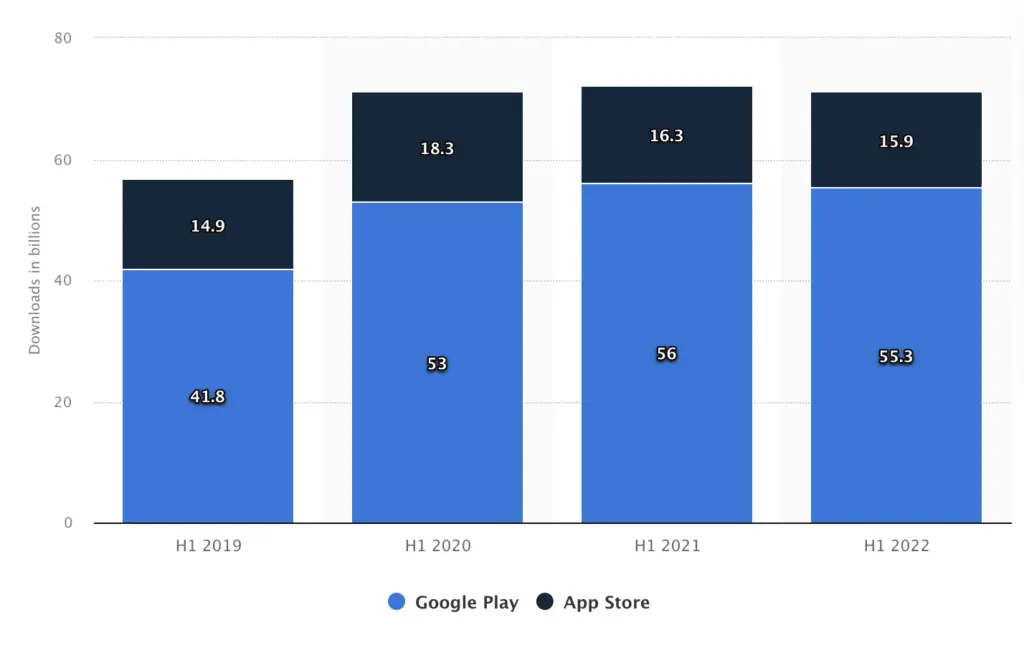
22. Google Play Gets Over 3 Times More Downloads
Not only does the Google Play store have loads more available apps, but it also generates way more downloads than the Apple App Store. A side-by-side comparison reveals that in the first half of 2022, Google Play boasted over 55 billion downloads of mobile apps and games worldwide vs the Apple App Store’s 15.9 billion downloads. For the Apple App Store, this is the lowest that it’s been since the same period in 2019.
23. Fewer Apps Are Getting Released on Apple App Store
While we’re spending more time and money on apps, we’re not necessarily getting more choice. While mobile app growth in the Apple App Store might have grown slightly (3.5%) in Q2 2022, the number of available mobile iOS apps have decreased by as much as 20% for the same period last year. Compared to levels in 2015, the growth of available mobile apps is also significantly lower.

24. There Are ± 700,000 Publishers on the Apple App Store
According to App Store Statistics and Trends for 2022, as of the end of August 2022, there are 723,064 app publishers that have published apps on the Apple App Store.
25. After Gaming, Business Apps Have the Biggest Share
While social and communication apps get downloaded the most, business is the most popular app category on the Apple App Store (after gaming). Mobile app stats shared by Statista reveal that as of Q2 2022, it had a share of 10.2% (gaming has a market share of 13.5%). In third place, it’s education apps making up a share of 9.5%.
26. Security Is Slightly More Important Than Features
A survey of global mobile users completed in 2021 revealed that for most an app’s security is more important than the features that it offers, but only marginally. In fact, only 1% value security more. So, you might as well call it a tie. What’s more, a quarter couldn’t choose between the two and said that they valued security and features as equally important.
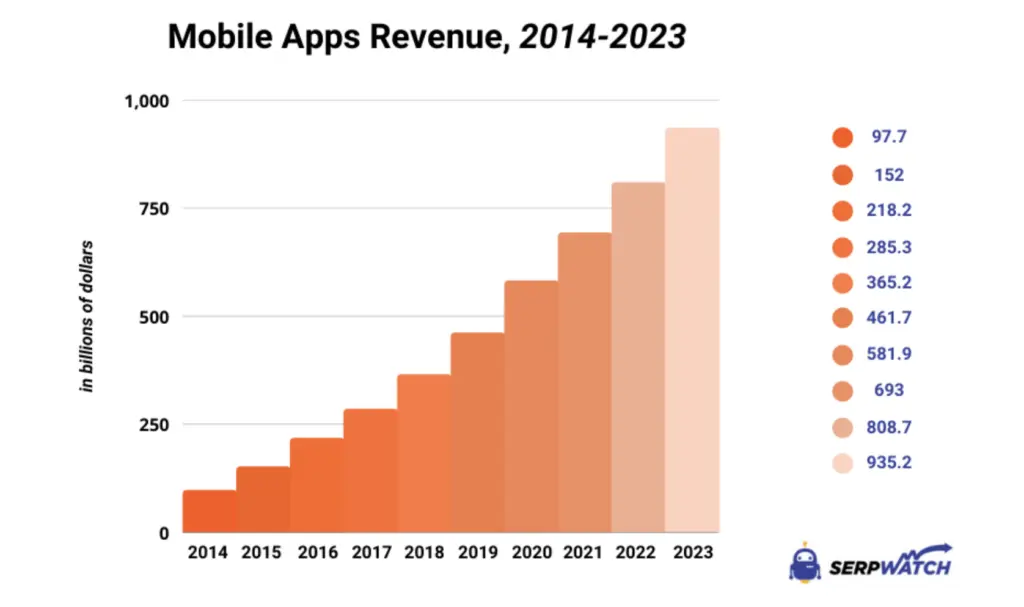
27. Mobile App Revenue Can Reach $935 Billion by 2023
According to data shared by SerpWatch, it’s predicted that revenue generated by mobile apps via in-app purchases and paid downloads can add up to over $935 billion by 2023. Since 2014, the market has enjoyed significant growth and in 2014 it was “only” $97.7 billion.
28. More Than 17% Pay for a Mobile App
The Digital 2022: Global Overview report reveals that 17.4% of internet users pay for a mobile app each month. To put this number into perspective, nearly a third pay for a movie or TV streaming service each month, fewer than 10% pay for a subscription to an online magazine each month.
29. The mobile games segment is expected to reach $172.10 billion in 2023
The global mobile gaming market is forecast to be valued at $172.10 billion in 2023. This would represent an increase of $19.6 billion or 12.85% from the previous year.
30. Subway Surfers Is the Mobile Game with the most worldwide downloads on App Store and Google Play
According to a 2023 ranking of mobile gaming apps by Sensor Tower, Subway Surfers in the mobile game with most downloads. In second spot is Garena Free Fire, while Stumble Guys got the bronze medal.
31. Honor of Kings Regained Its Lead in 2022
In terms of worldwide revenue on App Store and Google Play, Honor of Kings regained the throne with $735.4 million in consumer spending across the App Store and Google Play. In second place was PUBG Mobile, while Genshin Impact was in third spot.
32. 4X March-battle Strategy Games Most Monetizable
When it comes to gaming subgenres, 4X march-battle strategy games, like Rise of Kingdoms, generated the most consumer spend in 2021, with a total of nearly $10 billion.
33. Tinder Is the Most Popular Dating App Worldwide
Tinder continues to be a leader in the dating app market in 2023. It was the most downloaded dating app in 2022, followed by Bumble. Tinder is also the most popular dating app in the United States and Europe. The dating app market made $4.94 billion revenue in 2022, with $3.1 billion coming from Match Group. Over 300 million people use dating apps worldwide, with about 20 million paying for premium features.
34. Consumer Spending on Dating Apps Has Nearly Doubled Since 2018
Consumers spent more than $4 billion on dating apps in 2022. What makes this amount even more impressive is that it works out to an increase of nearly 100% worldwide since 2018. Markets in the United States, Japan, the United Kingdom, and China were the main driving forces, and in the US and Japan, consumer spend increased by more than 100% in the past three years.
35. Google Maps Is the Most Downloaded Travel App
According to Statista, the most downloaded travel app in 2023 is Google Maps. It had over 113 million aggregated downloads on iOS and Google Play. Uber and Booking.com apps secured the second and third spots in the ranking, amassing approximately 107 million and 80 million downloads respectively.
36. 1 Billion Travel App Users in 2022
According to Business of Apps, there were slightly over one billion travel app users in 2022, with approximately 1.5 billion people taking trips worldwide and more than 75% using a smartphone or website to book1.
Hopper’s 2023 Travel Trends Report states that travelers started the planning process later in 2022 but returned to the app to check the price of their trip 25% - 50% more than in previous years. Travelers last year checked the price of their domestic trip an average of 16 times before booking, a 33% increase compared to 2019.
37. Live-streaming mobile apps are growing rapidly
In 2022, the global live-streaming market was worth $18.6 billion, and it is expected to reach $33.4 billion by 2027. Bigo Live topped the chart as the highest-earning mobile live streaming app in the first quarter of 2022, raking in close to 82 million U.S. dollars from consumer spending. Twitch, despite boasting the largest daily user base among the top 10 live-streaming apps, came in second, generating around 73 million U.S. dollars. Tango secured the third spot, with earnings just above 30 million U.S. dollars. This data highlights the significant revenue potential of live-streaming apps, even when user base size doesn't directly correlate with earnings.
39. The Pandemic Boosted Usage of Food and Drink Apps
The pandemic drove many to drink and eat more and we didn’t even need to leave the couch (then again, we weren’t given much freedom to do so). Worldwide users spent 49% more sessions in 2021 in food and drink apps. And, while we could wait for our delivery in 2020, in 2021 our appetite for fast delivery grew with rapid delivery apps seeing a very strong growth in downloads.
40. Gen Z Most Likely to Use Cryptocurrency Trading Apps
Compared to Gen X and baby boomers, Generation Z mobile users are more inclined to use cryptocurrency trading apps and internet-only banks. Greenlight, a fintech company, was the top finance app by monthly active users in 2021 in the US among Gen Z users.
41. More Than 20% Discover New Brands via Mobile Apps
According to stats shared in the Global 2022: Digital Overview report, more than one out of five internet users (21.5%) discover new brands, products or services via ads in mobile apps. What’s more, it’s also one of the main channels for brand research with 26.9% of internet users using mobile apps for this function.
42. Apps Convert More Product Viewers
According to mobile app stats shared by Siteefy, mobile apps convert three times more product viewers compared to mobile web.That said, the majority of users prefer mobile sites over apps when it comes to price research.
43. In-app Ads Have a Higher CTR
The click-through rate (CTR) for in-app apps is more than double that of web ads on mobile. The average CTR for in-app ads is 0.56% compared to only 0.23% for web ads on mobile, according to Siteefy.
44. Nearly 12% Pay for In-app Purchases
Each month, about 11.8% of internet users pay for in-app purchases, according to the Global 2022: Digital Overview report.
45. Branded Apps Drive More Interaction Than Sponsored Social Media Posts
When it comes to online brand interactions, the research suggests that branded apps can be a very effective channel. In a broad global survey, 17.8% of internet users indicated that they downloaded or used a branded app. To put this percentage into better perspective, 20.9% answered that they interact with an email or newsletter from a brand each month (and we know how effective email newsletters can be).
46. Only 8% of B2B Marketers Use Mobile Apps for Content Distribution
A business website remains the main source for sharing content, even though mobile apps have grown in popularity over the years. Statistics shared by Content Marketing Institute (CMI) reveal that compared to 90% of B2B marketers that have used their organization’s own website to share content, only 8% used their mobile app.
47. Most Mobile Apps Are Free
The vast majority of apps can be downloaded for free. As of July 2022, 97% of Google Play’s apps were free, while this number is slightly lower for the Apple App Store.
What’s more, according to BuildFire, a whopping 98% of global app revenue gets generated by free apps and you can, for example, use in-app purchases to make money (refer back to stat #44 for earnings potential).
That said, there’s still a market for paid apps (in fact, according to BuildFire consumers who’ve downloaded a paid app are more inclined to be engaged).
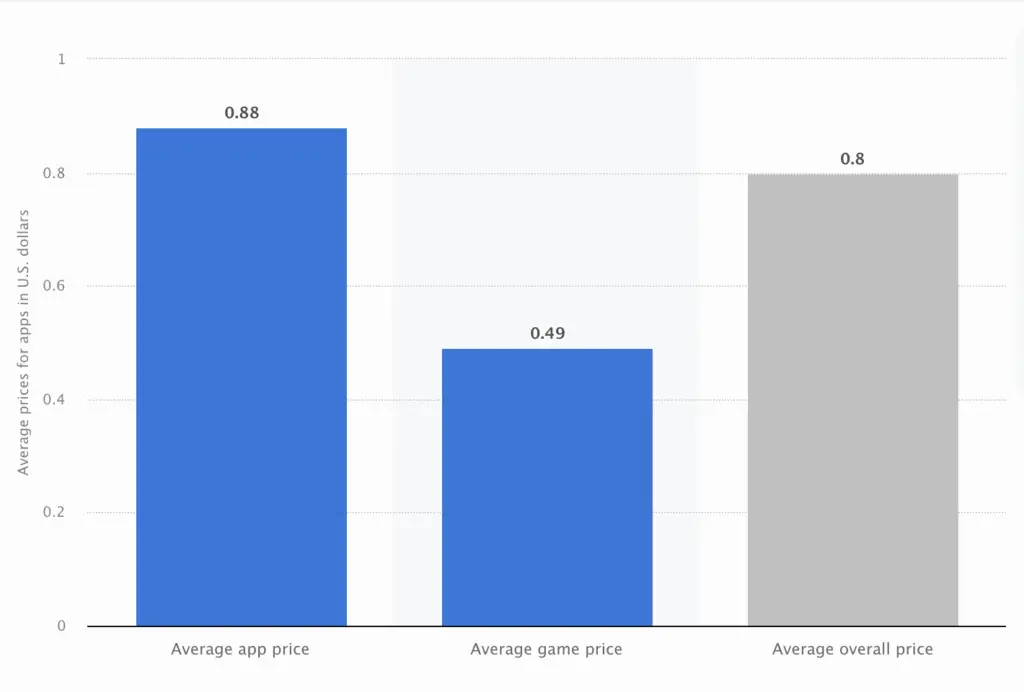
48. The Average iOS App Price Is Less Than $1
If you do decide to charge a fee for your app, the going rate isn’t much. As of November 2021, the average price of a gaming app was only $0.49 in the Apple App Store, while the average app price was slightly higher at $0.88.
The average price of all apps in the Apple App Store is $0.80.
49. Most Android Apps Also Cost Less Than $1
If you look at the price distribution of paid apps priced below $10 in the Google Play store, you’ll see that it looks pretty much the same as what’s happening over at Apple. As of July 2022, the vast majority of apps (nearly 36,000 apps) cost less than $1. Nearly 30,000 apps charge between $1 and $2, while fewer than 10,000 apps charge more than $3. Only 2,332 apps in this price category ($0-10) charge between $9 and $10.
50. More Than Half of Android Apps Have Been Rated
If you’re a regular reader of yours truly, you would know about the power of social proof. Google Play (and the Apple App Store) give users the ability to rate apps. According to data shared by 42matters, 53% of apps on Google Play have been rated, with most apps scoring a rating of between 4 and 4.5.
51. Less Than Half of iOS Apps Have Been Rated
While fewer apps on the Apple App Store have been rated, more apps received a five-star rating. According to an app ratings histogram shared by 42matters, nearly 250,000 apps received 5.
52. Mobile Advertising Spend is $362 billion
Mobile ad spend is on track to hit $362 billion in 2023, after surpassing $336 billion in 2022 despite tightening marketing budgets. Source
53. Decline for Education Apps
Education apps for schools and universities have noticed a steady decline in 2021 figures, as more schools return to fully in-person teaching. Source
54. 5G to Overtake LTE by the End of 2023
5G will continue to make headway between 2022 and 2026, as its market share for new mobile devices grows from 44% to 75.4%, overtaking its predecessor LTE by the end of 2023, with 51.9% and 41.4% respectively. Source
55. Most time spent on apps
The Business of Apps report shows that Pakistan, Thailand, and The Philippines spent the most on apps per capita in 2023, indicating a shift in the markets leading in mobile app engagement and expenditure.
56. 39% of smartphone owners delete apps because they don’t use them anymore
Not all downloaded apps maintain their place on users' mobile devices. For example, an excess of ads and notifications leads to the removal of apps for 28% of users. Similarly, 20% of individuals delete apps due to insufficient storage space on their devices.
Wrapping Things Up
While very few B2B marketers use mobile apps for content distribution, these stats show that it can be a very promising form of marketing. And, if you’re not searching for a channel to share content, why not create your own app? There are several types of apps that have gained loyal subscribers. From delivery apps to meditation apps for when it’s time to slow down again, you’re bound to find an engaged target audience for your mobile app.
Frequently Asked Questions
How do I find app statistics?
To find your app statistics on Google Play, open the Play Console app and select the app. Then tap data card to see more details.
How do I check my mobile statistics?
To check your mobile statistics and how much time you spend on each app, open your phone’s settings and go to digital wellbeing and parental controls. The chart will show your phone usage and screen time mobile statistics.
How do I track mobile app usage?
To track mobile app usage, you may need to use software analytics to do so. You can use tools like Matomo, the free software analytics framework, to track mobile app usage.
What is mobile app Analytics?
Mobile app analytics defines the practice of collecting user behavior data, analyzing intent behind the metrics, and using the data to improve retention, engagement, and conversion. This field focuses on iOS and Android analytics as well as mobile web.

