Facebook is the undisputed leader of social media platforms. For marketers, excelling at Facebook is a must, regardless of their industry and audience demographics. Marketers who pivot their marketing strategies around hard numbers and facts have a better chance of making their mark on Facebook.
However, the platform and its audience evolve at breakneck speed. The marketing tactics that worked last year may not succeed this year. That’s why staying on top of trends at all times is very important.
In this post, we bring the latest Facebook stats along with our analysis, in categories that matter to marketers. You can leverage our insights to craft on-target marketing plans for your brand.
The Facebook Stats Every Marketer Should Know: A Complete List:
Facebook Stats That Marketers Should Know
As a social platform, Facebook reigns as the undisputed king of communication. With billions of people who use Facebook, there are certain statistics every marketer should know when it comes to digital marketing. We have curated facts and figures about Facebook marketing from reliable sources for you. Just jump to the group of stats that interests you.
Statistics About Facebook Demographics
The first step in creating an effective marketing plan is to research your target audience. This group of stats will give you clarity about various aspects of your users, including their age, gender, education, income, and motivators.
Age and Gender Composition of Users
As of January 2023, Facebook's largest demographic group consists of men aged between 25 and 34 years, who comprise 17.6% of global users. This demographic remains the most active user base on the platform, frequently utilizing Facebook for a multitude of activities, such as news sharing and expressing personal interests.
Following closely, the second largest user group on Facebook is young men between the ages of 18 to 24. This trend shows that the platform continues to hold strong appeal among younger males, potentially driven by its extensive features that enable social connection, information exchange, and entertainment.
Meanwhile, the most significant demographic of female users on Facebook continues to be millennials. Although they represent a slightly smaller percentage of the total female users compared to 2022, this group remains notably engaged with Facebook, especially in interactions with brands and making purchases via Facebook advertisements.
Shifting the focus to U.S. statistics, it was discovered that 23.8% of Facebook users belonged to the 25-34 age bracket as of March 2023, making them Facebook's largest audience in the country. Young adults aged 18-24 weren't far behind, accounting for 18.4% of the user base.
Interestingly, teenagers between 13 to 17 years of age formed the smallest user group on Facebook, with only one out of every twenty users falling in this category.

Motivators for Facebook Use on the Internet
According to a 2022 report released by the Global Web Index, the main takeaway was that 45% of millennials use social media to keep in touch with their family and friends. There is a tie at 27% for those who want to kill time and read news stories.

Source: gwi.com
When it comes to Facebook, while journalists from the United States use Twitter for their jobs, American adults use Facebook more for finding news. This age group is more likely to use social media because it offers opportunities to stay connected within their personal network and be up-to-date with what is going on in the world.

Source: gwi.com
Facebook Statistics on Usage
As marketers, knowing about Facebook usage can help you understand the social media platform better and tailor your marketing campaigns accordingly. With the engagement rate as one of the essential factors to consider when formulating an effective Facebook marketing plan, below are some statistics about it.
Monthly Active Users
As of 2022, Facebook had more than 2.96 billion monthly active users (MAU). The United States ranked second when it comes to audience base, right after India that has a leading audience base with almost 330 million users. It took Facebook 13 years to pass the milestone of having 2 billion active users. This is a 28% increase from January 1, 2021, which means that the number of people using Facebook every day has increased by more than 50% in under two years.
Daily Active Users

Turning our attention to the daily active users, the landscape presents an equally interesting picture. As per the recent figures from the first quarter of 2023, Facebook witnessed its daily active user count swell to 2.04 billion, marking a subtle yet noteworthy increase from the previous quarter.
This rise in numbers is even more remarkable when juxtaposed with the corresponding statistics from the first quarter of 2022. Facebook successfully managed to add an impressive 77 million daily users during this period. This further underscores the platform's resilient capacity to engage and attract users on a daily basis, despite the evolving social media landscape.
Mobile Active Users

Source: statista.com
There were 2.75 billion mobile active users as of January 2022. India has the largest number of users on mobile, followed by the US and Indonesia. The implication for businesses is clear: if you want your content to reach these highly engaged consumers, make sure it's optimized for mobile devices first. Mobile advertising is quickly becoming the most effective means of reaching consumers because of their increasing usage of mobile gadgets.
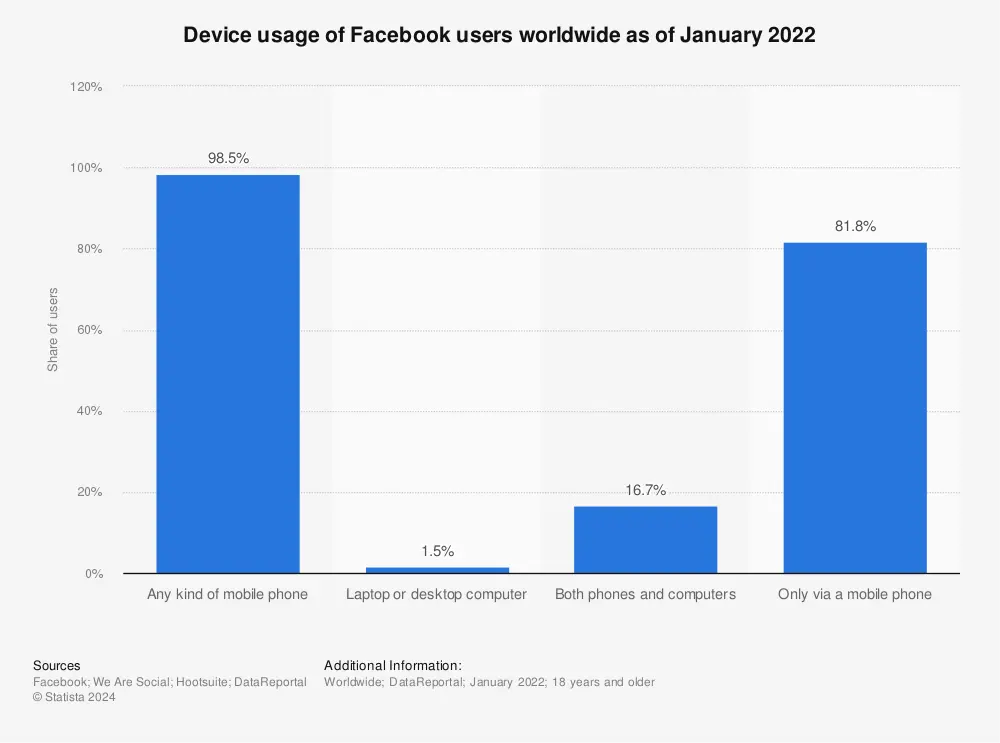
As the world's leading social media network, Facebook has become increasingly accessible through mobile apps and websites. Over 98% of daily active users around the world get to access Facebook over any mobile phone. Additionally, 16.7% of the total users access the platform on both computers and mobile phones.
Overall, social media marketing predominantly happens on mobile devices these days. As marketers, it is important to know that people are more mobile than ever and are using Facebook on a variety of devices.
As the world's leading social media network, Facebook has become increasingly accessible through mobile apps and websites. In fact, over 98% of daily active users around the world get to access Facebook over any mobile phone. Additionally, 16.7% of the total users access the platform on both computers and mobile phones. With this said, social media marketing predominantly happens on mobile devices these days. As marketers, it is important to know that people are more mobile than ever and are using Facebook on a variety of devices.
Active Users Per World Region
Asia forms over 50% of the global population, so it is no surprise that Facebook is the most popular social media platform in this region. Africa comes in second with 17.6%, while Europe is third with 10.6% of Facebook subscribers.
When choosing which social media platforms to use for your business, be sure to take into account this information. Not only will you reach more people with your content and ads on Facebook, but you will also know where their interests lie.
Facebook Active Users Per Gender Breakdown
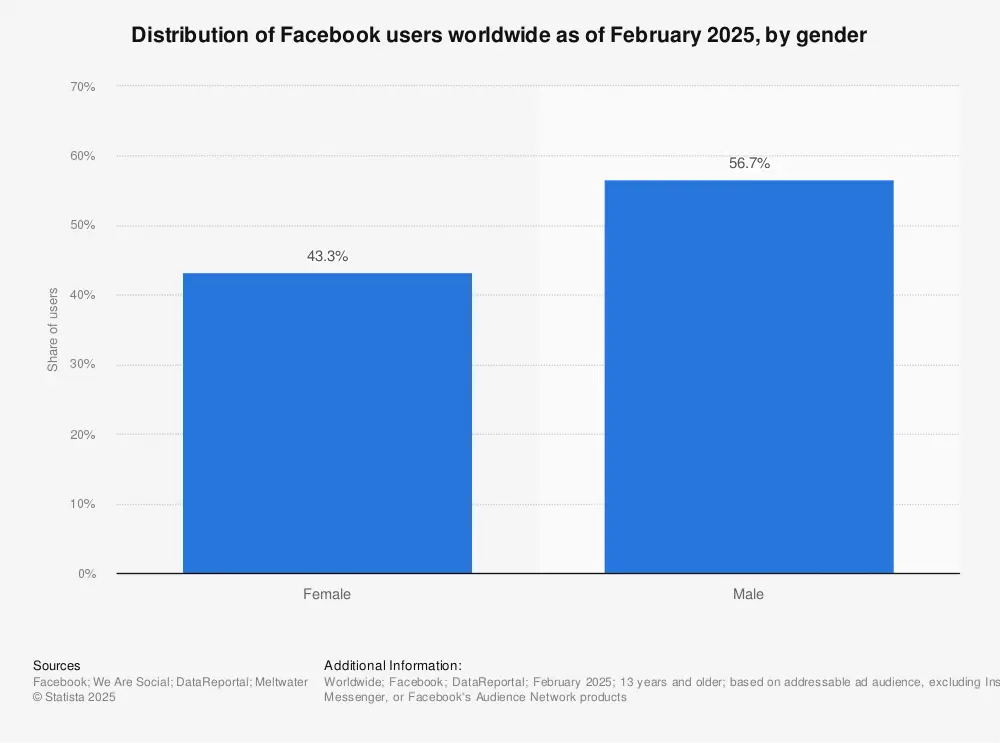
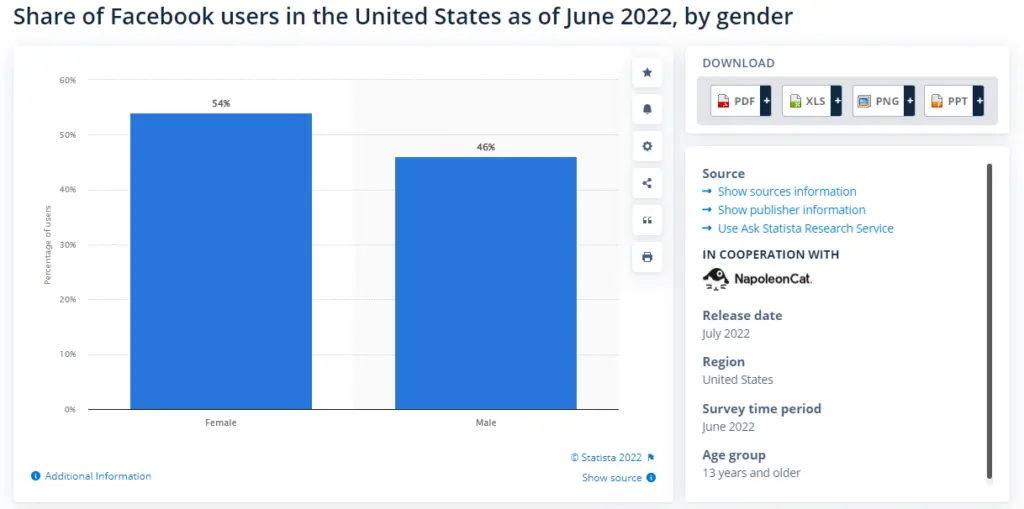
Facebook statistics on users per gender are important to marketers as it shows that there are different ways to market to people on the platform. Men account for 56.3% of Facebook users, while women dominate 43.7%. However, when you take a look at the gender user survey in the US, 45% comprise male Americans, while almost 55% make up female Americans.
Source: statista.com
With these available data, marketers can see that marketing to men and women is not the same on Facebook when it comes to the global versus a specific market. You should not be discouraged by this but rather focus on different ways to reach potential customers on Facebook. For example, businesses targeting female customers may want to consider using targeted ads and offering special deals or discounts specific only to women. Similarly, businesses that focus on male users may want to use content geared toward men, such as a blog and e-book about sports or technology. By tailoring your marketing efforts according to gender, you are more likely to reach the people you want.
Statistics About Facebook Ads
Facebook is not just about content and ads; it is also about targeting users. When you create an ad on Facebook, you have a range of options to choose from when it comes to target demographics. You can target people based on their location, age, gender, interests, and even the pages they like.
A large number of Facebook users presents a huge opportunity for businesses to reach their target audiences through this platform. Businesses can use Facebook advertising to target specific groups of people based on interests, demographics, and other factors.
This information will help businesses know who their potential customers are on Facebook and what content or ads might work best for reaching them. Below are some of the essential statistics about Facebook ads that every marketer should know:
Ad Revenue Contribution
Facebook's ad spending share has grown significantly in recent years and now accounts for over a quarter of all digital ad spending. This is an impressive feat, considering that Facebook only began selling ads in 2007. In the year 2022, Meta, formerly known as Facebook Inc., incurred advertising expenses of over $2.6 billion dollars. The overall ad revenue generated by Meta (Facebook's parent company), was a staggering $131.9 billion, with approximately $65 billion coming directly from the Facebook app.

While Facebook's efforts to monetize its users have varied greatly by global region, in the Asia Pacific, the average revenue per user (ARPU) was just over $4. This result pales compared with $50+ ARPUs across the United States and Canada, alone where there are even higher prices for advertising spots on social media sites such as Instagram or Snapchat. It's noteworthy to mention that $54.5 billion of Facebook’s revenue is generated in US & Canada, despite only 13% of users being based in that region.
Mobile Advertising
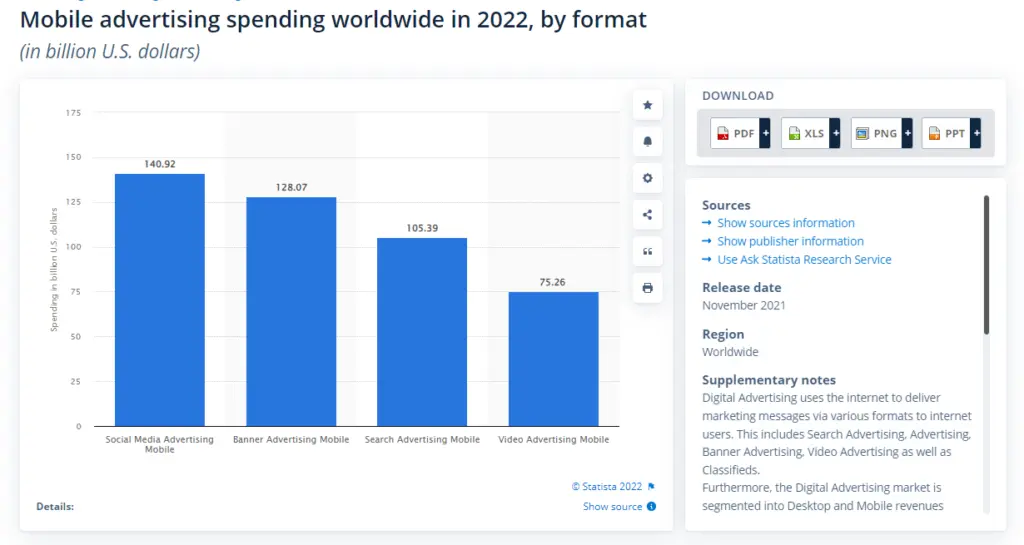
Since mobile is the way that most people access Facebook, it's no surprise that mobile advertising is one of the main sources of revenue for the site. In fact, in a survey released last January 2022, mobile spending on social media advertising was at $141 billion, banner advertising was at $128 billion, followed by search advertising, and video advertising.
Source: statista.com
In other words, if you're not advertising on mobile, then you're at a serious disadvantage when it comes to reaching your audience. Facebook also makes it fairly easy for businesses to create ads that are optimized for mobile devices, so you don't need to worry about making any major changes to your marketing strategy.
In terms of performance, Facebook recorded an net profit of $23.1 billion in 2022. Despite a minor dip in annual revenue for the first time in the company’s public history in 2022, dropping from $117.9 billion to $116.8 billion, Facebook remains a lucrative platform for marketers who can effectively target and engage their audience.
Statistics About Facebook App Videos
Video content has been a strong growth area for Facebook, so it’s no wonder Facebook announced that the formerly US-only Reels feature, rolled out in 150 countries as of last February 2022. According to a Insider Intelligence, Facebook even became the number 2 go-to platform for short-videos consumption, leaving TikTok behind in 3rd place. The Meta owned platform captured 60,8% of user share, lagging behind YouTube with 77.9%.
Video content is likely to remain extremely popular on Facebook. That is likely because users can easily share and promote them making it an ideal medium for reaching a large audience quickly and efficiently.
Wrapping Up
Marketing through Facebook can give rich dividends, especially if it’s done in a well-planned manner. If your marketing strategies are based on real and dependable facts and figures instead of assumptions, this will be the best time for you to proceed more confidently. The Facebook stats discussed above will give you a solid base to craft your plan in maximizing the potential of marketing through this massive social network.
Whether you go with paid or unpaid marketing, these stats will give you a good idea of how to improve your chances of success. At the end of the day, it is all about getting results for your hard work, not just coming up with a Facebook marketing strategy but also truly understanding your target Facebook users. This, after all, is what will make your strategy truly successful.
Facebook is a crucial platform for marketers due to its vast user base of over 2.96 billion monthly active users. It offers extensive targeting options, a variety of ad formats, and valuable insights into user demographics and behaviors, making it an effective tool for reaching and engaging with potential customers. The largest demographic group on Facebook consists of men aged 25-34, followed by men aged 18-24. Women in the 25-34 age group are also a significant demographic. In the U.S., 23.8% of users are aged 25-34, and 18.4% are aged 18-24. Teenagers aged 13-17 form the smallest user group. Asia has the highest number of Facebook users, followed by Africa and Europe. India leads with the largest audience base, followed by the U.S. and Indonesia. This regional distribution highlights the importance of tailoring marketing strategies to target specific geographic audiences effectively. Over 98% of daily active users access Facebook via mobile devices. This makes mobile optimization crucial for any Facebook marketing strategy. Ensuring that content and ads are mobile-friendly can significantly enhance reach and engagement with the platform's predominantly mobile user base. Key trends include the dominance of mobile advertising, which constitutes a major portion of Facebook's ad revenue. Video content, especially short-form videos like Reels, is gaining popularity. Marketers should focus on creating engaging, mobile-optimized video ads to capitalize on these trends.Frequently Asked Questions
Why is Facebook important for marketers?
What are the key demographics of Facebook users?
How does Facebook usage vary by region?
What is the importance of mobile optimization for Facebook marketing?
What trends should marketers be aware of regarding Facebook ads?


