Instagram is continuously evolving, introducing new features to improve the user experience. One of the latest additions is the Instagram Collabs feature, allowing users to collaborate on posts and Reels, making it an invaluable tool for both brands and influencers. The ability to partner up with other creators can significantly boost your reach and engagement.
Since engagement is key on Instagram, using the right features at the right time can make all the difference. That’s where you can also use our Instagram Engagement Rate Calculator to track your engagement and see how well your collaborations are performing.
In this post, we’ll explore how to use Instagram Collabs, the benefits it offers, and how to creatively leverage this feature to enhance your content and engagement.
What Are Instagram Collabs?
Instagram Collabs is an Instagram feature that enables users to collaborate with one another. Using this feature, you can co-author a Feed post or a Reel with another user. The post will feature both your handles and show up on both your profiles, allowing more users to see it. That means you get to garner collective engagement from each other’s communities.
Instagram content creators popularly use this feature to collaborate with other creators and engage each other’s communities. Brands can also use this to announce their collaboration with another brand or even collaborate with a content creator.
In some cases, public figures may even be able to use the Instagram Collabs feature as a marketing tool to promote their own product line. See the below example in which influencer Aimee Song creates an Instagram Collab post with her personal clothing line, Song of Style.
Benefits of Using Instagram Collabs
With the ability to share a post simultaneously on two profiles, visibility is the most obvious benefit of using the Instagram Collabs feature. In addition to this, there are several other ways the feature can add value to you:
Reaching a New Audience
Since an Instagram Collab post shows up on both of your profiles, it allows you to get your content in front of the other user’s audience. This means you can easily reach a new audience and introduce them to your brand or your creator account. It’s a great way to showcase your products, services, expertise, or creativity in front of a brand new community. If people are interested enough, you could even end up with plenty of new followers.
Boosting Engagement
In addition to showing up on both your profiles, an Instagram Collab post also collects the engagement from both your communities. That means the likes, views, and comments collected from the other user’s profile get counted toward the total engagement rate for the post.
And the engagements can quickly build up since they’re coming from two (or more) different communities. Moreover, the Instagram algorithm will consider this high engagement rate and make your post visible to more users.
Increasing Sales
Instagram also allows you to collaborate on shoppable posts. That means more people will get to see your products and easily buy them from your Instagram Store. This significantly improves the chances of driving sales.
How to Use the Instagram Collabs Feature
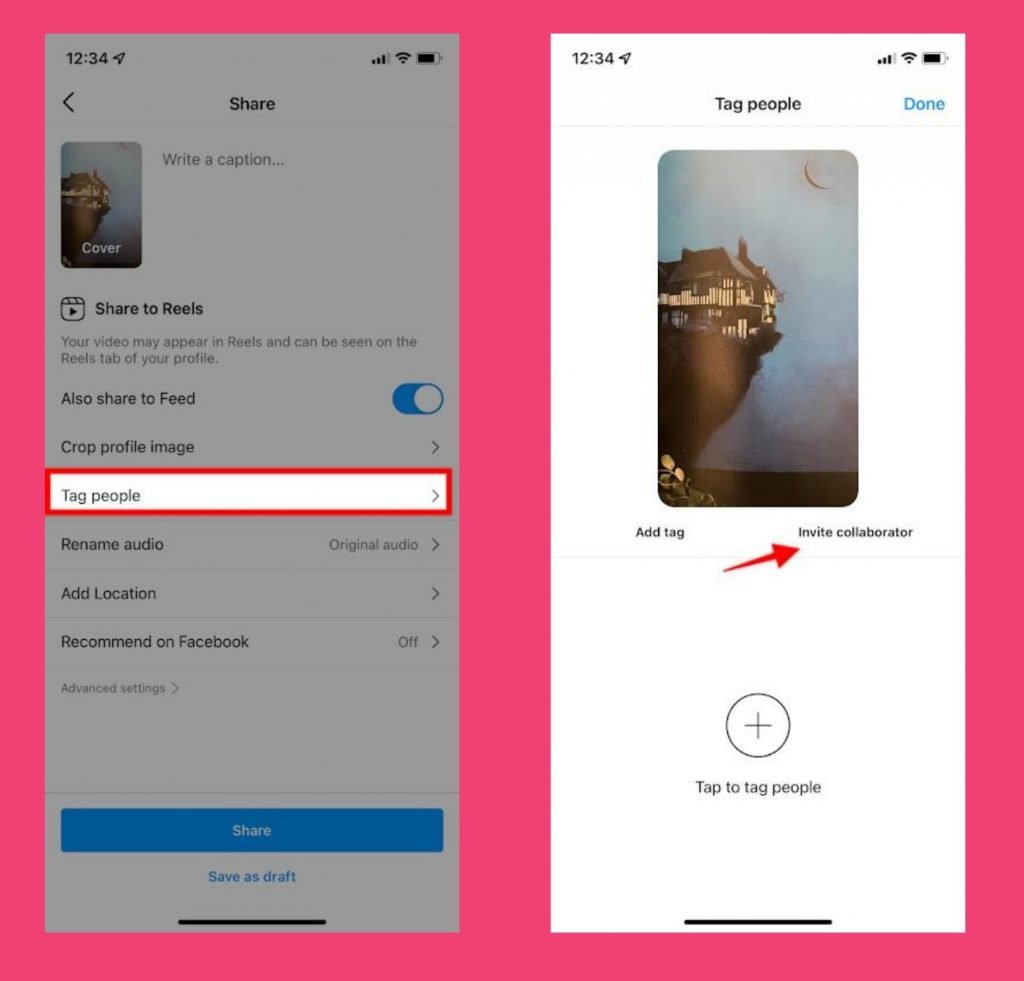
Creating an Instagram Collab post is a lot like creating any other Feed post or Reel. Follow the steps below to use the Instagram Collabs feature:
Step 1: Follow the usual steps to create a new Feed post or Reel.
Step 2: On the page where you can add your post details, tap on the “Tag people” option.
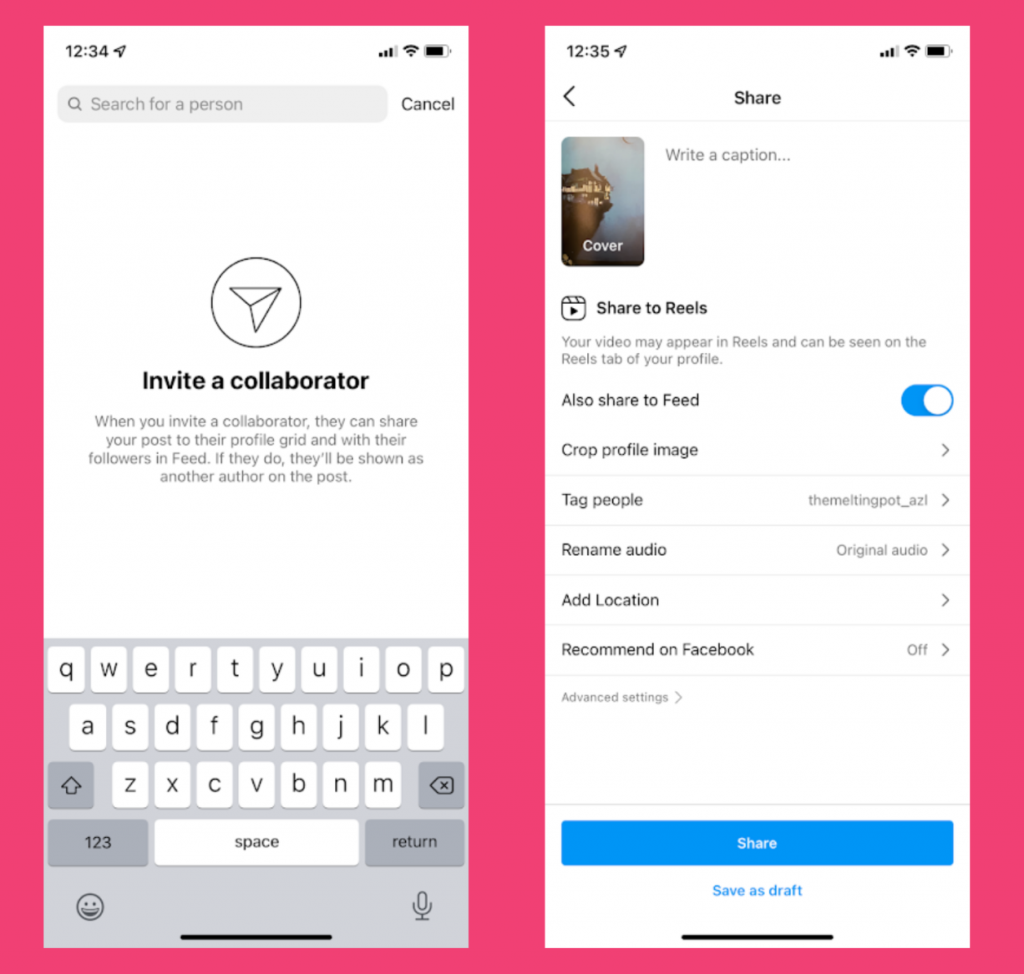
Step 3: Choose the “Invite collaborator” option.
Step 4: Search for the user you want to collaborate with and select their username. You can add multiple people as collaborators for a single post. But keep in mind that they will have to accept your Collab request in order to show up as authors of the post.
Step 5: Once you’ve selected the user(s) you want to collaborate with, tap on “Done.”
Step 6: Add more details to your post as needed such as writing a caption, adding a location, adding music, etc. Then tap on the “Share” button to create your very first Instagram Collab post.
How to Accept an Instagram Collab Request
Alternatively, if the other user is creating the post, you’ll need to accept their request to collaborate. Follow the steps below to accept an Instagram Collab request:
Step 1: Click on the invite notification from your Activity page. This will open the post with a note saying “@user invited you to be a collaborator on their post.”
Step 2: Tap on the blue “Review” button next to the note. This will open a pop-up window to either accept or decline the invitation.
Step 3: Select “Accept” and that’s it. You’ve accepted your very first Instagram Collab request and will be shown as an author of the post. The post will be shared to your profile and your followers in Feed.
Creative Ways to Leverage Instagram Collabs
Now that you know the steps to create an Instagram Collab post, it’s time to find out how to make the most of this feature. Here are some creative ideas to leverage Instagram Collabs to boost visibility and engagement for your account.
Showing Your Products in Action
If you sell physical products, one of the best ways to use Instagram Collabs is by showcasing your products being used in real-life. Consider creating a Collab with an influential creator who’s using your product. They may create a short video tutorial on how to use your product, a picture showing the end result, or even a before-and-after transformation.
For example, Revolve Beauty had the following Instagram Collab with digital creator, Amy Le (@amyle.nails). The short Reel shows the influencer painting her nails and then using a product from Revolve Beauty.
Announcing an Upcoming Collaboration/Event
If you have an event or collaboration coming up with a brand or a content creator, Instagram Collabs are a great way to announce or promote them. The collaboration could be anything from a mini product line or a podcast interview. Sharing an Instagram Collab post with all the details about the upcoming event or collaboration is a great way to build excitement over time and drive more product or ticket sales.
For example, to promote a retreat he organized, Spiritual Coach Kevin Garcia created the following Instagram Collab post with podcasters Dirty Rotten Church Kids. The post contained all details about the event like when and where it’s happening and mentioned the podcasters as special guests.
Running Giveaway Campaigns Together
Instagram Collabs give you the perfect opportunity to collaborate with another brand or influencer for a giveaway campaign. Typically, when you create a giveaway contest with other brands or creators, each of the collaborators would have to share the same post and get their community to participate.
The Instagram Collabs feature makes this easier so that just one account will need to create the post announcing the giveaway and it’ll show up on all of your profiles. That way, you can garner the collective engagement of multiple communities and gain more visibility for the giveaway.
For example, Cult Beauty ran a giveaway contest offering the chance to win products from Selfless by Hyram. Instead of sharing different posts individually, the two accounts created an Instagram Collab post that showed up on both of their profiles. It managed to collect over 6,000 likes and over 3,000 comments in just three days.
Show How Well You Work Together
As the Instagram Collabs feature was made for collaboration, you can leverage it to showcase how well you work together. Whether it’s creating something together, putting together expert insights, or sharing work that you did together–Instagram Collabs could be used to showcase a creative or expert collaboration.
For example, Florida-based painters, IR Professional Painting shared the following Instagram Collab post with Florida Paints. The post showed the team’s before-and-after exterior repaint job in which they used products from the paint company.
Standing Up Together for a Cause
In a world where consumers are becoming more socially conscious, standing up for a cause that you really care about is a great way to build a connection with your followers. And the Instagram Collabs feature can help you do this even more effectively by working with another creator, organization, or brand to show your support for a certain cause.
The WWF Action Team, for instance, created an Instagram Collab post with the main World Wildlife Fund account to take a stance against plastic waste. In the post, the team called on global leaders to negotiate a legally-binding treaty to prevent plastic waste from ending up in nature. This helped to simultaneously raise awareness about the issue and bring more attention to it.
Adding Fresh Content to Your Page
Freshness and variety are what you need to continue engaging your audience. But keeping your page updated with fresh content is easier said than done as you eventually run out of creative juice. Even if you already have ideas laid out in your content calendar, you may not always be able to follow through due to a lack of time or resources. Moreover, giving your fans something completely new can help you maintain their interest.
That’s why Instagram Collabs are such a wonderful addition to your Instagram content strategy. By sharing content from another creator in the form of an Instagram Collab post, you can keep your page fresh and interesting for your audience.
For example, Mental Canvas regularly shares content from artists who used the tool to create artwork. Some of the artworks are even shared in the form of an Instagram Collab post as seen below.
Promoting a Discount Code
If you want to drive more sales for your product, you could share a discount code with your audience. And to make sure that even more people get to use the discount code, you could work with an influencer to promote it through an Instagram Collab post.
This is a great way to get your products in front of the right people while getting an influential personality to vouch for them. Plus, sharing the discount code could help convince them to make that purchase. Just be sure to include appropriate disclaimers for sponsored Instagram posts.
For example, Spanish mattress company Maxcolchon partnered with influential home décor account Sweet Home Pat to promote a 17% discount for their mattresses. The influencer created an Instagram Collab post featuring the brand’s mattress and encouraged people to use the discount.
Cross-Promoting Your Other Accounts
A popular way to use the Instagram Collabs feature is for cross-promoting your other accounts. This is an excellent option if you have separate personal and professional accounts, for example. Influencers or celebrities who created their own brand often use the feature for this, as seen in the Aimee Song example from earlier. It’s also a good option if you maintain separate accounts for different product lines and brand ventures.
This is a great way to boost visibility especially if you have a significantly larger following in one of your accounts. For example, beauty influencer Huda Kattan created the following Instagram Collab post from her main Huda Beauty account, where she has over 50 million followers, and tagged the Huda Beauty Shop, which has about 6 million.
Showing Influencers Featuring Your Products
Brands can instantly gain credibility by having an influencer use or feature their products. And the Instagram Collabs feature makes the process much more straightforward. Whether you share the post or the influencer shares it, it will show up on both of your profiles. That means you can simultaneously show your followers and the influencer’s followers that your products are being vouched for.
As a result, you can instantly win the trust of the influencer’s followers. And it could boost trust and loyalty even with your existing audience.
For example, Asos created the following Instagram Collab post in which Millie Grace Court wore an Asos Jacket. The influencer even mentioned that she’s in the process of shooting a major drop with the ecommerce brand. As expected, the post garnered lots of engagement with almost 92,000 likes.
Get to Collaborating
Not only do you know how to create an Instagram Collab post, you also have some great ideas to leverage the feature to your advantage. Whether you’re a brand, an organization, or an influencer, the Collabs feature can be a great way to reach more people and boost your engagements. Make the most of the ideas above to get started with your collaborations.
Frequently Asked Questions
How does a Collab work on Instagram?
A Collab on Instagram involves co-authoring a Feed post or a Reel with another user. The post will feature both of your handles and show up on both your profiles.
How many followers do you need to Collab on Instagram?
The Instagram Collab feature is accessible for all users regardless of their follower count.
Can you add more than one collaborator on Instagram?
Instagram allows you to add multiple collaborators for an Instagram Collab post. At the most, you can tag and/or collaborate with a total of up to 20 accounts.
Can you invite a collaborator after posting?
You can only add collaborators to your Instagram post before publishing it.
How do you delete collaborations on Instagram?
To delete collaborations on Instagram, open the post and tap on the options icon (which looks like three vertical dots). Then select “Stop Sharing” and confirm.
