TikTok has been embracing online shopping and businesses over the last few years, paving the way for TikTok Shopping to become a reality. They have moved a long way from being merely an app where people lip-synched to their favorite tunes and become one of the leading platforms for social commerce.
TikTok officially launched TikTok Shop in mid-2021, initially trialing it in a selection of Asian countries, later expanding their trial to the United Kingdom. They opened it up to United States users in September 2023 (after a short beta period) to make social commerce available to a wide audience.
In the process, TikTok has transformed into more than just a social platform — it's now a dynamic search engine and a fully integrated shopping destination. U.S. business accounts can sell directly through the app using shoppable videos, in-feed product listings, and Live Shopping. As of 2025, over half of U.S. marketers are actively leveraging TikTok Shop, even as regulatory uncertainty continues to hover over the platform.
So just how successful has TikTok Shop been — especially in the face of a potential U.S. ban and simultaneous global expansion into markets like France, Germany, and Brazil? How much revenue is it generating, and what exactly are people buying? Has social commerce shifted consumer behavior in a meaningful way? To answer all that and more, we’ve pulled together the latest TikTok Shop statistics to give you a clear picture of where things stand today.
Before we begin, TikTok Shop is no longer a trend - these stats prove it. Because of that, we have created the Ultimate TikTok Shop Buyer Guide that addresses key questions and doubts you might have.

TikTok Followers Growth
- 1. TikTok Shop’s U.S. Market Surpasses Southeast Asia in Sales Value
- 2. Despite the U.S. Leading in Sales Value, Over 95% of TikTok Shop Sales Volume Has Come from Southeast Asia Since Launch
- 3. 11% of US Households Have Made a TikTok Shop Purchase
- 4. More Than 50,000 TikTok Shops in Indonesia
- 5. Wide Variety of Stores on TikTok Shop, But the Largest Categories are Womenswear & Underwear and Beauty & Personal Care (Nearly 15K Stores Each)
- 6. Nearly 5% of all Stores on TikTok Shop and 4.5% of Sales (GMV) Relate to Muslim Fashion
- 7. Beauty & Personal Care Products Are the Highest-Grossing Category on TikTok Shop
- 8. TikTok Shop Sold More Than 2/3 of Total Social Shopping Gross Merchandise Value (GMV) in February 2024
- 9. More Than 80% of TikTok Shop Sales Come from Repeat Customers
- 10. Shoppers Earning Between $55k-$90k a Year Are the Largest US Spenders on TikTok Shop
- 11. 18-24 Year-Olds 3.2x As Likely the Average Shopper to Spend Using TikTok Shop
- 12. TikTok Shop Was Expected to Lose Over $500 Million in the US in its First Year
- 13. 97% of TikTok Shop Customers Also Use Amazon (with 12% of Amazon’s, in turn, Using TikTok Shop)
- 14. TikTok Shop Targets 200% Growth in the U.S. Despite Ban Threat
- 15. Americans Now Spend $32 Million Per Day Shopping on TikTok
- 16. Nearly 4 in 10 TikTok Shoppers Actively Search for Products
- 17. Creator Collaborations Drive 27% Higher Ad Recall Than Traditional Ads
- 18. Users Are 1.7x More Likely to Purchase Through TikTok LIVE
- 19. TikTok Shoppers Turn to the App for Inspiration and Product Research
- 20. TikTok Helps Small Brands Break Through — 79% of Users Discover New Products
- TikTok Shop Is Just Getting Started
- Frequently Asked Questions
1. TikTok Shop’s U.S. Market Surpasses Southeast Asia in Sales Value
TikTok Shop experienced explosive growth in 2024, with the United States overtaking all Southeast Asian countries to become the platform’s largest market by sales value. According to a joint report from Momentum Works and Tabcut, global GMV surged to $33.2 billion in 2024 — more than doubling year-over-year. The U.S. alone contributed $9 billion of that total, marking a staggering 650% increase just 16 months after TikTok Shop launched stateside in September 2023.
This growth was largely driven by content: 58% of U.S. GMV came from short-form videos, followed by 32% from in-app shops, and just 10% from livestreaming. Influencers played a major role, generating $5.4 billion in GMV through videos and live sessions.
While live commerce is still in its early stages in the U.S., TikTok is pushing hard to grow the segment, with only four live sessions surpassing $1 million in sales throughout 2024. Despite nearly half of TikTok’s 398,000 U.S. stores recording zero sales, over 1,000 stores surpassed $1 million in annual GMV — a clear sign of the platform’s power to create breakout success.
2. Despite the U.S. Leading in Sales Value, Over 95% of TikTok Shop Sales Volume Has Come from Southeast Asia Since Launch
According to cumulative data from Aftership, which covers sales from TikTok Shop’s initial launch in mid-2021, more than 95% of the total number of items sold on TikTok Shop were purchased by users in Southeast Asian countries—specifically Thailand, Philippines, Malaysia, Vietnam, Indonesia, and Singapore.
This dominance in sales volume is largely due to TikTok Shop launching much earlier in Southeast Asia compared to the U.S. and the U.K., giving these regions a considerable head start. While the United States recently surpassed Southeast Asia in total sales value (Gross Merchandise Value or GMV), the sheer volume of transactions remains heavily skewed toward these early-adopting Asian markets.
The total sales volume and the percentage share of sales volume on TikTok Shop so far has been:
- Thailand – 512.79 million sales, 25.84% share
- Philippines – 500.51 million sales, 25.22% share
- Malaysia – 311.03 million sales, 15.67% share
- Vietnam – 296.21 million sales, 14.93% share
- Indonesia – 272.9 million sales, 13.75% share
- United States – 45 million sales, 2.27% share
- United Kingdom – 42.39 million sales, 2.14% share
- Singapore – 3.4 million sales, 0.17% share
These figures will undoubtedly change once we have full-year figures for the United States, United Kingdom, and other countries with little or no participation in TikTok Shop to date.
3. 11% of US Households Have Made a TikTok Shop Purchase
The United States may still have a relatively low percentage of total TikTok Shop sales, but according to an Earnest Analytics Case Study on the platform credit card data indicates that over 11% of US households have made a TikTok Shop purchase since the platform’s debut in that country. TikTok’s already strong social media position gave its Shop the ability to quickly scale, taking advantage of its extensive advertising reach and promotions during the 2023 holiday season.
TikTok Shop sales peaked at 145% higher in November 2023 compared to its first month, although have stabilized at a (slightly) lower level since. By February 2024, US sales were 219.4% higher than in TikTok Shop’s first US month.
4. More Than 50,000 TikTok Shops in Indonesia
We have observed how, with TikTok Shop still being so new, most sales (both by GMV and volume) have occurred in Southeast Asia. Perhaps it is inevitable that the highest percentage of stores on the platform are also based in that part of the world, although the number of US TikTok Shops is comparatively higher than you would expect at this stage of the platform’s evolution.
Aftership reports that there are 264.48K stores in total selling via TikTok Shop. The geographical distribution of these stores is as follows:
- Indonesia – 54.28K stores, 20.52% share
- Thailand – 48.37K stores, 18.29% share
- Vietnam – 46.38K stores, 17.54% share
- Malaysia – 34.23K stores, 12.94% share
- United States – 31.29K stores, 11.83% share
- Philippines – 30.78K stores, 11.64% share
- United Kingdom – 16.38K stores, 6.19% share
- Singapore – 2.74K stores, 1.04% share
In addition to the above list, 38 stores sell on TikTok Shop that are based elsewhere.
5. Wide Variety of Stores on TikTok Shop, But the Largest Categories are Womenswear & Underwear and Beauty & Personal Care (Nearly 15K Stores Each)
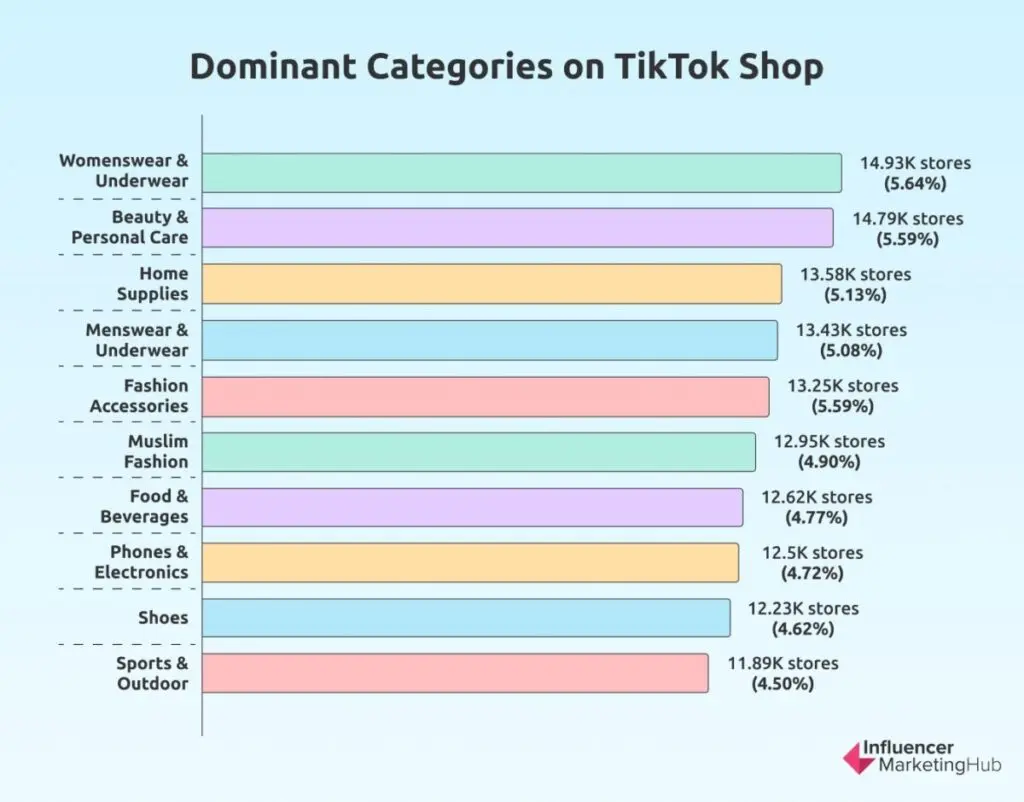
As an indication of just how many different types of merchandise you can find on TikTok Shop, Aftership lumps more than half of TikTok Shop’s 264.5K stores together in the Other category (50.03%). It categorizes the remaining 132.16K stores into the following categories (the percentages shown are of the total stores figure):
- Womenswear & Underwear – 14.93K stores (5.64%)
- Beauty & Personal Care – 14.79K stores (5.59%)
- Home Supplies – 13.58K stores (5.13%)
- Menswear & Underwear – 13.43K stores (5.08%)
- Fashion Accessories – 13.25K stores (5.59%)
- Muslim Fashion – 12.95K stores (4.90%)
- Food & Beverages – 12.62K stores (4.77%)
- Phones & Electronics – 12.5K stores (4.72%)
- Shoes – 12.23K stores (4.62%)
- Sports & Outdoor – 11.89K stores (4.50%)
The above figures show that Clothing/Apparel is clearly the main type of product that businesses market in TikTok Shop. If we isolate Womenswear & Underwear, Menswear & Underwear, Fashion Accessories, Muslim Fashion, and Shoes, we find 66.79K stores (ignoring any niche apparel items included in Other), making up 25% of all TikTok Shops.
6. Nearly 5% of all Stores on TikTok Shop and 4.5% of Sales (GMV) Relate to Muslim Fashion
Western readers may be surprised to learn that there are 12.95K stores (5.59%) selling Muslim fashion on the platform. They have sold 96.92 million products (4.88%) and the value of these sales has been $506.00 million (4.56%).
However, this is very much related to TikTok having trialed TikTok Shop in Southeast Asia for longer than anywhere else. There are 277 million Muslims in Southeast Asia (40.8% of the region’s population), with 231 million Muslims in Indonesia alone. Therefore, it is unsurprising that Muslim fashion currently has such a prominent position in TikTok’s overall statistics at this time.
7. Beauty & Personal Care Products Are the Highest-Grossing Category on TikTok Shop
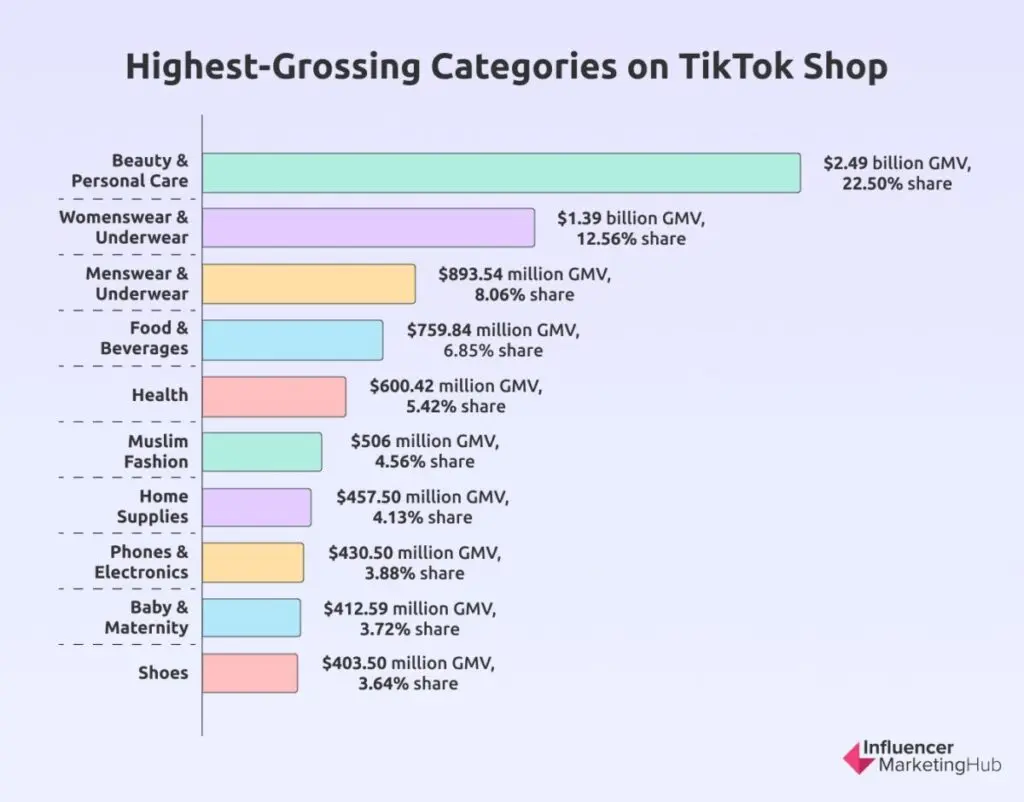
We have seen that stores at TikTok Shop sell products in a wide range of categories, so many that Aftership lumps half of them into an Other category to make reporting manageable. When you look at Gross Merchandise Value (GMV), however, there are a few categories that dominate TikTok sales. Remember, GMV reflects the monetary value of transactions within the TikTok eCommerce platform.
The highest-grossing product categories on TikTok Shop are:
- Beauty & Personal Care - $2.49 billion GMV, 22.50% share
- Womenswear & Underwear - $1.39 billion GMV, 12.56% share
- Menswear & Underwear - $893.54 million GMV, 8.06% share
- Food & Beverages - $759.84 million GMV, 6.85% share
- Health - $600.42 million GMV, 5.42% share
- Muslim Fashion - $506 million GMV, 4.56% share
- Home Supplies - $457.50 million GMV, 4.13% share
- Phones & Electronics - $430.50 million GMV, 3.88% share
- Baby & Maternity - $412.59 million GMV, 3.72% share
- Shoes - $403.50 million GMV, 3.64% share
8. TikTok Shop Sold More Than 2/3 of Total Social Shopping Gross Merchandise Value (GMV) in February 2024
According to the Earnest Analytics Case Study, TikTok Shop sold 68.1% of the total social shopping GMV in February 2024, livestream shopping app Whatnot captured 31% of GMV, and the remaining 0.9% was shared by Instagram Checkout, Facebook Shop, and Flip App.
Clearly, social commerce is in its infancy and has been slower to take off than some originally projected. The TikTok Shop marketplace outgunning its Meta competitors by such a large margin will have Mark Zuckerberg thinking hard, although these statistics don’t include trade on Facebook Marketplace. EMarketer notes that 64.6 million US consumers are expected to buy something via Facebook this year, compared to 40.7 million on TikTok when you include Facebook Marketplace sales.
By 2025, TikTok’s momentum continued: industry analyses noted that TikTok Shop’s monthly U.S. sales exceeded $1 billion since mid-2024. This sustained dominance indicates TikTok Shop’s outsized role in driving U.S. social commerce growth.
9. More Than 80% of TikTok Shop Sales Come from Repeat Customers
The Earnest Analytics Case Study found that 81.3% of TikTok Shop sales came from existing customers in February 2024. This was up considerably from November 2023, when the repeat customer rate was only 64% - a logical change with TikTok Shop being so new in the US at that point.
This shows that TikTok Shop has proven popular with its early adopters who have continued to make purchases using the platform. Through 2025, this trend holds, indicating that a large majority of TikTok Shop’s sales are from return shoppers – a positive sign of customer satisfaction and stickiness in the platform’s first full year.
10. Shoppers Earning Between $55k-$90k a Year Are the Largest US Spenders on TikTok Shop
The Earnest Analytics Case Study also broke down the demographics of those who used the credit card system to make purchases via TikTok Shop. Earnest Analytics doesn’t specify it, but their commentary suggests all their data relates to USA purchases only.
They found that TikTok Shop sales grew fastest among shoppers earning between $55k-$90k a year during its first 6 months in the USA. This range straddles the US median income. This suggests that TikTok Shoppers skew slightly more affluent than the average TikTok user (who is typically a Gen Z).
This pattern remains evident into 2025: TikTok Shop shoppers skew a bit more affluent than the average TikTok user, highlighting how the platform has attracted a broad demographic beyond just teens, likely due to purchasing power and comfort with online shopping.
11. 18-24 Year-Olds 3.2x As Likely the Average Shopper to Spend Using TikTok Shop
While it tends to be relatively affluent shoppers who use TikTok Shop, that doesn’t mean that TikTok’s typical Gen Z users aren’t purchasing on the platform. The likelihood that different-aged shoppers spend on TikTok Shop decreases with each older age group, although shoppers seem to prefer using the platform more than average shoppers up until their mid-50s. According to the Earnest Analytics Case Study, compared to the average shopper:
- 18-24-year-olds are 3.2x more likely to use TikTok Shop than the average shopper
- 25-34-year-olds are 1.8x more likely to use TikTok Shop than the average shopper
- 35-44-year-olds are 1.3x more likely to use TikTok Shop than the average shopper
- 45-54-year-olds are 1.1x more likely to use TikTok Shop than the average shopper
- 55-64-year-olds are 0.7x more likely to use TikTok Shop than the average shopper
- 65+ year-olds are 0.3x more likely to use TikTok Shop than the average shopper
12. TikTok Shop Was Expected to Lose Over $500 Million in the US in its First Year
The Information reported that TikTok was expecting to lose over $500 million in the US in its first year thanks to ByteDance’s significant investments to hire staff, build a fulfillment network, and incentivize sellers by offering free listings, free shipping, zero commissions, and warehousing space. TikTok expected that daily shopping volume would steadily rise, possibly exceeding $10 million by year-end. As we can see from the GMV figures above it isn’t at that level yet, but TikTok Shop appears to be popular with US consumers, and it will be interesting to see actual results for TikTok Shop’s first US year.
13. 97% of TikTok Shop Customers Also Use Amazon (with 12% of Amazon’s, in turn, Using TikTok Shop)
In perhaps the least surprising statistic from the Earnest Analytics Case Study we highlight here, nearly all TikTok Shop purchasers (97%) also shop at Amazon. Arguably more interestingly, 55% of TikTok Shop users shop at Etsy, 39% use Temu, 38% Old Navy, and 37% Shein.
Conversely, 12% of Amazon’s customers use TikTok Shop, and 17% of Etsy’s customers use the platform, as do 25% of Temu’s customers, 16% of Old Navy’s customers, and 28% of Shein’s customers. These 2024 findings remain relevant in 2025, underscoring TikTok Shop’s deep integration into U.S. shopping habits – TikTok shoppers are savvy and multi-channel, even while flocking to TikTok Shop for social commerce convenience.
14. TikTok Shop Targets 200% Growth in the U.S. Despite Ban Threat
TikTok Shop is projecting nearly 200% growth in the U.S. for 2025, despite ongoing regulatory scrutiny and the potential for a nationwide ban. Globally, the platform is targeting almost 100% overall growth, with new market entries planned in Italy, Germany, France, Brazil, and Japan. In the U.S., short-form videos account for 40% of GMV, while TikTok Shop contributes 30%, and livestreaming trails at just 10%—well below Douyin’s 70% livestream share in China.
TikTok has also started capturing market share from competitors. In January 2025, transactions over $25 on TikTok Shop rose 16 percentage points year-over-year, outpacing Temu, whose lower-value purchases grew by just 7 points. The platform is actively improving its algorithm and livestream operations to close the performance gap, all while brands shift strategies—adding cross-platform clauses to influencer contracts and investing more in first-party data to prepare for potential disruptions.
15. Americans Now Spend $32 Million Per Day Shopping on TikTok
TikTok Shop has rapidly become a staple in U.S. online shopping behavior. According to Capital One Shopping, Americans spent an estimated $32 million per day shopping on TikTok in 2024. This surge in daily spend reflects just how deeply TikTok has embedded itself into the broader eCommerce ecosystem—especially considering the platform only launched its Shop feature in the U.S. in late 2023.
By the end of 2024, 47.2 million Americans had made purchases through TikTok Shop, marking a 34.2% year-over-year increase. And with U.S. users spending an average of 47.3 minutes per day on the app—nearly 50% more than Instagram—TikTok’s ability to blend entertainment with impulse-driven shopping is proving remarkably effective. Projections suggest U.S. TikTok shopper numbers will climb to 55.6 million by 2027, signaling that this daily spend figure is likely just the beginning.
16. Nearly 4 in 10 TikTok Shoppers Actively Search for Products
TikTok is no longer just a scroll-and-stumble platform — it’s becoming a destination for intentional product discovery. According to Capital One Shopping, 39.1% of TikTok shoppers actively search for products on the platform, reflecting a shift in behavior where users are treating TikTok more like a hybrid of a search engine and shopping mall. This is especially true for younger users: 17% of U.S. adults now start their product searches on TikTok, and 22% research items there before looking elsewhere.
This shift is being led by Gen Z, nearly 45% of whom make up TikTok’s user base. Over half of Gen Z consumers say they shop or discover products on TikTok monthly, and 68% are likely to purchase directly on the platform. Creators play a huge role in driving this behavior — 49% of users say TikTok influencers inspire them to explore new products and brands. For a generation used to personalized content and quick access to trends, TikTok has become a trusted shopping touchpoint.
17. Creator Collaborations Drive 27% Higher Ad Recall Than Traditional Ads
Branded creator collaborations are proving to be far more than a trend — they’re outperforming traditional social advertising. Data shows that ads featuring creators deliver a 27% higher ad recall rate compared to standard brand ads, underscoring just how effective influencer-driven content is at capturing attention and staying top-of-mind with users.
This aligns with broader user behavior on the platform, where over 60% of shoppers say they trust brands more when they’re endorsed by creators rather than served as in-feed ads. As more users turn to TikTok for product discovery and inspiration, brands that lean into authentic partnerships — rather than polished campaigns — are the ones seeing real impact. The takeaway is clear: on TikTok, trust and influence go hand in hand.
18. Users Are 1.7x More Likely to Purchase Through TikTok LIVE
Live shopping on TikTok isn’t just an experiment — it’s quickly becoming one of the most effective conversion tools on the platform. Shoppers are 1.7 times more likely to make a purchase through a TikTok LIVE session compared to standard video or shop listings, showing that real-time engagement has a measurable impact on buyer behavior.
While livestreaming is still gaining traction in the U.S., the format is already outperforming traditional social commerce in driving conversions. Viewers often respond to the urgency, authenticity, and interactivity of live content — especially when paired with influencer-led product demos and exclusive offers. For brands looking to move beyond passive content, TikTok LIVE presents a powerful opportunity to turn attention into action.
19. TikTok Shoppers Turn to the App for Inspiration and Product Research
TikTok’s role in the shopping journey starts well before the checkout. According to recent data, 58.2% of TikTok shoppers use the platform for shopping inspiration, browsing through content to discover new trends, styles, and must-have products. It’s not just casual scrolling — 47.9% of users also use TikTok to gather product information, making the app a key research tool in the decision-making process.
This positions TikTok as a hybrid space — part entertainment feed, part personalized product catalog. Users are engaging with content not only to be entertained but also to evaluate what to buy next. For brands, this means visibility on TikTok isn’t just about exposure; it’s about showing up in the moments when shoppers are curious, open-minded, and ready to act.
20. TikTok Helps Small Brands Break Through — 79% of Users Discover New Products
TikTok continues to level the playing field for small businesses. Data shows that 79% of users who encounter content from small brands on the platform end up discovering new products as a result. It’s a clear signal that TikTok’s algorithm-driven feed and creator-powered ecosystem give smaller sellers a real shot at visibility — and sales.
Unlike traditional marketplaces where paid reach dominates, TikTok allows even niche or emerging brands to surface through authentic content and community engagement. From unboxings to tutorials, shoppers are discovering products not through ads, but through stories and recommendations that feel personal. For small businesses, the platform remains one of the most accessible ways to drive real product discovery at scale.
TikTok Shop Is Just Getting Started
TikTok Shop has quickly evolved from an experimental feature into one of the most powerful forces in social commerce. With billions in annual sales, a rapidly growing U.S. user base, and new market launches on the horizon, it’s clear the platform is only scratching the surface of its potential. From viral product discovery to influencer-driven live shopping, TikTok is reshaping how people browse and buy online.
As the platform continues to expand into Europe, Latin America, and beyond, the opportunities for brands, creators, and small businesses will only multiply. Whether you're selling skincare, sneakers, or something in between, now is the time to get in the game. TikTok Shop isn't just a trend—it's the future of online retail.
Interested in starting your TikTok Shop journey? Learn how to Set Up Your TikTok Shop today! Also, consider hiring TikTok Shop Influencer Agencies to help you get the ball rolling!
Frequently Asked Questions
What are the key metrics to track in TikTok Shop analytics?
Key metrics to track in TikTok Shop analytics include:
- Product Views: The number of times your product pages have been viewed.
- Click-Through Rate (CTR): The percentage of users clicking through from TikTok content to your shop.
- Conversion Rate: The proportion of users who make a purchase after viewing your products.
- Sales Volume: Total revenue generated within a specific timeframe.
- Engagement Rate: User interactions like likes, comments, and shares related to your shop or ads.
These metrics help you gauge the effectiveness of your campaigns and identify areas for improvement.
Why do TikTok Shop stats sometimes show delays or inaccuracies?
TikTok Shop stats may show delays or inaccuracies due to the platform’s data refresh cycles. Analytics typically update every 24 hours, which can result in temporary discrepancies. Additionally, bugs in the system or cache issues might lead to metrics not displaying correctly. To ensure accuracy, clear your browser cache, verify settings in your TikTok Pro account, and cross-check data with external tools like Shopify analytics if integrated.
What is considered a good conversion rate for TikTok Shop?
A good conversion rate for TikTok Shop typically falls between 2% and 5%, depending on your niche and target audience. For high-performing categories like beauty and fashion, conversion rates can exceed 5%. Factors influencing conversion rates include compelling product presentations, effective TikTok ads, and user trust in your shop. Optimize your listings with engaging videos, clear descriptions, and competitive pricing to improve results.
How can I increase sales through TikTok Shop?
To increase sales through TikTok Shop:
- Leverage Influencer Marketing: Partner with TikTok shop influencers to showcase your products authentically.
- Optimize Video Content: Use engaging, high-quality videos highlighting your product’s unique features.
- Run Targeted Ads: Use TikTok’s ad platform to reach the right audience based on interests and behaviors.
- Engage with Viewers: Reply to comments and questions promptly to build trust.
- Offer Exclusive Deals: Provide discounts or limited-time offers to create urgency.
By focusing on these TikTok shopping strategies, you can drive higher engagement and conversions.
Does TikTok Shop offer third-party analytics integrations?
Currently, TikTok Shop does not have robust third-party analytics integrations due to the absence of an open API. Sellers can access basic metrics through the TikTok Pro account’s dashboard, but deeper insights require manual exports or supplementary tools like Shopify for connected stores. Businesses seeking advanced analytics may need to rely on external platforms for tracking user behavior beyond TikTok’s ecosystem.
How successful is TikTok Shop?
TikTok Shop has quickly become a major player in the eCommerce space. In 2024 alone, it generated $33.2 billion in global sales, more than doubling its GMV year-over-year. The U.S. emerged as TikTok Shop’s largest market, reaching $9 billion in sales just 16 months after launch. With millions of daily transactions and a growing ecosystem of sellers, creators, and shoppers, TikTok Shop is now a top destination for social commerce.
How do I check my TikTok Shop rating?
To check your TikTok Shop rating, log in to your TikTok Shop Seller Center. Once logged in, navigate to “Account Health” or “Performance” from the dashboard menu. There, you’ll see your shop rating, including order fulfillment rate, customer feedback, and overall seller score. These ratings help maintain trust and visibility on the platform, so monitoring them regularly is key.
What category sells the most on TikTok Shop?
As of 2025, Beauty & Personal Care is the highest-grossing category on TikTok Shop, generating $2.49 billion in GMV, which accounts for more than 22% of total sales. This is followed by Womenswear & Underwear, and Menswear & Underwear. Skincare, cosmetics, and haircare products are especially popular, driven by influencer reviews, tutorials, and viral content.
How fast is a TikTok Shop growing?
TikTok Shop is growing at an exceptional rate. In 2024, it experienced over 100% global growth, with the U.S. market alone expanding by 650% year-over-year. The platform now hosts hundreds of thousands of stores and millions of influencers creating shopping content daily. With new market launches planned across Europe and Latin America, TikTok Shop is expected to continue its rapid expansion through 2025 and beyond.
