In a world where digital transactions are the new norm, there's a pulsating discourse about the role of technology and innovation in shaping the future of e-commerce. Some advocate for a more human-centric approach, while others champion the power of artificial intelligence and machine learning. Regardless of the perspective, one thing is clear - e-commerce is not just about transactions; it's about creating unique, personalized experiences that resonate with consumers. E-commerce has witnessed exponential growth, and while factors like convenience and wide product range play a significant role, they don't entirely encapsulate why e-commerce has become so indispensable. At the heart of this value lies the ability to cater to the evolving needs of consumers in real-time, providing them with a seamless shopping experience. This commitment to customer satisfaction and continuous innovation is what sets the e-commerce industry apart in 2023. According to McKinsey, the future of B2B sales is hybrid, with hybrid selling expected to be the most dominant sales strategy by 2024 due to shifts in customer preferences and remote-first engagement. This approach drives up to 50% more revenue by enabling broader, deeper customer engagement and unlocking a more diverse talent pool than more traditional models. Winning B2B organizations are actively shifting towards a more hybrid sales force by implementing four key actions that support success.
Key 40+ eCommerce Stats That will Blow your Mind in 2023 (UPDATED) :
eCommerce | Notable Stats |
What is the projected growth of e-commerce sales in the United States? | The e-commerce market in the United States is forecasted to increase by 509.4 billion U.S. dollars (+54.19 percent) between 2023 and 2027. |
Which country is leading in global e-commerce in 2023? | In 2023, China is set to lead global eCommerce with projected sales of $3 trillion, followed by the US at just over $1 trillion. |
What is the future forecast for e-commerce by 2025? | E-commerce spending is expected to surge past $7 trillion by 2025, indicating a promising future for the industry. |
Is e-commerce a viable industry in 2023? | Yes, eCommerce is not only viable but thriving in 2023. The global retail e-commerce sales are expected to exceed 6 trillion USD in 2023 and the e-commerce share of total global retail sales is expected to be more than 20%. |
Which countries are experiencing the fastest growth in e-commerce? | The fastest-growing e-commerce countries based on online sales are the Philippines and India, where e-commerce sales are forecast to increase by more than 25 percent in 2022. |
E-commerce Revenue Growth Globally
First off, let's take a look at the bullish strides in e-commerce revenues. The e-commerce market in the United States is forecasted to continuously increase between 2023 and 2027 by a whopping 509.4 billion U.S. dollars (+54.19 percent). Inching closer to the peak, the revenue in 2027 is estimated to reach 1.4 trillion U.S. dollars - a new high.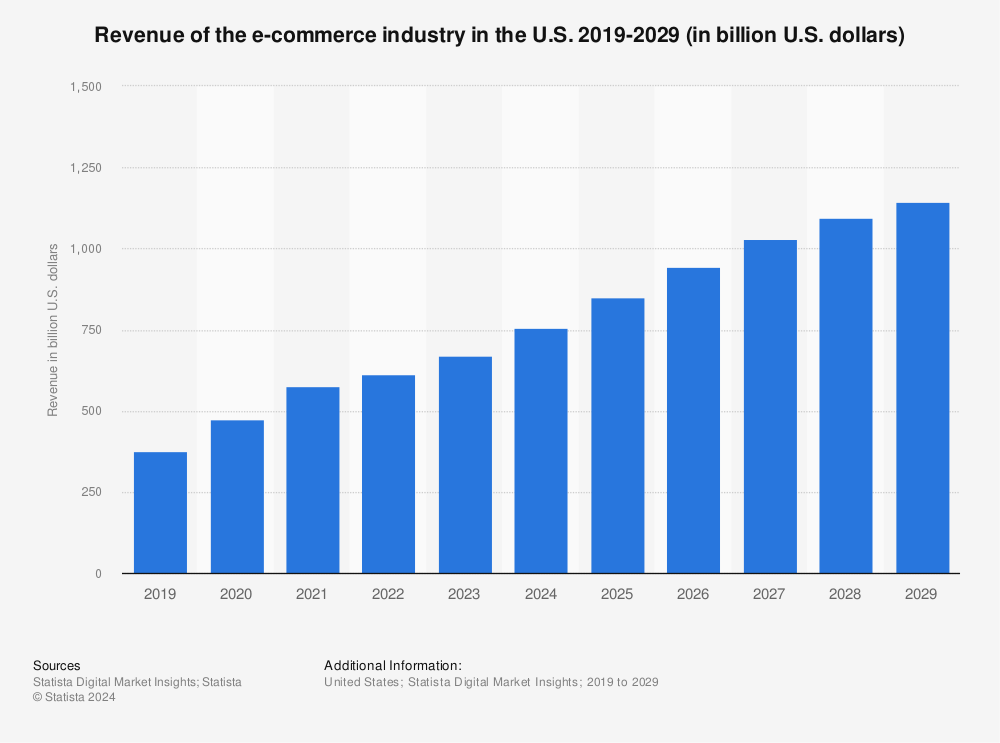
The e-commerce growth isn't limited within the United States. Turning our sights across the borders, Brazil is leading the e-commerce growth race with a 14.6% compound annual growth rate (CAGR) between 2023 and 2027.Additionally, the fastest-growing e-commerce countries based on online sales are the Philippines and India, where e-commerce sales are forecast to increase by more than 25 percent in 2022, further highlighting the global expansion of e-commerce."
Argentina and Turkey are not far behind- they are among the fastest-growing e-commerce markets globally with an impressive CAGR of over 14%. Catering to such rapidly growing markets can form a key pillar of global e-commerce strategies.
For the first time in history, global e-commerce sales are predicted to exceed $5 trillion in 2023. Surprisingly, these figures account for more than a fifth of overall retail sales! With spending expected to surge past $7 trillion by 2025, the takeaway for businesses is clear–unlocking growth opportunities in e-commerce calls for an invigorated focus on creating unique and immersive shopping experiences.
General eCommerce Stats
- Singapore was the fastest-growing eCommerce market in the world in 2022.
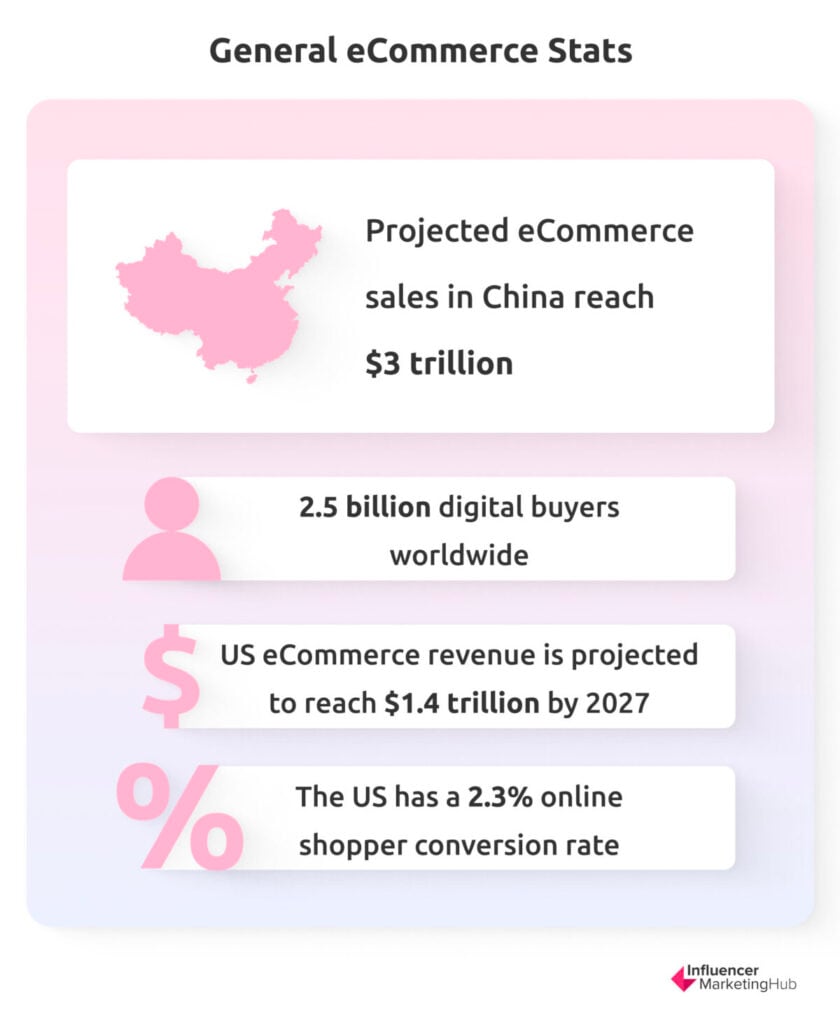
- In 2023, China is set to lead global eCommerce with projected sales of $3 trillion, followed by the US at just over $1 trillion.
- The UK, Japan, and South Korea are next in line, expecting revenues of $196 billion, $193.4 billion, and $147.4 billion respectively.
- It’s predicted that China, the United States, the United Kingdom, Japan, and South Korea will remain the top five markets till 2025.
- There are over 2.5 billion digital buyers in the world.
- By 2027, the US is expected to have 290 million online shoppers, roughly 84% of the population, a decrease from previous estimates due to the current global recession's impact.
- Less than 1 million eCommerce sites sell more than $1,000 per year.
- The Future Shopper Report 2022 found that 57% of spending is currently online, and consumers predict they will still spend 54% online in a post-COVID-19 world.
- The revenue from eCommerce in the United States was expected to add up to over $920 billion in 2023, with a projected growth to $1.4 trillion by 2027.
- Despite this short-term negative growth in eCommerce, global retail eCommerce sales are predicted to reach $5.7 trillion in 2023 and rise to $8.1 trillion by 2026.
- In the United States, the online shopper conversion rate is about 2.3%.
B2B eCommerce Stats
The rise of B2B e-commerce has presented an enticing opportunity for big players to capitalize on. Amazon Business's net sales in 2023 reached a remarkable $75.2 billion - a palpable growth from 2021's $56.5 billion, illustrating the vast potential in B2B e-commerce.
Alibaba too is flexing its power in China's B2B e-commerce market, although a slight decrease is predicted to 28% in 2023 from 30% in 2021. The company has also expanded successfully to India, Europe, and the U.S. Its international commerce retail business generated a sturdy $7.2 billion in the first quarter of 2023.
The message is clear - treading the B2B e-commerce path can unlock enormous growth possibilities for businesses.
Notable B2B eCommerce Statistics:
- 65% of B2B companies were exclusively selling online in 2022, marking the first time B2Bs are more likely to offer ecommerce over in-person sales.
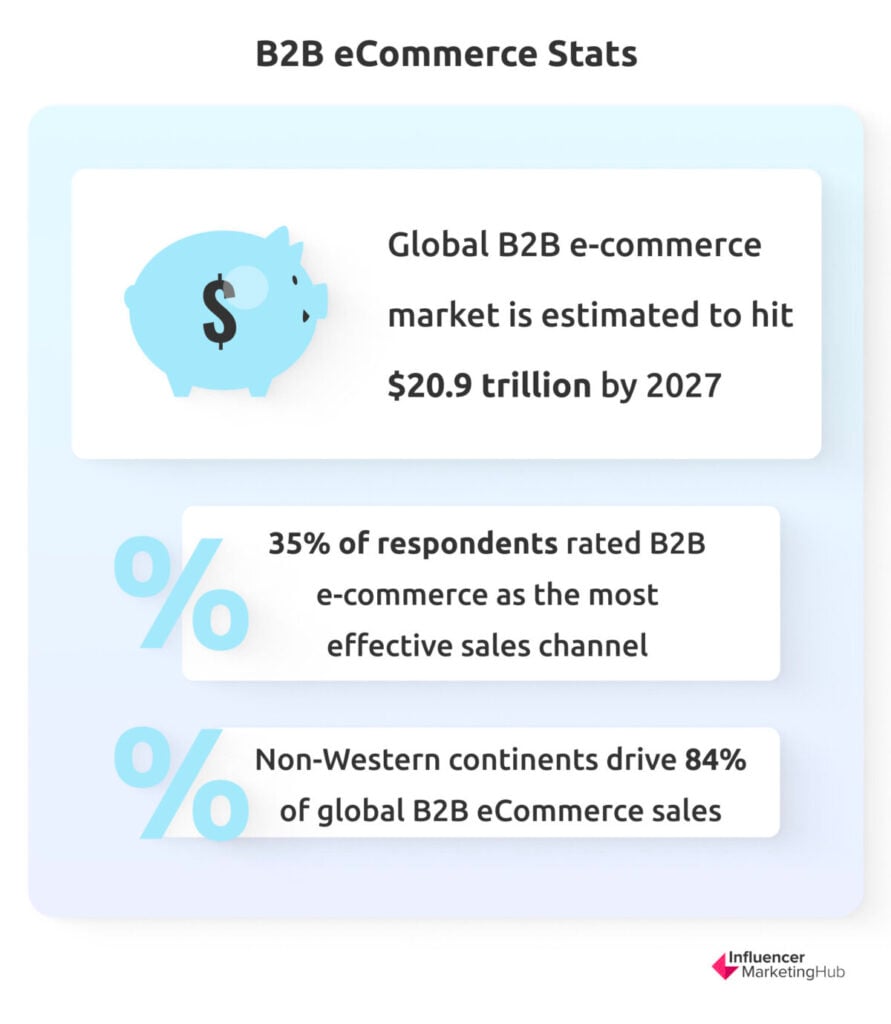
- The global business-to-business e-commerce market size is estimated to reach USD 20.9 trillion by 2027, expanding at a CAGR of 17.5% during the forecast period.
- In a recent survey, B2B e-commerce was estimated to be the most effective sales channel, rated first by 35% of respondents.
- Research suggests that in 2023, an estimated 17% of B2B sales will be generated digitally, up from 13% in 2019.
- By 2022's end, global marketplace transactions surged to $112 billion, a significant rise from under $25 billion in 2020.
- B2B eCommerce sales in non-Western continents account for 84% of all global sales. Asia Pacific has a market share of almost 78%.
- 60% of leading B2B companies had either no or limited e-commerce capabilities at the start of the pandemic.
- Shifts in data privacy trends are negatively impacting marketing performance, with 39% of marketers currently experiencing a decline. In the near term, 56% of marketers expect further declines in marketing performance due to data privacy trends.
B2C eCommerce Stats
A closer look at the global B2B e-commerce market reveals exciting prospects. The global B2B e-commerce market is projected to hit the colossal figure of $20.9 trillion by 2027. Its growth at 17.5% CAGR from 2020 to 2027 further underscores the possibility that the future of e-commerce lies beyond B2C. It's gradually tilting towards B2B. However, nevertheless is B2C eCommerce evolving in such a fashion that markets simply have to keep evolving skills to operate new eCommerce technologies.
Notable B2C eCommerce Statistics:
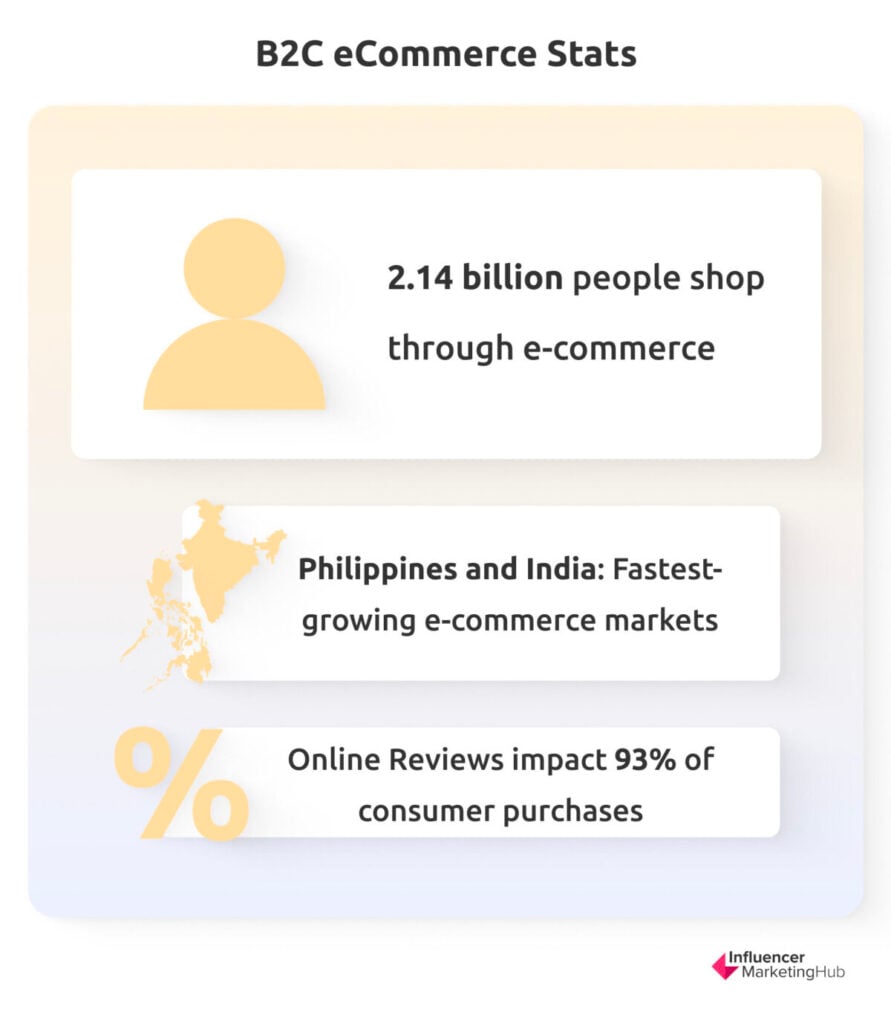
- 2.14 billion people are shopping through e-commerce as of 2023.
- 76% of people will stop doing business with a company after only two poor customer experiences.
- The United Kingdom ranks second with the highest percentage of retail sales taking place online (36 percent), followed by South Korea (32 percent), and Denmark (20 percent) in 2022.
- The fastest growing e-commerce countries based on online sales are the Philippines and India, where e-commerce sales are forecast to increase by more than 25 percent in 2022.
- 93% of consumers say Online Reviews impact purchase decisions.
eCommerce Marketplace Stats
According to Forbes Advisor, e-commerce sales are expected to grow 10.4% in 2023. Since 20.8% of retail purchases are expected to take place online in 2023, it’s no surprise that e-commerce sales are supposed to increase as well.
Research completed by eMarketer and Statista shows that online retail sales will reach $6.51 trillion by 2023, with ecommerce websites taking up 22.3% of total retail sales. Although retail has had it tough since 2020, every national market covered by eMarketer saw double-digit ecommerce growth.
The global retail e-commerce sales are expected to exceed 6 trillion USD in 2023 and the e-commerce share of total global retail sales is expected to be more than 20%3.
Notable eCommerce Marketplace Statistics:
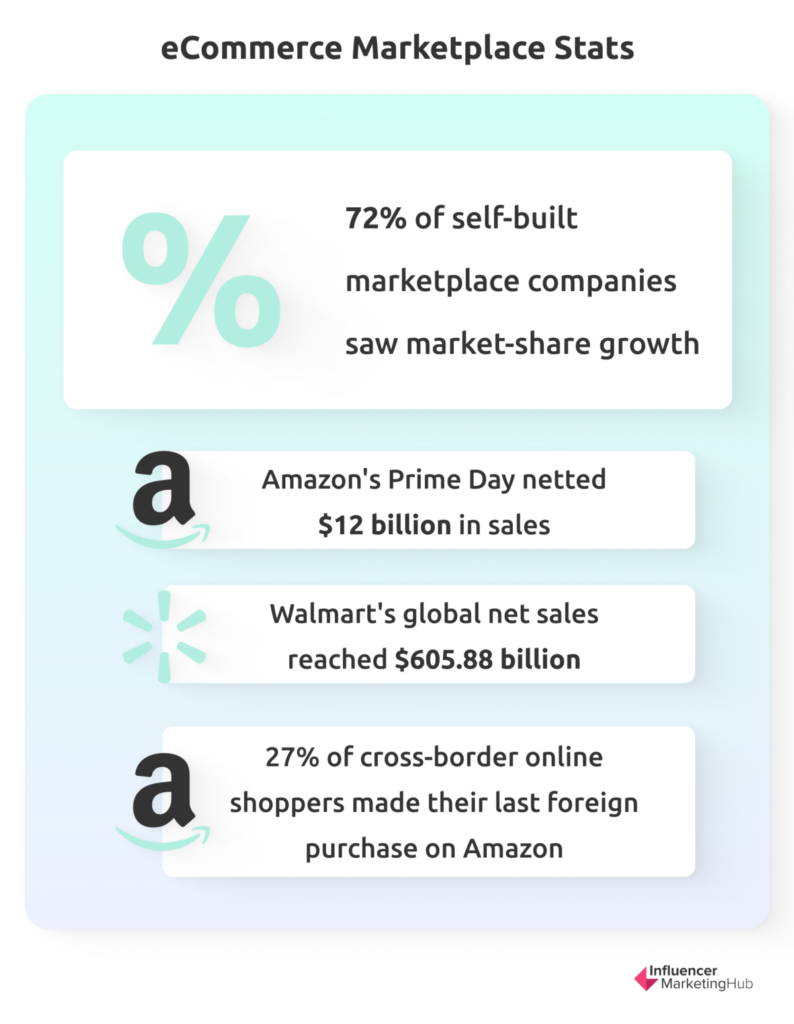
- 72% of companies that built their own marketplace experienced market-share growth over the past two years.
- As of April 2023, Amazon leads global eCommerce, capturing 13% of desktop visits, while eBay follows with 3.1%.
- Amazon's Prime Day 2022 saw 300 million items sold and net sales of $12 billion.
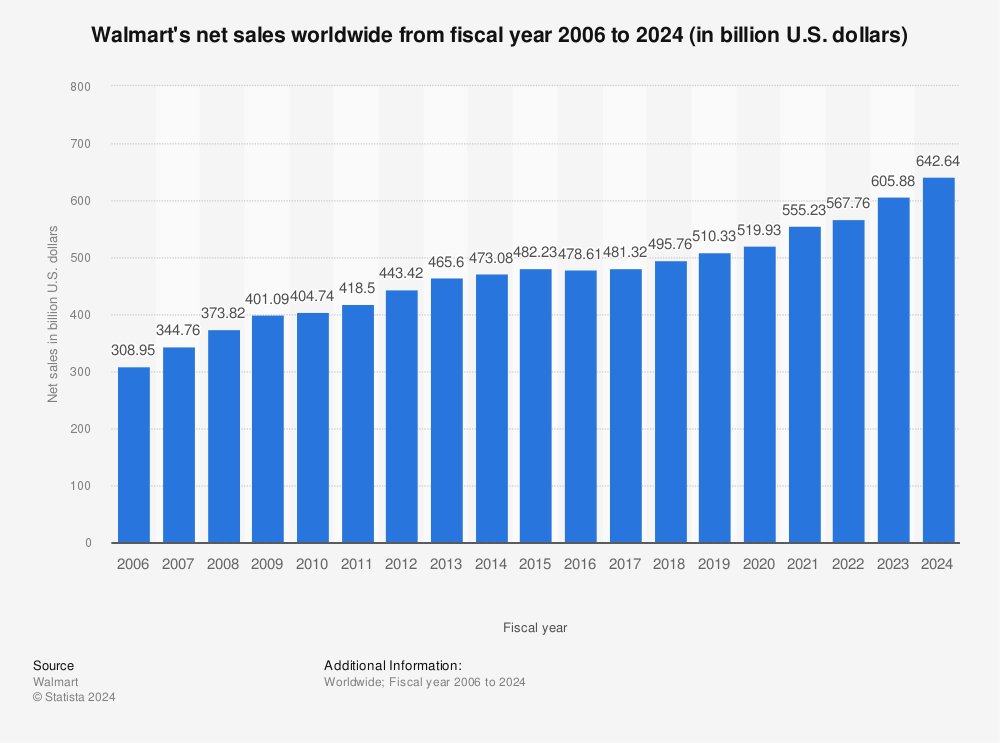
- Walmart's global net sales reached $605.88 billion in the fiscal year ending January 2023.
- 27% of the world's cross-border online shoppers made their last foreign purchase on Amazon, while 17% did so on Alibaba's AliExpress.
- U.S. e-retailers accounted for only 10% of last cross-border online purchases in 2022.
eCommerce Behaviour Stats
It's fascinating to observe the global shifts and trends that are shaping the way consumers interact with online marketplaces. The digital revolution has not only transformed the way we shop but also the way we perceive and engage with brands. In particular, the grocery sector has seen a significant surge in online shopping. A staggering 96% of Chinese grocery shoppers are now purchasing their groceries online, closely followed by 93% in India, 89% in South Korea, and 77% in the Kingdom of Saudi Arabia. This trend underscores the growing comfort and reliance on digital platforms for everyday necessities. Moreover, the effectiveness of multi-channel marketing strategies is becoming increasingly evident. Marketers who utilized at least three channels in their campaigns witnessed a 28% higher purchase rate compared to their counterparts who relied on single-channel marketing. This highlights the importance of a diverse and integrated approach in reaching out to today's digital-savvy consumers.
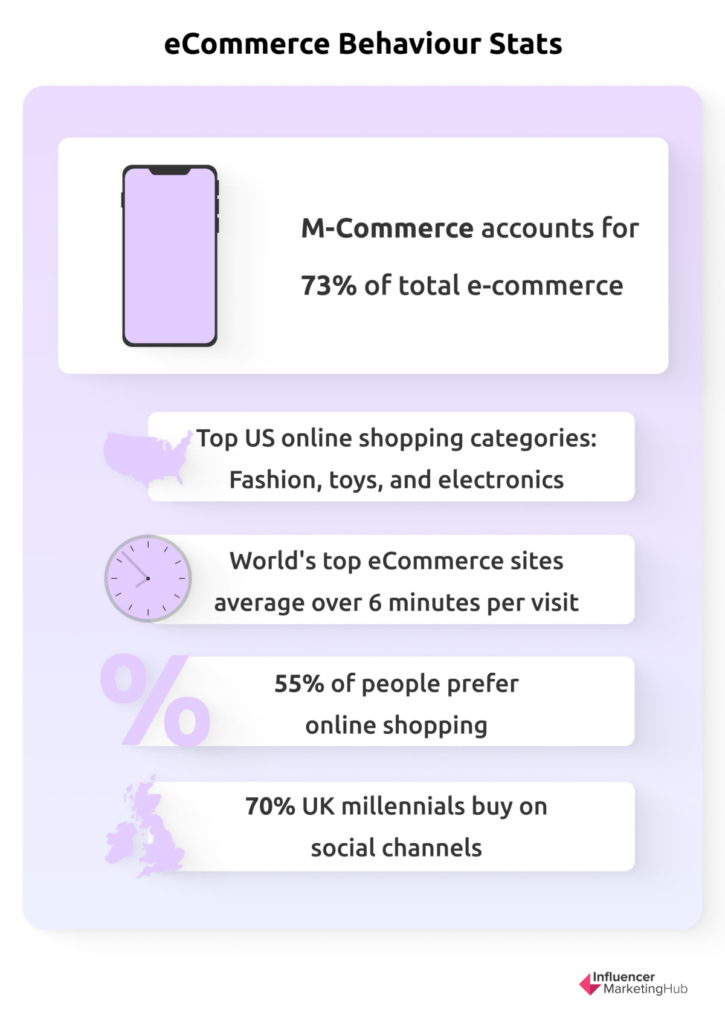
- In 2023, the m-commerce market makes up nearly 73% of total e-commerce.
- Global m-commerce revenue reached $3.5 trillion in 2021.
- A one-second delay in page load leads to a 7% decrease in conversion rates.
- In Q2 2022, the average online order value from a mobile phone in the U.S. was approximately $112, compared to $95 in the EMEA region. Global online orders through direct traffic averaged around $121 during this period.
- Fashion, toys and hobbies, and electronics are currently the most popular online shopping categories in the US.
- The average visit duration is more than 6 minutes for the world’s most popular eCommerce and shopping sites, nearly 8 minutes in the case of Amazon.com.
- On average, visitors browse over 7 pages per visit on top eCommerce sites, with Amazon seeing over 10 pages per visit.
- Globally, around 69.8% of digital shopping carts are abandoned before completing a transaction.
- 55% of people prefer online shopping, and 24% of retail purchases are expected to take place online by 2026.
- In 2023, an estimated 2.64 billion consumers will have completed at least one purchase online.
- 70% of millennials and 78% of Gen Zers in the UK buy directly on social channels.
The Power of Technology: Shaping E-commerce Trends
Businesses striving to seize these e-commerce growth opportunities should harness the transformative power of technological innovations. From Augmented Reality (AR) to Artificial Intelligence (AI), technology is overhauling the way businesses interact with consumers.
Utilizing AR for providing immersive shopping experiences, leveraging AI for personalizing user experiences, and harnessing the power of big data for creating personalized shopping experiences are some of the cutting-edge trends businesses should capitalize on.
To Surf or Stumble on the E-commerce Wave?
As we journey further into 2023, the e-commerce landscape will continue to evolve, riding on the trends of expanding cross-border growth opportunities, rising focus on B2B e-commerce, and technological disruptors.
With this wide canvas painted for 2023, every e-commerce business-owner must ask, "How can I leverage these trends to redefine my business strategy? How am I preparing to pivot effectively to harness these opportunities and navigate potential challenges?"
Your answers to these questions chart the course for your e-commerce venture's success, far beyond 2023!
The e-commerce journey is ever-evolving, and so should our strategies. Hop onto the e-commerce wave, and enjoy a thrilling ride towards success and innovation.


