We have covered Instagram extensively on the Influencer Marketing Hub. Why? Because it is the social platform marketers have found most useful for influencer marketing. One important post is our Ultimate Guide to Instagram Analytics For Marketers. This explains everything you need to know to find statistics and analytics for your Instagram account, so you can gain insight into how well you meet your marketing goals on the platform. But those analytics only cover the performance of one Instagram account – yours. In this post, we are looking at the bigger picture and examining statistics relating to Instagram itself.
Instagram is part of the Meta family of apps, which also includes Facebook, Facebook Messenger, and WhatsApp. We have included their corporate statistics in our Facebook Statistics post, so we won't include them here. You can also find more statistics in our post about Instagram's latest success story, Instagram Reels.
100 Instagram Stats You Need to Know:
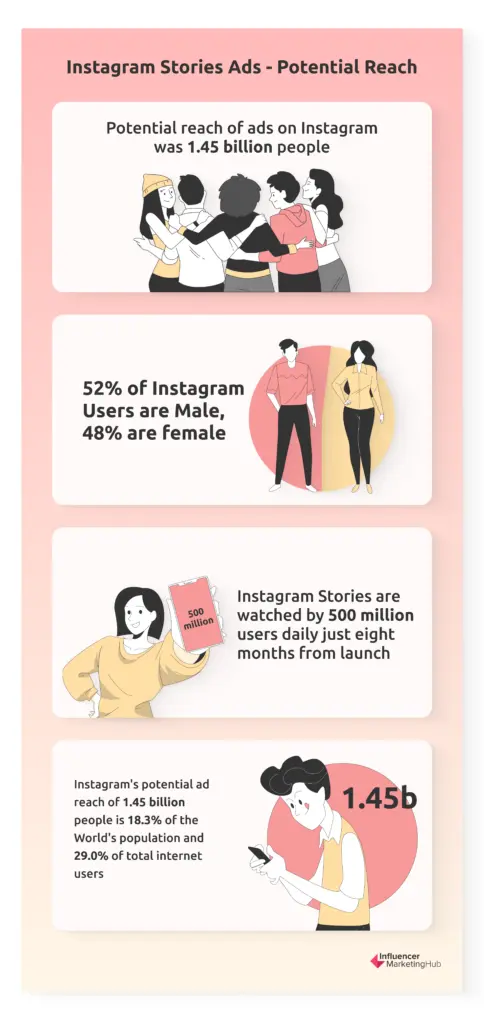
1. The Potential Reach of Instagram Ads is 1.45 Billion People
Kepios analysis of Meta data shows that the potential reach of ads on Instagram as of April 2022 was 1.45 billion people. One coda to this figure is that, along with all other data sourced from Meta, they no longer include Russian data stats due to the Russia-Ukraine war. As of January 2022, Instagram had 63 million users in Russia.
2. 52% of Instagram Users are Male
Surprisingly, Instagram ad reach for males (51.9%) is higher than for females (48.1%). This is particularly evident for younger users, with male users exceeding female users in the 13-17-year-old, 18-24-year-old, and 25-43-year-old age brackets. Although there are fewer older Instagram users, females outnumber males for all age groups, 35 years old and older. This makes sense as older males are less likely to use social media than other demographics.
3. 1.0 Billion Potential Reach for Ads in Instagram Stories
Potential reach differs by placement type on Instagram as follows:
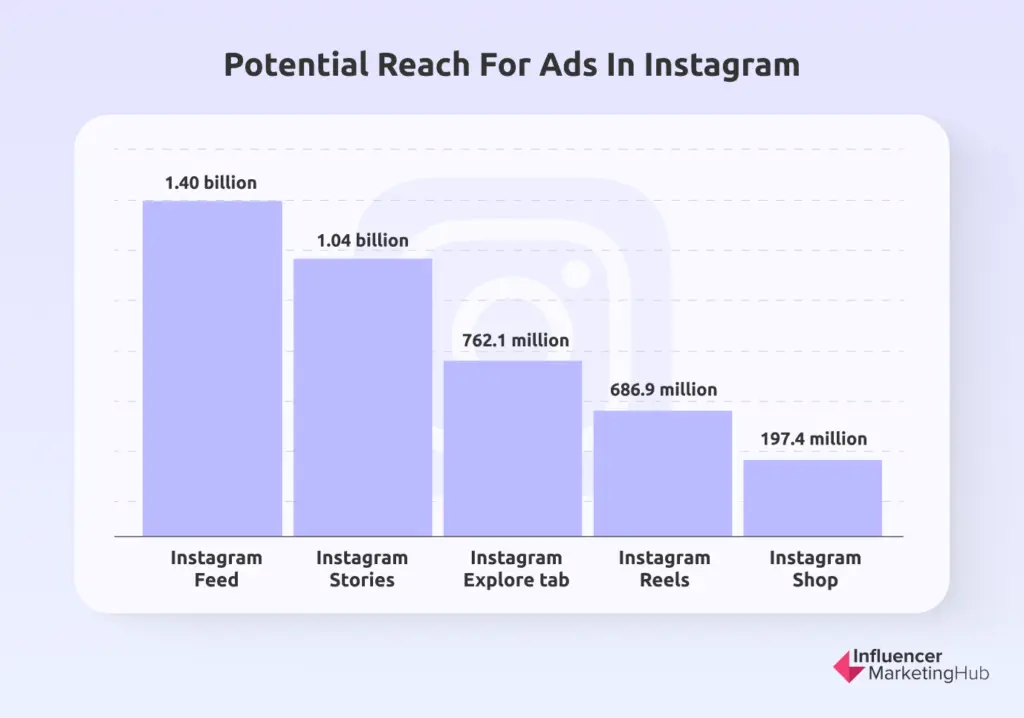
Interestingly, although the male audience for Instagram is greater than the female audience overall, along with the Instagram feed and Instagram Reels, more females use Instagram Stories, the Instagram Explore tab, and the Instagram Shop. In the case of the Instagram Shop, the difference is notable – 58.0% females vs. 42.0% males.
4. Instagram Stories Watched by 500 Million People Every Day
In 2019, Instagram reported that Stories were being watched by 500 million users daily, up from 400 million in 2018. That pre-dates Covid, so current numbers are probably considerably higher now.
5. It Took 8 Months For Instagram Stories to Reach 500 Million People Per Day
Instagram Stories reached the 500 million people per day milestone just eight months from launch. In comparison, Snapchat took six years to get 150 million daily users.
6. Instagram Ad Reach is 18.3% of the Total Population
Instagram's potential ad reach of 1.45 billion people is 18.3% of the World's population and 29.0% of total internet users. If you ignore children, Instagram's ad reach is 23.4% of all people aged 13 or older.
7. Instagram's Ad Reach Peaked in January 2022
The removal of Russian users from Meta's official figures means that Instagram has recently had its first decrease in advertising reach. It passed the 1 billion figure in July 2020, gradually increasing to 1.48 billion people in January 2022, before falling back to 1.45 billion in April 2022.
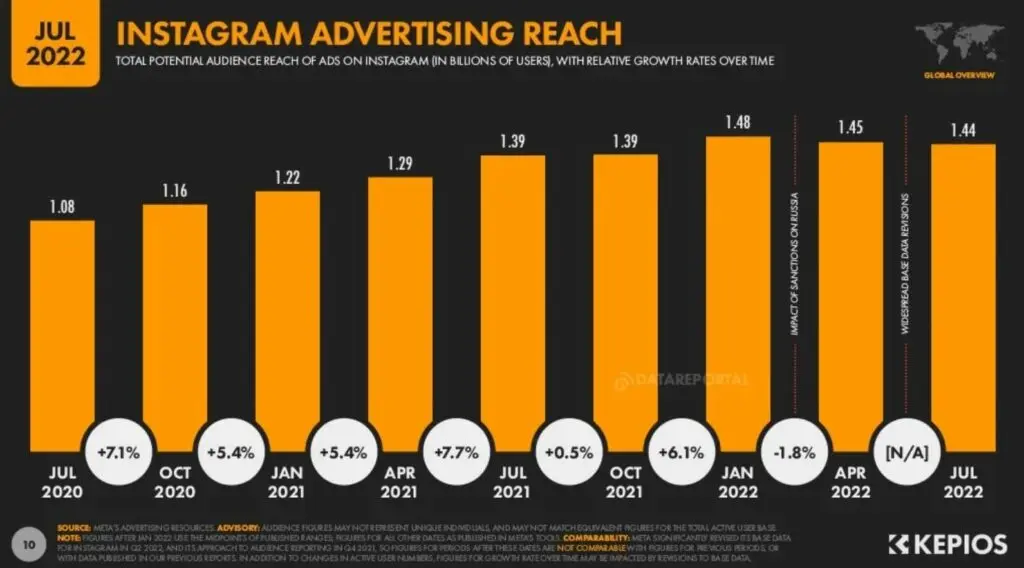
Source: Datareportal.com
8. Potentially 2 Billion Active Monthly Users
Since Instagram reached 1 billion users in 2018, Facebook/Meta have been reluctant to release precise user numbers. The company doesn't separate Instagram numbers in its annual report. As a result, many conflicting reports regarding the number of Instagram users exist. CNBC reported in December 2021 that Instagram has surpassed 2 billion monthly users worldwide, according to "employees with knowledge of the key metric." One person told CNBC that Instagram reached the figure about a week before Facebook changed its name to Meta in October 2021.
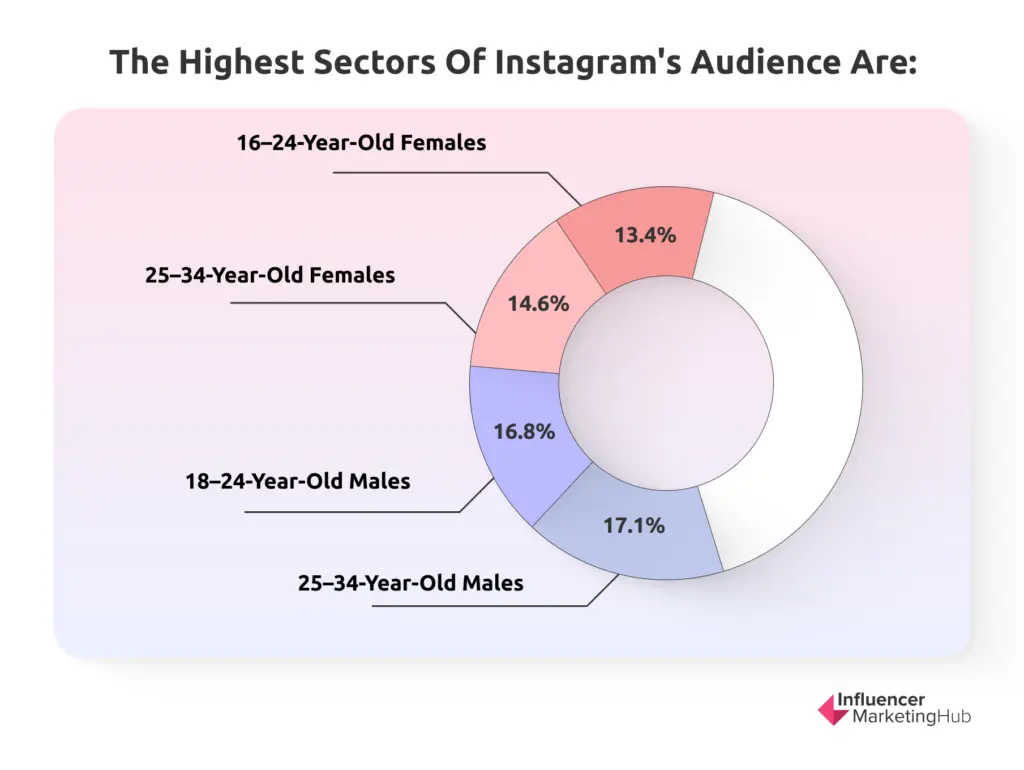
9. Majority of Instagram Users Aged 18-34
It's probably no surprise that Instagram's largest use is by people aged 18-34. Kepios's analysis shows the highest sectors of Instagram's audience are:
10. Instagram Third Most Popular Social Network for U.S. Teens
Piper Sandler's 43rd Semi-annual Generation Z Survey of U.S. teens found that TikTok is the favorite social media platform (33% share) of U.S. teens, surpassing Snapchat for the first time (31%) in Spring 2022. Instagram was third (22%) as it has been since TikTok's recent rise in popularity.

11. Reach of More Than 250 Million in India
Allowing for the fact that Instagram, like Facebook, is banned in China, it should be no surprise that India has the highest Instagram ad reach, 253,450,000. However, this is 23.1% of the nation's population aged 13+ - relatively low compared to many other countries.
12. Reach of More Than 155 Million in the USA
As you would expect, Instagram has a high reach in its home nation, the USA – 155,700,000, second only to India. This is 55.1% of the nation's population aged 13+.
The only other country with a total reach of more than 100 million as of April 2022 is Brazil (122,450,000), although Indonesia is exceptionally close to reaching that milestone (99,900,000).
13. Reach of More Than 85% in Brunei
Advertisers in Brunei know they can reach 85.7% of the population aged 13+ on Instagram.
Other nations with a high percentage reach for Instagram include:
- Kazakhstan (81.4%)
- Turkey (79.7%)
- Cyprus (77.3%)
- Cayman Islands (76.5%)
14. 16% Growth Worldwide 2019-2021.
Instagram saw a 16% growth in monthly users from 2019 to 2021. However, this is only the sixth highest growth rate from selected social platforms reported by Statista. For example, TikTok saw 38% growth in that period, Pinterest 32%, Reddit 30%, Facebook 19%, and Snapchat 17%.
The coronavirus pandemic increased interest in social networking, with billions of people in lockdown, working and studying from home, and in need of socializing.
15. 1.25% Growth in Business Account Followers
The average monthly growth in account followers of Instagram business accounts was 1.25% between December 2021 and February 2022.
16. Businesses Average 1.64 Main Feed Posts Per Day
Locowise figures in the latest Kepios Business Report show that the average business makes 1.64 posts per day.
17. More Than 76% of Instagram Accounts Have 1,000 to 10,000 Followers
Statista found that over 76% of Instagram accounts globally have 1,000-10,000 followers (up from 38% in 2021). Interestingly the 34.7% who have 100-1,000 followers represents a significant decrease from 2021, when 52% of Instagram accounts were of that size. 80% of Instagram accounts had under 10k followers in 2022, down 10% from last year.
18. The Average Engagement Rate for Business Posts is 0.68%
Over all types of Instagram posts, the average engagement rate for business accounts is 0.68%. Carousel posts perform best, with 0.85% engagement. On the other hand, photo posts perform near the average at 0.70%. Surprisingly, considering the popularity of video nowadays, the average Instagram rate for video posts is only 0.47%.
19. The Average Engagement Rate Overall is 5.86%
If we look at posts made by all types of Instagram accounts, the average engagement rate in 2022 is somewhat higher, according to HubSpot’s data – 5.86%. This is more than double 2021's 2.26%.
However, that figure is heavily skewed by the mega accounts with thousands to millions of followers.
20. Smaller Accounts Have Better Engagement Than Larger Accounts
This statistic has remained consistent for some time. As much as you wish to increase your reach so that more people can view your posts, your later followers are unlikely to be as interested in your posts as your earlier followers.
The average Instagram engagement rate for business accounts with fewer than 10,000 followers is 1.27%. For accounts with between 10,000 and 100,000 followers, the rate falls to 0.81%. And the engagement rate for business accounts with more than 100,000 followers is an even smaller 0.58%.
We have previously written about why Instagram engagement metrics are important and include a free bulk engagement calculator.
21. Engagement in North America and the U.K. Lower Than Global Average
HubSpot’s data about engagement may surprise some people. For example, they found less engagement in Instagram's two largest English-speaking user bases than in much of the World.
They found the most-followed accounts globally are becoming more diverse, with India, Brazil, and Korea especially well-represented.
Although most of the top-followed accounts are still North America-based, HubSpot ponders whether a higher proportion of these followers are old, inactive accounts that no longer engage with their content.
22. 2 in 3 People Say Instagram Enables Interaction with Brands
Instagram reports data from "Project Instagram" by Ipsos, which surveyed 21,000 people, showing that two in three people surveyed believed that Instagram enables interaction with brands.
23. 50% More Interested When Seeing Ads for a Brand on Instagram
Project Instagram also found that 50% of their survey respondents said they are more interested in a brand when they see ads for it on Instagram.
24. More Than One-Third of Instagram Users Use the Platform to Follow Brands
AudienceProject conducted an insight study into app and social media usage in 2020. 36% of U.S. and U.K. respondents to that AudienceProject Insights Report 2020 said they used Instagram to follow brands. This was higher than any other social network, although closely followed by Twitter. An even higher percentage of Denmark respondents (40%) use Instagram to follow brands.
Notably, although WhatsApp is particularly popular in the U.K., only 1% claim to use it to follow brands.
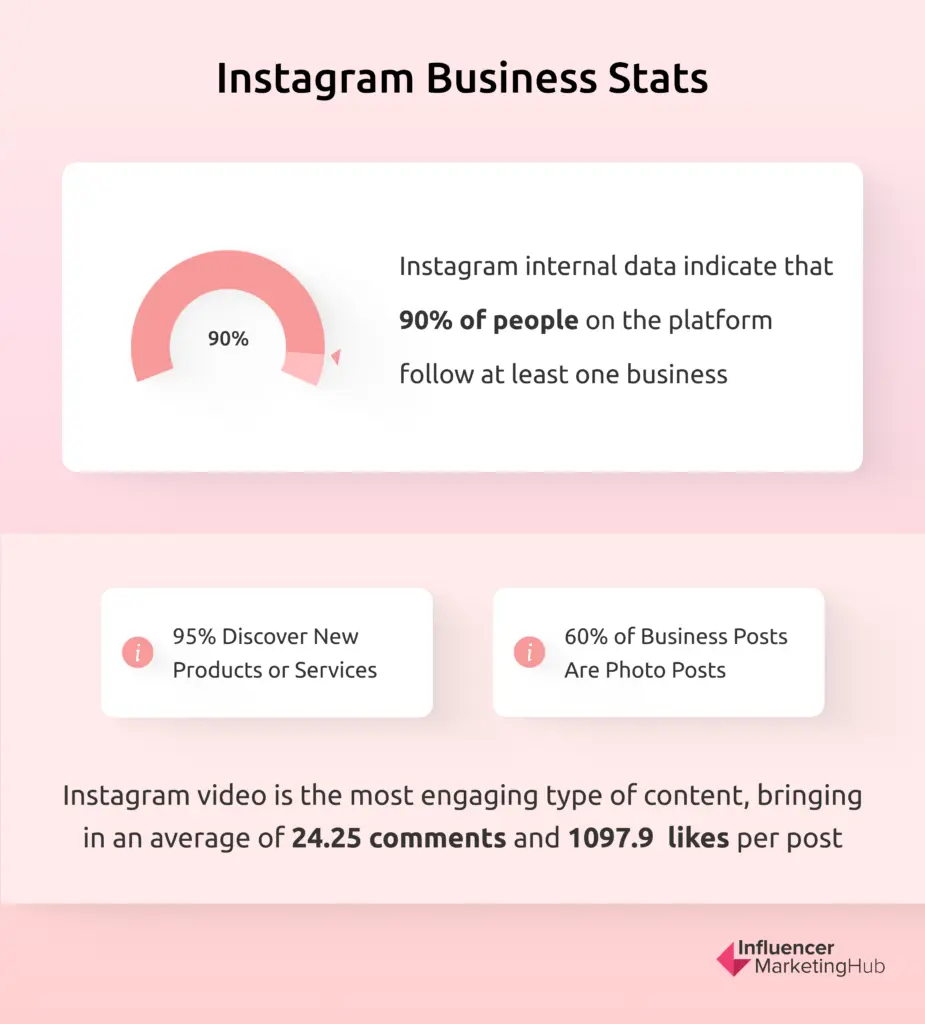
25. 90% of Instagrammers Follow Brands
Notably, despite only just over one-third of people claiming to use Instagram to follow brands, Instagram internal data indicate that 90% of people on the platform follow at least one business.
26. 84% of Instagrammers Visit a Brand's Website or App
According to Instagram data, 84% of those who see Instagram ads visit the advertising brand's website or app, and 71% purchase while there.
27. 95% Discover New Products or Services
Instagram claims that 95% research products and services, and 95% also discover new products or services.
28. 2 in 3 People Come to Instagram to Interact With Creators
Instagram data also indicates how interactive Instagram can be. Their surveys have revealed that approximately 2/3 of users say they come to Instagram to interact with creators.
29. 4 in 5 People Believe Brands They See on Instagram Are Authentic
Instagram storytelling appears to be successful in building trust for brands. Instagram claims that 4/5 of Instagram users recognize brands as being effective.
30. 15% of U.S. Instagram Users Use the App to Get News
Although nowhere as news focused as Twitter or Reddit (which 50% of both apps' users claim to follow for news), a noticeable 15% of U.S. Instagrammers still say they use the app to get news. This is higher than LinkedIn, Pinterest, TikTok, Snapchat, Tumblr, and WhatsApp.
31. Nearly 60% of Business Posts Are Photo Posts
When you look at the types of main feed posts that businesses make on Instagram, you can see that the majority are still photo posts:
- Photo posts (58.6%)
- Video posts (21.5%)
- Carousel posts (19.9%)
Notably, carousel posts only made up 3% of all posts in 2017, so they are increasing significantly in popularity.
32. Video Brings in More Than 1000 Likes Per Post on Average
While businesses make fewer video posts than photo posts, HubSpot’s 2022 report found video to be the most engaging type of content, bringing in an average of 24.25 comments and 1097.9 likes per post. Carousel posts come in a close second, with 23.2 average comments and 933.7 likes.
33. Carousel Posts Have Better Median Engagement
Using median figures to eliminate posts made by outlier accounts (very small or huge accounts), carousel posts have a median of 70 comments compared to video's 46 and 4 median comments, nearly doubling video posts' performance.
By both average and median calculations, image posts trail far behind.
34. Carousel Posts Bring in By Far the Most Likes and Comments in North America and the U.K.
Video trails far behind in North America and the U.K., barely above still images. This may be because carousels can now contain video as well as pictures.
35. 10.7 Average Hashtags Per Post
HubSpot’s 2020 Instagram Engagement Report showed that the average Instagram post contains 10.7 hashtags, but 50% of Instagram posts include fewer than six hashtags.
HubSpot didn't repeat this statistic in their 2022 report, but they did show the average engagement rate vs. the number of hashtags. This indicated that the best engagement comes with posts with 11 or more hashtags, followed by posts with no hashtags. So clearly, using more hashtags doesn't seem to harm performance on Instagram nowadays.
However, in North America, posts with zero hashtags slightly outperformed those with 11+ hashtags.
36. Instagram Launched in October 2010
Instagram launched on October 6, 2010. By December 1 million people had created an account on the nascent platform. It reached 10 million users in September 2011.
37. $1 Billion Acquisition by Facebook
Perhaps the most significant change in Instagram's history occurred in April 2012 when Facebook purchased them. The purchase price was approximately $1 billion.
By February 2014, 100 million people were using Instagram each month, trebling to 300 million by that December.
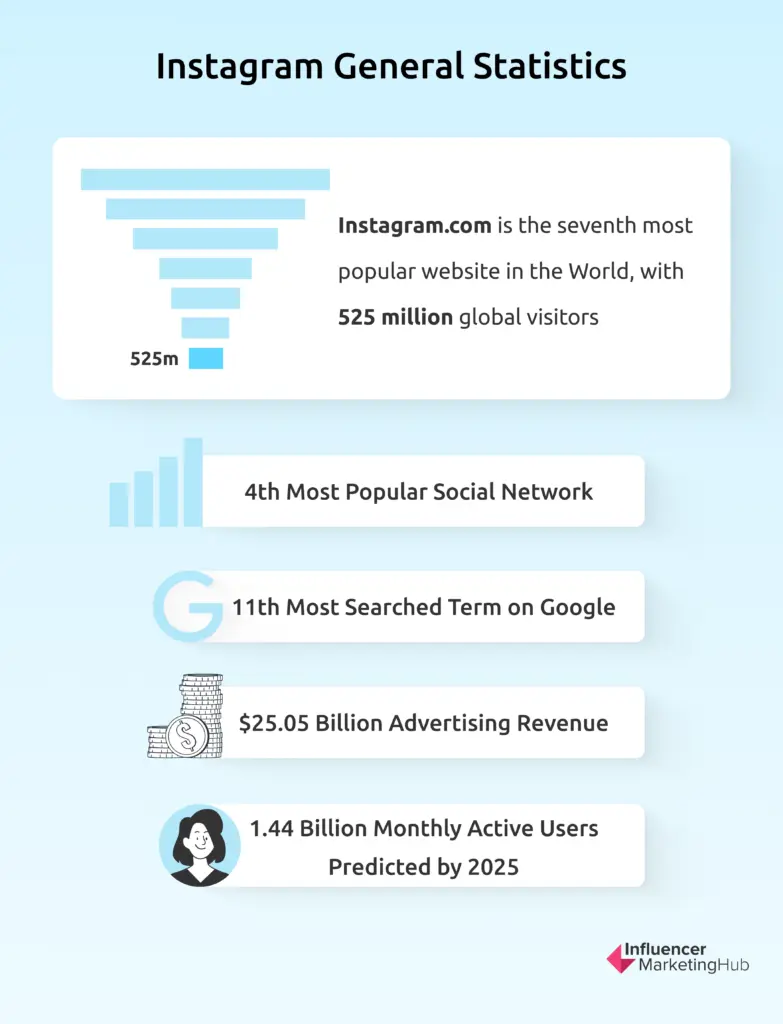
38. 1.44 Billion Monthly Active Users Predicted by 2025
eMarketer predicts continued growth in user numbers, although at a slower rate, over the next few years. They indicate that Instagram will have 1.44 billion monthly active users by 2025, 31.2% of global internet users.
Remember the previously mentioned data showing that the potential reach of ads on Instagram as of April 2022 was 1.45 billion people. Although comparing data from different sources is tricky, this may indicate that we have already met eMarketer's predictions a few years early.
eMarketer is clearly disregarding the two billion monthly active users rumor reported by CNBC.
39. 7th Most Visited Website in the World
Instagram.com is now the seventh most popular website in the World, with 525 million global visitors (96 million from the U.S.). In addition, it is the 12th most visited site by U.S. residents.
The sites that Instagram has yet to beat are YouTube (8.564 billion global visitors), Facebook (3.483 billion), Wikipedia (2.223 billion), Twitter (2.008 billion), Amazon.com (616 million), and Google Play - the Android app store (595 million).
40. 4th Most Popular Social Network
Based on January 2022 data, as reported by Statista, Instagram is currently the fourth most popular social network after Facebook, YouTube, and WhatsApp. Of course, Facebook, WhatsApp, and Instagram are all Meta-owned, as is Facebook Messenger, currently the seventh most popular social network. In the third quarter of 2021, Facebook reported over 3.58 billion monthly core Family Product users.
41. Average of 53 Minutes Per Day
The average user spends 53 minutes per day on Instagram. This is slightly less than the 58 minutes people average on Facebook and considerably more than the one minute per day people spend on Twitter.
42. 11th Most Searched Term on Google
Siege Media used Ahrefs to discover the most popular search terms in November 2021 (excluding porn-related keywords). "YouTube" topped this list, followed by "Facebook." "Instagram" came in 11th place, with more than 230 million searches.
43. $25.05 Billion Advertising Revenue
Of the social networks, Facebook generates the most significant amount of ad revenue, reaching an estimated $48.48 billion in 2021. However, Instagram made an estimated $25.05 billion ad revenue that same year.
Meta has streamlined their social advertising, allowing advertisers to create ads and bid for advertising slots on both Facebook and Instagram in one place.
44. Americans Consider Instagram Their 2nd-Most Important App
We have previously looked at the AudienceProject Insight Report about app and social media usage in 2020. At that stage, they found that Instagram had become the best platform for brand advocacy, while TikTok was still some way behind. Unfortunately, they haven't updated this report so far, so it will be interesting to see whether things change next time around.
They asked their U.S. survey respondents which apps they could least do without on their mobile. Facebook topped this with 17%, noticeably down on 2017's 26% and 2018 and 2019's 21%. Instagram reached second place in 2018, remaining there in 2019 and 2020. In 2020, 13% of American respondents felt they couldn't do without Instagram.
45. Instagram Was the Most Important App for 15–35-Year-Old Americans
Those aged 15-25 (27%) and 26-35 (19%) rated Instagram more important than Facebook. Indeed, the younger group felt they would miss Instagram, YouTube, Snapchat, and Twitter ahead of Facebook.
46. Despite More Men Using Instagram, More Women Say They Would Miss the App
We have previously seen that there are more male Instagram users than female Instagrammers. However, AudienceProject found that only 10% of men felt that Instagram was the app they could least do without, after Facebook and YouTube. In comparison, 16% of women felt the same way about Instagram, only beaten by the 18% favoring Facebook.
47. Brits Would be More Concerned About Losing WhatsApp and Facebook Than Instagram
It's hardly a problem for Meta, but Brits would be more concerned about losing WhatsApp (24%) than either Facebook (15%) or Instagram (10%). Indeed, to give Meta a monopoly on the top positions, Facebook Messenger came in fourth place in the U.K. (6%). This exceeds all other apps, including Gmail, Spotify, Google, and Google Maps.
48. Instagram Was the Most Important App for 15–35-Year-Old Britons and Americans
WhatsApp ruled all demographics for the app Britons could least do without, except for 15-25-year-olds, who, like their American counterparts, listed Instagram (27%) ahead of WhatsApp (29%).
49. WhatsApp is Even More Dominant in Germany, But Instagram is Still the Third-Most Important App
The order of apps people consider they can least do without is very similar in Germany to the U.K. However, those who would most miss WhatsApp are a massive 60%. In comparison, Facebook is 15% and Instagram 12%.
50. 63% of American Instagram Users Use the App Daily
The Audience Project survey found that 63% of U.S. Instagram users used the app daily, 90% weekly, and 97% monthly. The daily usage figures were only exceeded by Facebook, although YouTube users use their app more often weekly (92%) and monthly (98%).
51. Instagram was the Only Social Media In Denmark to increase its Share of Users in 2020
The Audience Project Insights 2020 report found that social media use was static or fell for all major social networks other than Instagram in 2020 (this was the first year they included TikTok in their survey). At that stage, 43% of Danes used Instagram, up from 40% in 2018 and 2019.
52. Twice as Many Women as Men use Instagram in Denmark
The AudienceProject Insights 2020 report found that 29% of men used Instagram in Denmark, compared to 56% of women.
The more recent Kepios analysis of Meta data shows that the difference between male and female usage has narrowed over the last two years. However, the gender balance in Denmark is very different from Instagram's global audience. In April 2022, Kepios found 57.4% Female Instagram ad reach in Denmark, compared to 42.6% male.
53. Three-Quarters of Swedish Women Use Instagram
Swedish women have taken to social media. In 2020, 75% of Swedish women used Instagram compared to 50% of men. In addition, a massive 85% of Swedish women used Facebook, alongside 75% of men.
54. More Than 1 in 5 U.S. Instagram Users Have Considered Stopping Using Instagram
22% of U.S. Instagram users have considered stopping using the app. Slightly more U.K. users (24%) have had similar thoughts.
People are less likely to consider leaving Instagram than Facebook, however. For example, 43% of U.S. and 43% of U.K. users have considered stopping using that platform.
Notably, considerably fewer YouTube users consider walking away, with only 7% of U.S. and 6% of U.K. users considering leaving.
55. The Most Popular Instagram Post is a Photo of an Egg
Surprisingly, the most popular post on Instagram is a photo of an egg by the account @world_record_egg. The account deliberately set about trying to set a world record in 2019, only posting one picture, hoping to beat the previous record holder (Kylie Jenner). As of May 2022, the post had 55.9 million likes.
56. Ronaldo Has the Most Popular Instagram Account – Apart From Instagram Itself
As of July 2022, the Instagram account with the most followers is Instagram's own account which has 530 million followers. However, putting that aside, the most popular Instagram account has for some time been that of Portuguese footballer Cristiano Ronaldo, @cristiano, with 466 million followers.
57. Ronaldo Gained Over 163 Million Followers in 2021
2021 was a good year for Cristiano's Instagram account. His account grew rapidly, by more than 163 million followers, following his return to Manchester United.
58. 41 Celebrities in Global Top 50
The global top 50 Instagram accounts consist of 41 celebrities and only nine brands, including Instagram itself. The top brands focus on sports, travel, space, and nature. North America's Top 50 are celebrity and luxury-centric, while the U.K. favors media outlets and football.
59. The Kardashians Dominate the North American Top 50 Accounts
As with the global statistics, Instagram's account has the most followers in North America. However, Kylie Jenner takes the second position. However, her sisters are also highly popular, with Kim Kardashian taking sixth place, Kendall Jenner in seventh place, and Khloe Kardashian eighth.
60. Average Media Value of a Top Post Almost $1 Million
Statista reports that the average media value of an Instagram post by Cristiano Ronaldo in January 2020 was over $US985,000.
61. The Value of Each of Ronaldo's Posts Has Risen to £1.72 Million
Due to Ronaldo's increased following, the value of each post has allegedly risen to £1,720,000, with his uploads averaging 10 million likes every time his profile gets a new piece of content. This is almost equivalent to a month's salary at Manchester United, with the Portuguese star earning £480,000 weekly at Old Trafford.
62. The Leading Category of Instagram influencers is Lifestyle
According to Statista, the leading content category of Instagram influencers in the United States in 2021 was lifestyle, with 15.25% of influencers producing content focusing on it. Music followed with 10.96% of influencers concentrating on it, while Family had 8.24%.
63. Top 50 Instagram Accounts Come From 12 Nations
HubSpot's 2022 report shows the locations of the top 50 Instagram accounts. They are spread globally, with top influencers coming from the USA, Canada, Colombia, Argentina, UK, Spain, Portugal, Senegal, Israel, India, and Thailand.
64. Over Half the Top 50 Accounts Have 100M+ Followers
Over half the Top 50 accounts boast over 100 million followers, and they all have at least 60 million.
65. Accounts With Over 1 Million Followers Make Up 1.5% of All Instagram Accounts
HubSpot surveyed 110 million posts across 1 million users for their report. They found accounts with over 1 million users made up just 1.5% of the accounts surveyed. Yet that was a 10X increase from 2021's report, where those with over 1 million followers made up just 0.15% of Instagram accounts.
66. Leo Messi is the Second Most Popular "Sport With a Ball" Influencer After Cristiano Ronaldo
HypeAuditor provides rankings for the Top 1000 Instagram Influencers by the number of quality and engaged followers. They also rank various categories, including "Sports With a Ball." The top five Instagrammers in this category are:
- Cristiano Ronaldo (462.9 million followers, 5.5 million authentic engagement)
- Leo Messi (348.6 million followers, 3.6 million authentic engagement)
- Virat Kohli (207.5 million followers, 2.2 million authentic engagement)
- Neymar Jr (176.2 million followers, 1.3 million authentic engagement)
- Khaby Lame (78.7 million followers, 2.7 million authentic engagement)
It is perhaps unusual that HypeAuditor categorizes Khaby Lame as a "Sports With a Ball" influencer, although in August 2021, Lame appeared as a co-star for Juventus F.C.'s announcement of Manuel Locatelli.
67. Selena Gomez Most Popular Lifestyle Influencer
The top five top Lifestyle Instagram influencers, according to the HypeAuditor rankings, are:
- Selena Gomez (335.8 million followers, 1.5 million authentic engagement)
- SUGA of BTS (36.6 million followers, 10.4 million authentic engagement)
- Khloé Kardashian (261.5 million followers, 955.7 thousand authentic engagement)
- RM (176.2 million followers, 5.5 million authentic engagement)
- Kourtney Kardashian (189 million followers, 739.8 thousand authentic engagement)
In this category, it is very notable how some Instagrammers with comparatively low follower counts have incredibly high levels of engagement.
68. Narendra Modi Most Popular Business Influencer
The top five top Business and Careers Instagram influencers, according to the HypeAuditor rankings, are:
- Narendra Modi (68.2 million followers, 1.2 million authentic engagement)
- Michelle Obama (50.3 million followers, 159.8 thousand authentic engagement)
- Hakki Akdeniz (23.9 million followers, 262.2 thousand authentic engagement)
- Adam Weitsman (17.5 million followers, 337.4 thousand authentic engagement)
- Jair M Bolsonaro (20.2 million followers, 269.6 thousand authentic engagement)
The Business and Careers category emphasizes the international nature of Instagram. Modi's largest audience is in India, Obama's in the USA, Akdeniz's in Russia, Weitsman's in Russia, and Bolsonaro's in Brazil.
69. National Geographic is the Most Followed Brand on Instagram (Apart From Instagram)
As we have seen, Instagram itself has the most followed Instagram account. National Geographic is the leading "outside" brand on Instagram globally, closely followed by Nike. Also making the Top 10 are Real Madrid, FC Barcelona, NASA, Victoria's Secret, NBA, 9GAG, and Marvel.
70. Consumer Brands More Popular in North America
Although Instagram and National Geographic are still the most followed brands in North America, there is less of a sporting bias there, with only NBA making the Top 10. Marvel and 9GAG also remain popular in North America and are joined by Huda Beauty, Chanel, Louis Vuitton, and Gucci.
71. The Home and Automobile Sector Has By Far the Most Followers of Any Business Category Globally
HubSpot's Instagram Engagement Report 2022 looked at the comparative popularity of business accounts by sector. Apart from Home and Automobiles, no sector averages more than 50,000 followers (Content and Apps was the sector with the second-highest average following, followed by Publishers). However, Home and Automobiles dwarfed everyone else, with an average of nearly 120,000 followers.
These stats were affected by a few popular luxury brands, like Bugatti (15.2 million followers) and Rolls Royce (7.2 million followers).
72. Publishers are the Most Followed Business Sector in North America
North America has less interest in accounts in the Home and Automobiles sector than elsewhere in the World. Here the most followed sector is Publishers, followed by Content & Apps, Geography, and Non-Profits & Religious Organizations.
73. Publishers are the Most Followed Category in the U.K. by a Long Way
Across the Atlantic in the U.K., the most followed business category is Publishers, averaging about 75,000 UK followers. No other category comes close, with second place going to Transportation & Accommodation Services (almost 22,000 followers).
74. By Median, Geography is the Most-Followed Category Globally
If you use median figures rather than averages, Geography becomes the most followed business category on Instagram, followed by Home and Automobiles, then Government Agencies.
Although using median figures takes out the effect of outliers (and Geography has several accounts in the Top 50, like National Geographic and NASA), overall, accounts relating to earth, travel, and nature content perform well on a highly visual medium like Instagram.
75. Nearly Half of Young People Interested in New Shopping Experiences Keep up With Their Shopping Experience on Instagram
In December 2021, Instagram released the first edition of its Instagram Trend Report. It showed that 27% of teens and young adults expect to shop directly through social media feeds and special in-app features. In addition, nearly half of the young people interested in new shopping experiences keep up with their shopping interests on Instagram.
76. Young Instagram Users More Likely to be Excited by Visual Experiences in 2022
According to the 2022 Instagram Trends Report, 24% of Instagram users are more likely to be excited about visual experiences in 2022.
77. At-Home Workouts More Popular Amongst Instagram Users
According to the Instagram Trend Report, at-home workouts are significantly more popular among Instagram users (48%) than non-Instagram users (34%). But, of course, finances also have a significant impact on this. At-home workouts were much more popular with respondents who are better off financially (54%) compared to those who are about average (35%) or worse off (32%) financially.
78. Instagram Users Are Significantly More Likely to Vote Than Non-Users
Presumably, this statistic from the 2022 Instagram Trends Report restricts itself to young people, as that is the report's focus. The report found that Instagram users are significantly more likely to vote in local/state/national elections (18%) than non-users (6%).
79. Nearly Half of Survey Respondents Believe That Culture Happens on Instagram
Compared to other platforms, people cite Instagram as one of the top places to keep up with trends. Indeed, 47% of people surveyed in a Facebook-commissioned online study strongly associate Instagram with a place where culture happens.
80. 69% of Instagrammers are More Likely to Purchase From Inclusive Brands
The Instagram Trends research study found that 69% of active Instagram users surveyed say they are more likely to purchase from brands inclusive of all people and identities. In addition, 66% say they are more likely to buy from brands that support a social movement they care about or that reflect their personal values and what they believe in.
81. Nearly 60% Believe Brands Should Post Light-Hearted Content
Brands should think carefully before they make yet another serious Photoshop-modified marketing post. The Instagram Trends research study found that 59% of active Instagram users surveyed agree it's important for brands to post light-hearted or humorous content. In addition, 58% of respondents agree it's important for brands to post real, raw, unpolished content.
82. 1/3 Of Most Viewed Instagram Stories Are from Businesses
According to EmbedSocial, one-third of the most viewed Instagram Stories are from businesses, and 50% of businesses on Instagram worldwide created at least one Story during a typical month.
83. About 70% of Instagram Stories are Viewed with the Sound On
Most users keep the sound turned on when they view Instagram Stories. According to Mediakix, about 70% of Instagrammers listen to the sound when watching Instagram Stories.
84. 30% of Instagram Stories in 2020 Were Just One Frame
As its name indicates, Instagram Stories typically consist of a series of frames telling a story of some activity. However, EarthWeb reports that in 2020 30% of Instagram Stories merely consisted of one frame. 20% of Stories had seven frames, and 10% or less had more than 12 frames. Therefore, you must grab your audience with your first frame, so they remain for the rest of your Story.
85. The Tap Forward Rate in 2020 Was 68%
EarthWeb also found that 68% of people tapped through to the next frame when watching Instagram Stories.
86. Instagram Stories with Sports Have a 90% Finish Rate
Instagram Stories viewers clearly take an interest in sports. Once they start viewing a sports-related Instagram Story, 90% of Instagrammers continue to the end of the Story to see how it ends.
87. Marketers in America Allocated 31% of Their Instagram Marketing Budget for Instagram Stories
EarthWeb reports that marketers see the value of incorporating Instagram Stories in their marketing, with American marketers devoting 31% of their total Instagram marketing budgets to Instagram Stories.
88. The Arrival Of Instagram Reels Increased Brazilian Instagram Users by 4.34%
Instagram debuted 15-second Instagram Reels in August 2020 as an answer to TikTok. They tested this feature in Brazil, which resulted in an increase of 4.34% of Instagram users in that nation.
89. Instagram Reels Available in More Than 50 Countries
Instagram may have trialed Instagram Reels in Brazil, but the social network launched it in more than 50 countries.
90. Instagram Reels' Screen is 8% Larger Than TikTok
EarthWeb reports that Instagram purposely gave Instagram Reels ample screen space, compared to other types of Instagram posts and arch-competitor TikTok, to gain a competitive edge.
Having seen this success, however, in June 2022, Instagram launched an updated version of its full-screen main feed test, which expands Instagram posts of all types into a full-height swipeable flow like TikTok.
91. People Now Spend 20%+ of Their Instagram Time on Reels
Meta announced during its Q1 2022 earnings call that Reels now makes up more than 20% of the time that people spend on Instagram.
92. Khaby Lane has the Most Viewed Reel - 289 million views
Khaby Lane has taken the world of short-form video by a storm with his droll takedowns of so-called life hacks and takes on everyday niggles. This video about an electric iron holds the record for Instagram Reels views, currently at 289 million.
93. 20 of the NBA's 30 Franchises Posted at Least One Reel in the Week After Reels' Launch
SportsPro reported that 20 of the NBA league's 30 franchises posted at least one Reel the week after Instagram launched the short-form content. The engagement per Reel for those teams that used the format was 22 percent higher than the franchise's average engagement per Instagram video during the same period.
94. Instagram Light Operates in 170 Countries
One effect of Covid was that more people began working in remote places – often their homes away from central cities. So, Meta developed Instagram Light, a new app for Android designed to provide people living in rural and remote communities a high-quality Instagram experience using minimal data. They rolled out the app in more than 170 countries. It requires only 2 MB to download on Android, considerably less than the full-size version, which is closer to 30 MB.
95. 95 million Instagram Users Could be Fake Bots
All social networks suffer from fake profiles. But, as Basic Thinking observes, Facebook, Twitter and Co. discover a gap, fix it, and delete millions of fake profiles, only to deal with a new vulnerability a few days later. Ghost Data surveyed Instagram, finding an estimated 95 million bots and fake accounts. This is actually a smaller percentage (9.5%) than many other social networks. However, estimates suggest the cost of ad fraud at Instagram is approximately $500 million.
96. Instagram Has 450 Employees
According to Backlink, Instagram has 450 employees servicing over 1 billion users, compared to its parent company, Facebook, which has 58,000 employees for its 2.9 billion user base. When Facebook bought Instagram in 2012, the young company had just 12 employees.
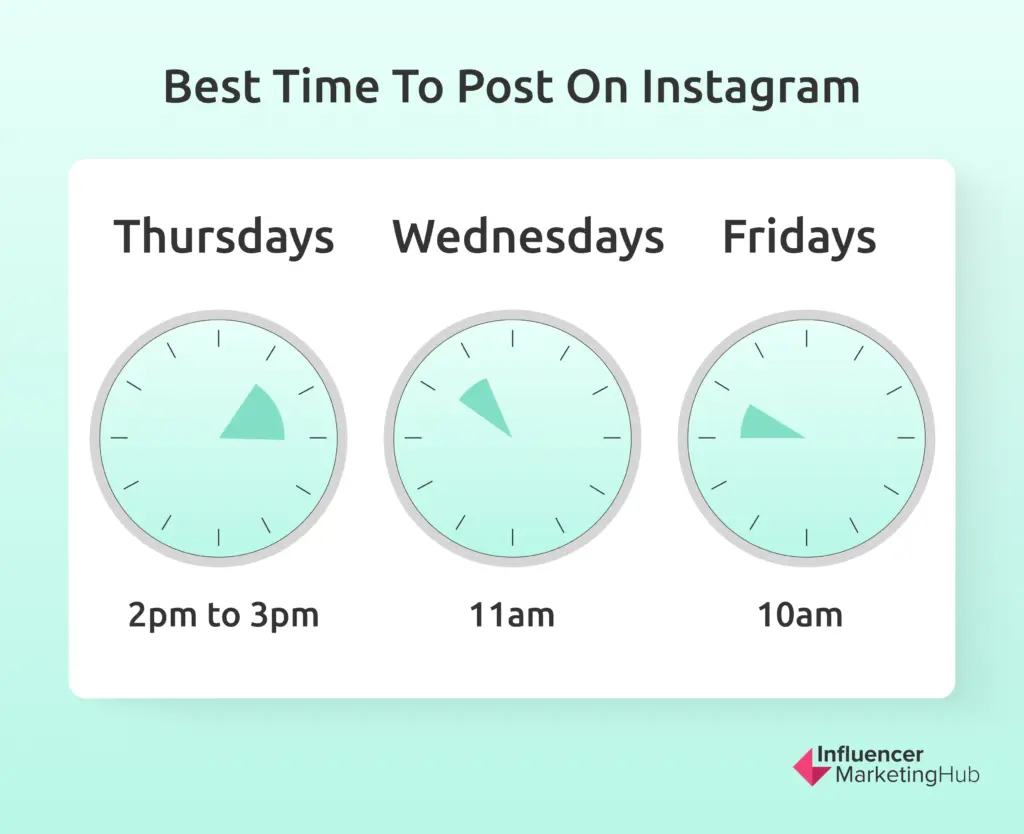
97. The Best Day to Post on Instagram is Thursday (or Sunday).
In When is the Best Time to Post on Instagram, we found that the best day to post on Instagram is Thursday, particularly between 2 pm and 3 pm. Other times worth considering include 11 am on Wednesdays and 10 am on Fridays.
HubSpot disagrees, however. Their data indicates that Sunday is the best day to post, with an average engagement rate of 6.47%. Saturday and Monday are close behind, with 6.05% and 5.95%, respectively.
98. Content Posted Between 6 pm and 9 pm Gets the Highest Engagement Rate
HubSpot data also differ concerning the best time of day to post on Instagram. They found that content posted between 6 pm and 9 pm got the highest engagement rate, but in general, evenings are a pretty safe bet, as engagement remains on the high side until midnight.
99. Best Instagram Engagement Comes With Very Short Captions … or Very Long Captions
HubSpot's Engagement Report looked at the average engagement rate vs. caption length on Instagram. Ironically, the captions with the highest engagement (over 6%) have captions that are either <= 20 characters or >2,000 characters.
However, posts with captions between 20 and 2,000 characters still averaged engagement of over 5%. The notable exception comes with posts lacking captions at all. Posts without a caption have average engagement rates of less than 4%.
100. On Average, Tagging One Other Account Will Give You the Most Engagement.
HubSpot also found that tagging other accounts is good for engagement. Whether you mention another account in the caption or tag directly onto your post, you're increasing how many people see your content.
Although the average engagement figures suggest that tagging one account is the sweet spot, using median engagement figures (removing very large and very small accounts from the calculations) found that the more mentions, the better, with the best engagement coming from 11+ tags.
Frequently Asked Questions
How do I see my statistics on Instagram?
To see your statistics on Instagram, first go to your profile. Tap the Insights action button. You can also get here by going to the upper right corner and then tapping Insights. Under the overview section, tap Metrics. You can see your analytics for your specific content.
Where do people use Instagram the most?
Instagram has worldwide popularity. As of 2022, India has more than 230 million Instagram users. India has the largest Instagram audience in the world. The U.S. has 159 million users and Brazil has 119 million users. Indonesia, Russia and Turkey rank 4th, 5th and 6th in popularity.
What percentage of the world is on Instagram?
17.6% of the world population is on Instagram. Data shows that 73% of U.S. teens say brands can best reach them on Instagram about products and promotions. In 2021, Instagram users spent 30 minutes average on the app. Data shows 25% of teens say Instagram is their preferred social media platform.
What age group uses Instagram?
59% of Internet users between 18 to 29 use Instagram. 33% of Internet users aged 30 to 49 use Instagram. 90% of Instagram users are under 35 years old.