How do you know that your Instagram marketing efforts are paying off or which types of content resonate with your audience? You can’t just keep pushing out content hoping for the best; you also have to keep track of what’s working and what isn’t. That’s where Instagram analytics comes in, providing you with the data you need to understand the impact of your current marketing and content efforts.
Join the Planet’s largest community of Creators & Influencers Registration includes Already A Member? Sign In
Register for Free
![]()


Not sure what metrics to track or how to use Instagram analytics? Read on to learn how to access your analytics insights on Instagram and how you can leverage them to grow your Instagram account.
- What are Instagram Analytics?
- Why You Need Instagram Analytics
- Understanding Instagram Insights
- What Can You Track Using Instagram Insights?
- How to Access Your Instagram Insights
- Top Metrics to Track for Instagram Analytics
- Going Beyond Instagram Insights
- Analyze and Optimize for Instagram Success
- Frequently Asked Questions
What are Instagram Analytics?
Instagram analytics are a set of data and metrics related to your Instagram account and its performance. It includes metrics such as account growth, engagement rate, likes, impressions, and saves among many others. As such, your Instagram analytics help you keep track of how your posts are performing, how your account is growing, and what types of followers you have. They let you dig deeper into your follower demographics so you can understand who your audience is.
These insights give you an idea of how your existing marketing campaigns are performing. They even inform various aspects of your Instagram marketing strategy and empower you to boost your performance.
You can access your Instagram analytics through the native Instagram Insights dashboard. Alternatively, you can unlock more comprehensive insights by using a third-party Instagram analytics tool.
Why You Need Instagram Analytics
Now you may be wondering, “Why do I need Instagram analytics in the first place?” Why should you go through the extra trouble of tracking performance metrics on Instagram? There are a number of reasons why you should leverage Instagram analytics.
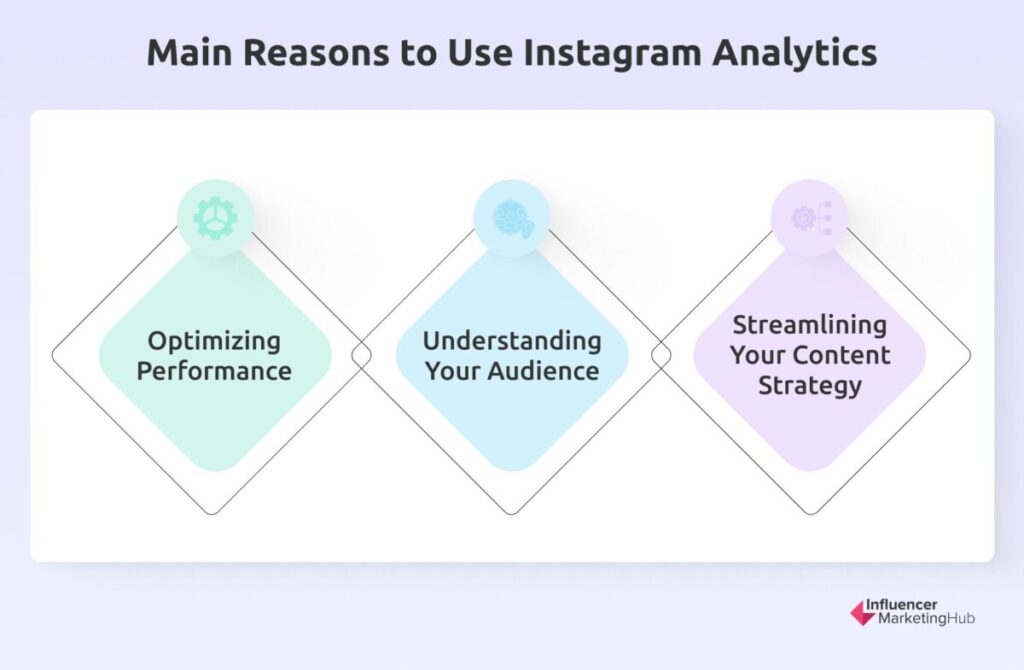
Optimizing Performance
Instagram analytics gives you valuable insights into your top-performing posts and when your audience is most active. This can reveal some excellent opportunities to improve your performance. For example, you may want to publish posts at times when your followers are most likely to engage.
Understanding Your Audience
The native Instagram analytics tool can also give you a breakdown of follower demographics so you can better understand your audience. This includes details like location, age range, and gender distribution. Leveraging this information will allow you to develop content and campaigns that will resonate with your audience.
Streamlining Your Content Strategy
Instagram analytics is particularly effective for understanding what types of content work best for your audience. So you can optimize your content strategy accordingly. This may involve developing more content similar to the ones that saw the most reach and engagement. Or you may want to add music to your Reels because your Reels tend to perform better when you include a trending song.
Understanding Instagram Insights
Instagram Insights is the built-in analytics dashboard where you can access basic analytics for your Instagram account. It shows you data related to your account growth, post performance, and followers. So you’ll be able to keep track of metrics such as accounts reached, accounts engaged, follower demographics, most active times, post-specific engagement data, and more.
You can use your Instagram Insights to get a clear idea of how your account has been performing over time and which content seems to do well for your brand. These insights can inform how to build a more successful Instagram marketing strategy.
For instance, the most active times can inform when to schedule your Instagram posts for the most engagement. Meanwhile, your Stories with the most interactions will show you what types of Stories will help you drive more engagement.
What Can You Track Using Instagram Insights?
The Instagram Insights dashboard gives you access to a wide range of metrics to track how your account and content have performed over time. The default time frame is for the last seven days but you can also change this to display metrics for the last 4 days, last 30 days, previous month, and last 90 days.
Your performance metrics are divided into three main sections. These are:
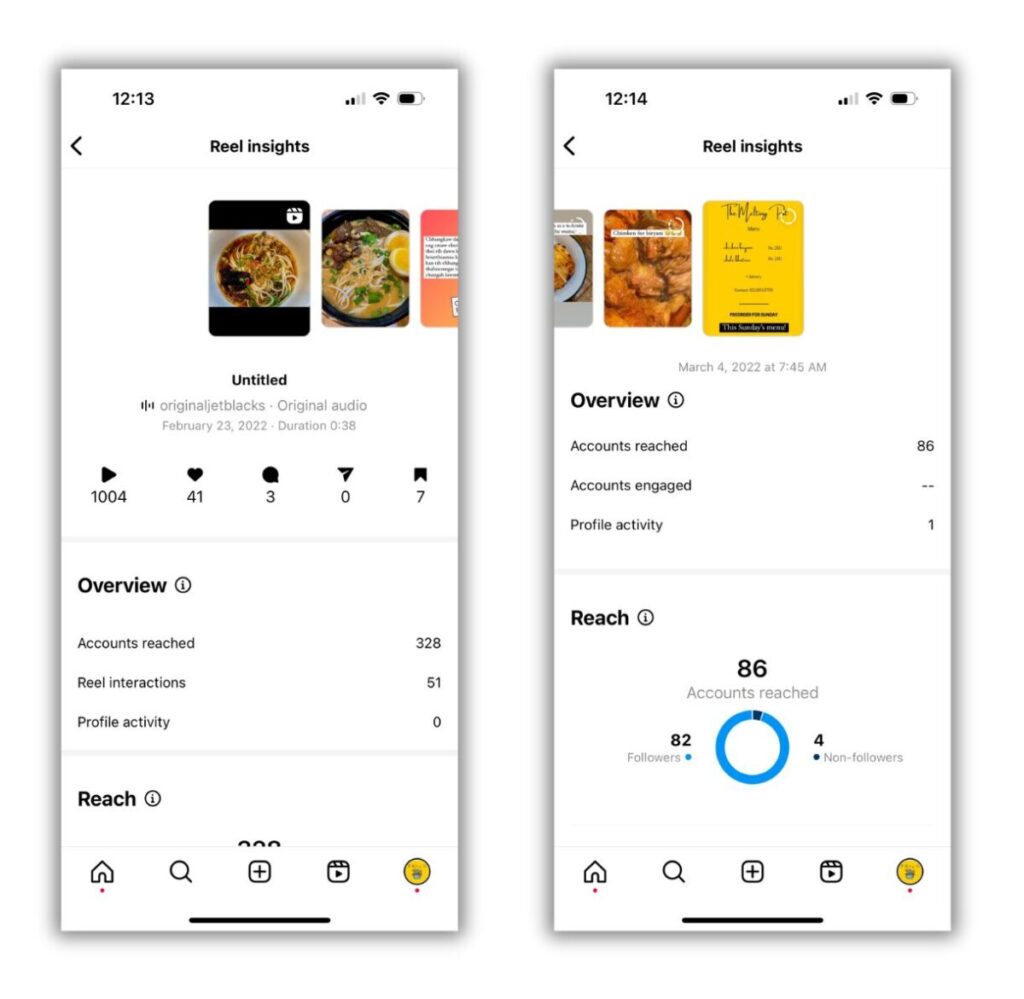
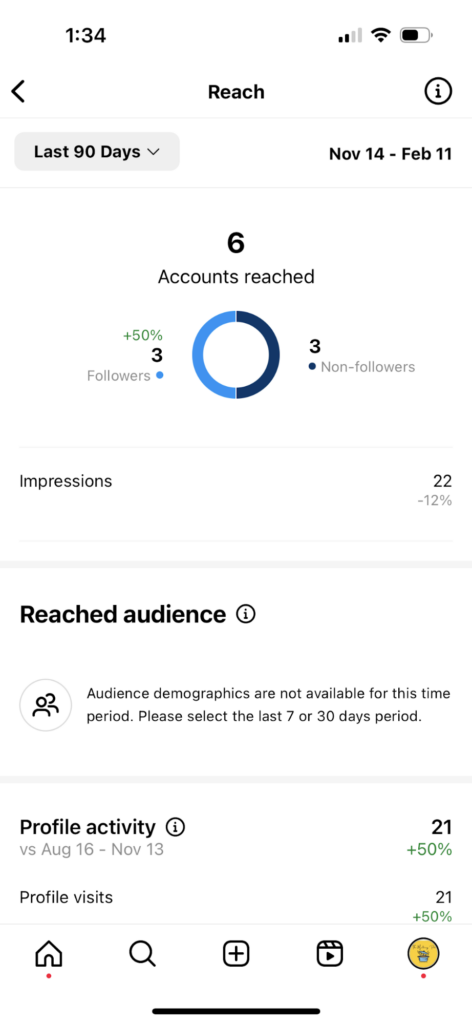
Accounts Reached
The accounts reached option will show you the total number of users you were able to reach within the given timeframe. It gives you access to the following metrics:
- Reach categorized by followers and non-followers
- Demographic breakdown of users reached
- Impressions
- Top-performing content based on reach
- Profile activity (including button taps and profile visits)
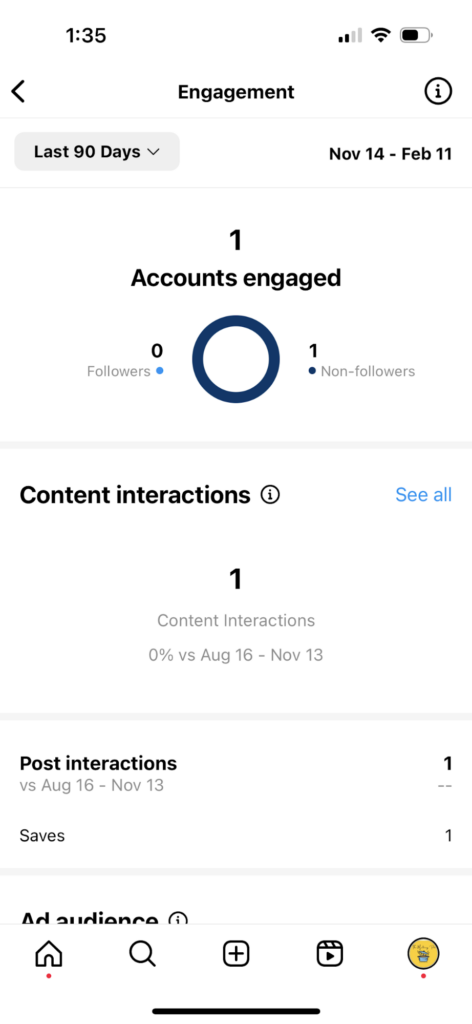
Accounts Engaged
Under the Accounts Engaged section, you can get a look at the total number of accounts you managed to engage during the selected time period. It gives you a breakdown of the following metrics:
- Engagements by followers and non-followers
- Total content interactions along
- Interactions for each type of content
- Top-performing content based on interaction metrics such as likes or replies
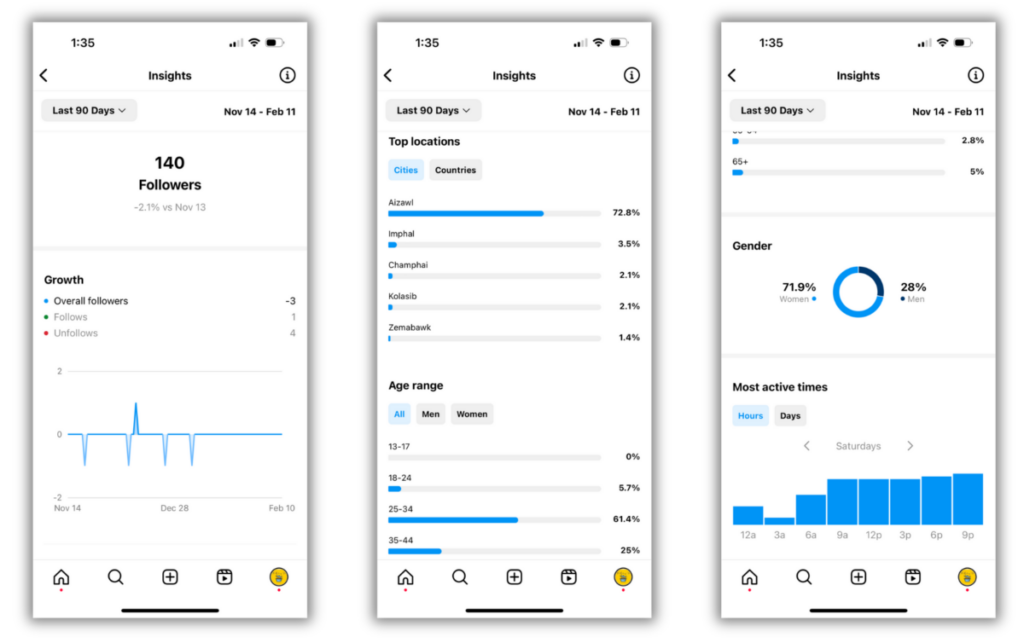
Total Followers
This section shows you a detailed breakdown of your follower metrics such as overall growth, follows, and unfollows during the given timeframe. From here, you can access information related to the top locations of your followers, their age range, their gender distribution, and their most active times.
How to Access Your Instagram Insights
The first thing to note is that Instagram Insights is only available to Business or Creator accounts. So if you plan on using the native analytics, make sure to switch your personal account to one of these options.
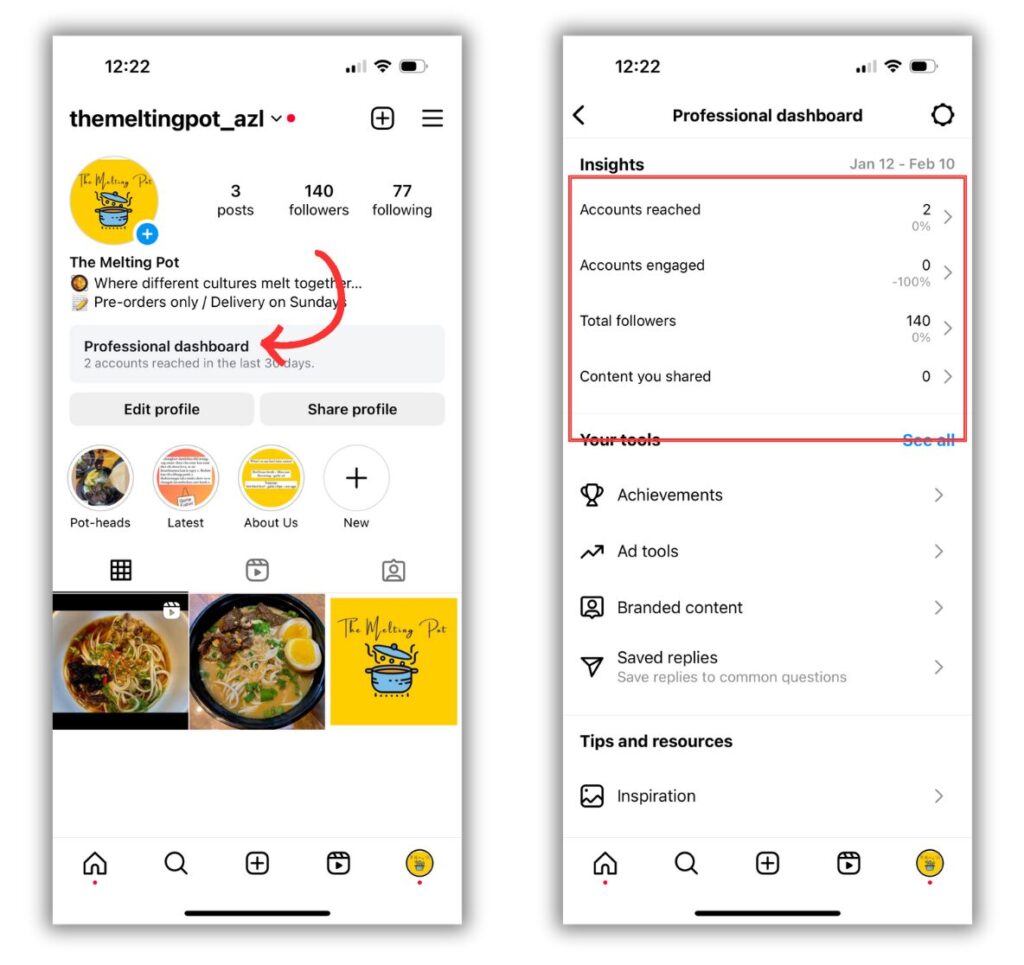
Once your Business or Creator profile is set up, there are two ways to access your Instagram Insights. First, go to your profile and tap on the three-line button at the top right-hand corner of the screen. Then tap on “Insights” to open your full Insights dashboard.
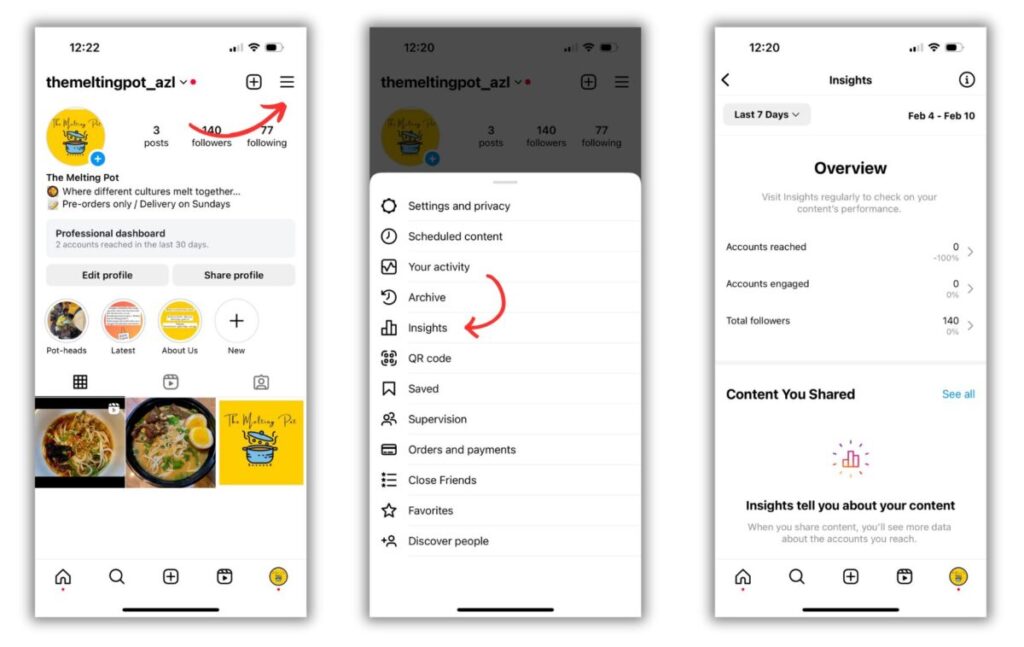
Alternatively, you can also access your Instagram Insights from your professional dashboard. Tap on the “Professional dashboard” right below your Instagram bio. Then tap on one of the options under “Insights” to expand on key Instagram metrics.
Top Metrics to Track for Instagram Analytics
There’s a wealth of data that you can use for Instagram analytics. Even the native analytics alone can reveal an abundance of information that will help you guide your strategy. The challenge lies in identifying the metrics that truly matter to you.
If you don’t have a clear idea of what metrics to track, you end up getting overwhelmed with too much data. In other words, there’s too much noise that you’re unable to make sense of the data.
The metrics that matter to you mainly depend on what you wish to achieve with your Instagram strategy. If your goal is brand awareness, you’ll mostly be looking at your reach and impressions metrics, for example. But if you’re looking to drive sales, you’ll need to look out for metrics related to website clicks and conversions.
That said, there are a few metrics that should be closely monitored regardless of your goal. We recommend monitoring the following metrics to make sense of your Instagram performance and inform your strategy.
Engagement metrics
Engagement is one of the most important metrics to measure your Instagram performance. It helps you assess how well your content resonates with your audience. A post that gets a ton of likes, comments, and shares typically means that your audience enjoyed the post. So you can use engagement rate to determine the types of content your audience likes.
Moreover, engagement is a key factor that influences how the Instagram algorithm decides which content to display to each user. Posts that get a ton of engagement are more likely to be prioritized in the Explore pages and feeds of certain users. This is because those engagements signal to the algorithm that the audience likes the content, therefore indicating that it’s relevant and high-quality. So it tries to deliver a positive experience by displaying the same post to similar users.
According to SocialInsider data, the average Instagram engagement rate is 0.70% for all industries. However, the numbers may vary based on your industry and post type. RivalIQ found that image posts have an engagement rate per impression of 5.4% while carousel posts manage to get ahead with 5.9%.
Reels, on the other hand, have an engagement per impression of 4.3% whereas video posts see 3.8% engagements per impression. You can use these numbers to benchmark your performance and see where you stand in comparison to the industry norms.
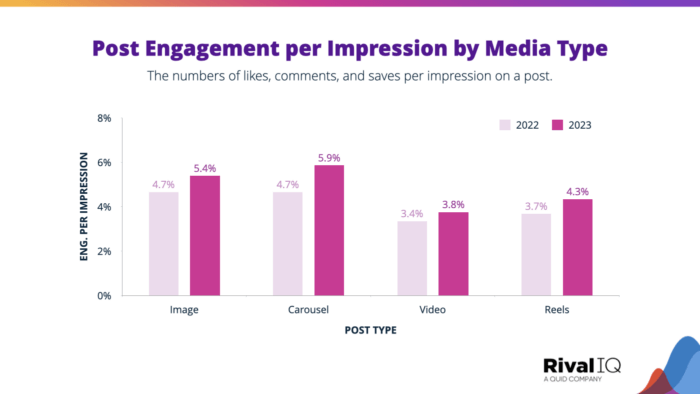
Source: rivaliq.com
Website clicks
It’s not enough that people engage with your brand on Instagram unless you’re solely using it to build a community. If you want to drive customers to your website, you should also be looking into your website clicks. The Activity section in your Instagram Insights will show you the number of times people clicked on the link in your bio.
Keeping track of this metric will help you understand how effective your CTAs are and how well you manage to promote the link. If you’re not seeing enough clicks, you may want to hype up the relevant web pages more and create more compelling CTAs.
Audience demographics
The success of your Instagram marketing strategy relies on how well you manage to engage your target audience. That’s exactly what makes it so important to look into your demographics breakdown so you can gain a better understanding of your Instagram followers.
First of all, looking at your Instagram audience demographics will help you see whether you’re reaching your brand’s target audience. This is necessary to ensure that your Instagram presence can be seamlessly integrated into your existing marketing efforts. If there’s some misalignment, you may need to pivot so that you’re attracting the right types of users to your Instagram page.
Additionally, looking into your audience demographics will help you understand how to adapt your messaging and strategy to better resonate with them. Some of the data can inform various aspects of your marketing strategy beyond Instagram. For instance, your Instagram Insights may tell you that most of your followers are located in Seattle. You can then use this information to decide where to set up a pop-up shop or organize an event to attract lots of foot traffic.
Follower growth metrics
Businesses and creators on Instagram have one common goal–to grow their reach. And the best way to achieve this is by growing their following. While having more Instagram followers may not be your number one goal, it’s one of the most important factors influencing your account visibility. This, in turn, will impact other aspects of your performance as the more followers you have, the more accounts you’ll reach and the more engagements you’ll get.
So you should keep a close eye on your follower growth rate to gauge your account health. You should ideally see a gradual increase in followers over time if your Instagram strategy is working. According to Social Status, the average Instagram account growth rate is about 1.62% per month. Meanwhile, Flick estimates that most Instagram accounts see a year-over-year growth of 24.3%.
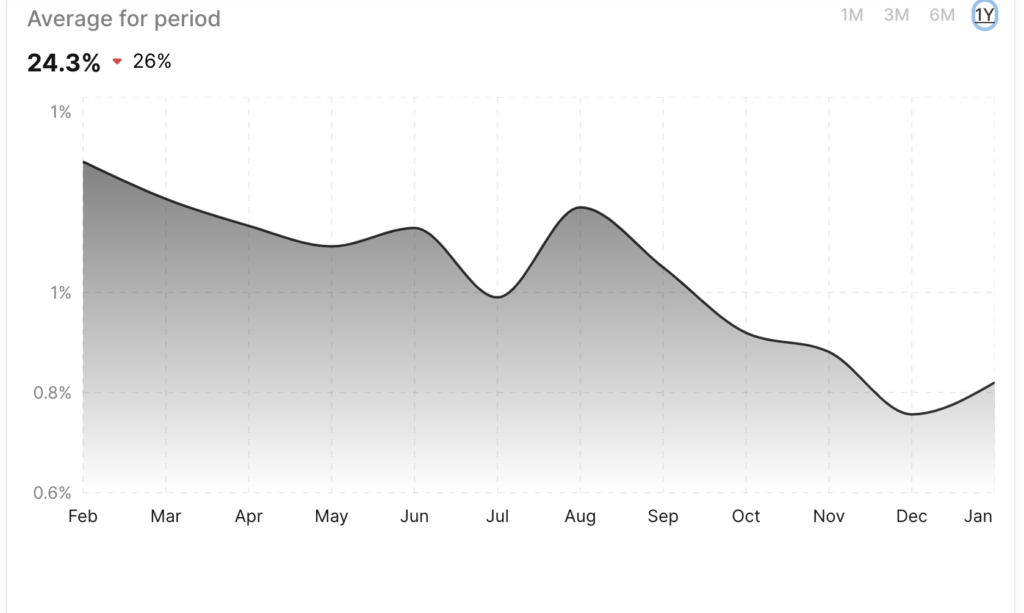
Source: flick.social
Additionally, you need to look out for sharp and sudden changes in follower growth to pinpoint specific actions or events that are impacting your Instagram performance. A sudden spike in followers could give you a hint that something you did recently is working. Perhaps the change came from one Reel that went viral, for instance.
On the other hand, a drop in following could be a sign of trouble. Did you recently post something that might have caused some backlash? You could dig deeper by looking at comments and conversations that could explain what’s causing people to unfollow you.
Reach metrics
Reach is a measure of the number of accounts that see your post. Since it accounts for views per unique user, it’s a much more accurate indicator of your performance compared to impressions. So we recommend focusing on this metric instead of impressions if you want to get a better idea of your content visibility.
Your reach metrics may not be the most important KPI, but they give you a fair idea of your Instagram performance. This is particularly true for measuring brand awareness and understanding whether you’re generating buzz.
Reach helps you understand how well your posts are showing up for users. You can use this to determine the popularity of a certain post so you can break down the factors leading to its success. This can then be replicated to improve your overall Instagram content strategy and create content that expands your reach.
Similarly, reach metrics help you understand whether your content is well-timed. For example, if posts that go out at 7 pm have a much higher reach than posts that go out at 9 pm, you may want to time your posts more strategically by scheduling them to go out at 7 pm.
Going Beyond Instagram Insights
The native Instagram analytics dashboard offers a wealth of data on your Instagram performance. However, there are some limitations if you want more comprehensive insights.
For starters, you can only track metrics for specific data ranges, which could limit your analysis. And although it provides some of the most essential metrics, these metrics may not be enough for some businesses. For instance, it doesn’t let you analyze your competitors or monitor the sentiment around your brand.
So you should consider using it alongside a third-party analytics tool that can provide more robust performance insights. There are plenty of Instagram analytics tools in the market that can unlock even more powerful data than what you’re getting with the native dashboard. Sprout Social, Brand24, and Brandwatch are some of the best tools to use for Instagram analytics.
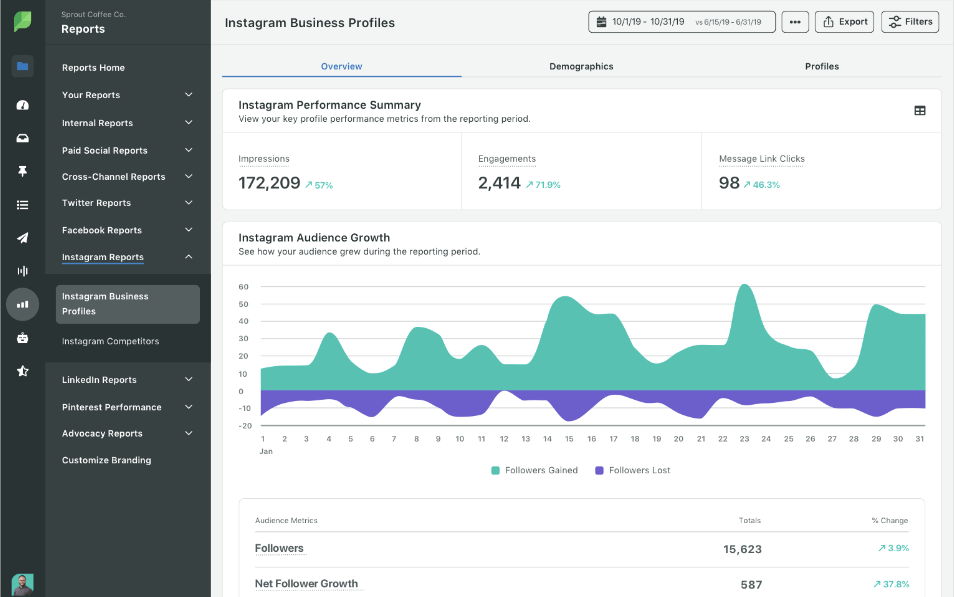
Source: sproutsocial.com
Make the most of these to get a 360-degree view into your Instagram performance. Many of these tools even come with features to track mentions and conversions so you know what people are talking about. This is perfect for uncovering trending topics and hashtags to inspire your content ideas.
Analyze and Optimize for Instagram Success
Closely monitoring your Instagram analytics will help you make informed decisions on how to approach Instagram marketing. It will help you see what’s working and what’s not so you can pivot and optimize for improved results. Keep track of the metrics highlighted above to constantly analyze your Instagram performance.
Frequently Asked Questions
What are good analytics for Instagram?
The native Instagram Insights dashboard provides you with comprehensive analytics for the platform. Additionally, you can also use third-party analytics tools like Later, Hootsuite, and Sprout Social.
What do Instagram Insights tell you?
Instagram Insights gives you a glimpse into your performance in terms of followers and content. You can view post-specific performance metrics to understand how many people you reached and how much engagement they drove.
Can you tell if someone saves your Instagram pictures?
Instagram Insights shows you the number of people who saved your posts to their collections, but you can’t see who has saved them.
Does Instagram Insights show who views your profile?
Instagram Insights shows you the number of profile visits you received after viewing a certain post. However, you can’t see who views your profile specifically.
How do I see my Instagram impressions?
You can see your Instagram impressions from the Insights tab.