No matter how small your business may be, your digital marketing analytics should be a vital tool to understanding, and improving, your online marketing activities. Even if you’re not mathematically inclined, you should keep a close eye on the data relating to your marketing campaigns – and this collection of small business digital marketing analytics should tell you everything you need to know.
Your analytics give you insight into the successes and failures of your marketing activities. And this can be just as important for small businesses, where every dollar counts, as it is for enterprises running multi-million-dollar campaigns.
However, you can get lost in a rabbit warren of irrelevant marketing analytics if you aren’t careful. Remember, that for data to be considered information it needs to be useful. Don’t waste your time studying every statistic you can find. Many analytics are best considered vanity analytics – i.e. improving them may help your ego but do little to improve the profitability of your business. Perhaps this is most evident in Social Media Marketing, with users focusing on the number of followers they have, without examining the types of people following them. In this post, we examine some of the more valuable small business digital marketing analytics, so you don’t get lost trying to have better vanity metrics than your competitors.
Where Will You Find Your Digital Marketing Analytics?
If you’ve been marketing for a while, you will probably know that the various online platforms provide a plethora of analytics, often trying to outdo each other for the range of data they make available. You are likely to find analytics relating to every channel you use in your marketing campaigns.
Each of the main social networks makes analytics available to their users, although you do need a business account in some cases, such as Instagram. If you operate a website, Google provides a free analytics service that they are constantly improving to give you an insight into the users and uses of your site. Amazon and Walmart similarly provide a full range of analytics to sellers and advertisers in their eCommerce marketplaces.
If you’re into PPC advertising, you will find much data available to help you determine the best terms on which to focus your ads. Amazon, in particular, provides many tools you can use to ensure you’re targeting the best terms.
In addition, you will find multiple specialist third-party marketing analytics platforms and tools online that can give you even more in-depth analytics about a wide range of digital channels. We have reviewed many of these in our Platforms section, depending on the types of software you are looking for. For example, most Social Media Marketing platforms will collect data relating to your social channels and present it to you in a more useful format. Any Email Marketing platform will provide you with analytics relating to your email marketing campaigns. Small businesses operating on Amazon are particularly well served, with multiple tools providing data relating to the effectiveness of your advertising, bid automation, keyword discovery, PPC campaign automation, advertising automation, and much more.
Indeed, you are likely to find far too much data relating to your marketing campaigns, and it is easy to become bogged down on unimportant, often irrelevant, stats while missing trends that really matter. We, therefore, suggest some of the more important digital marketing analytics on which you should focus.
The Most Important Small Business Digital Marketing Analytics
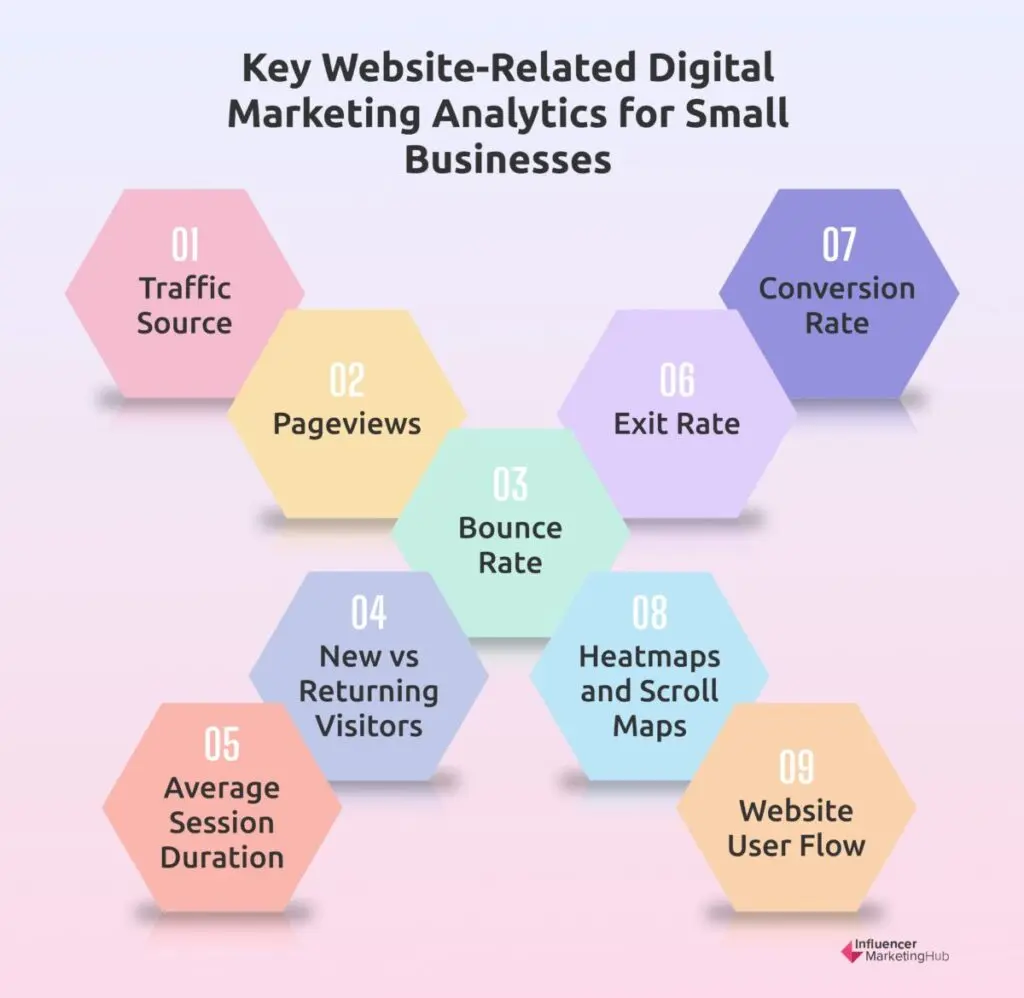
Website Related Analytics
Website related analytics
1. Traffic Source
Although this statistic relates primarily to your website, it can also be relevant for some of your other channels. It helps you understand where your site visitors (and customers) come from, and how they find your site or online store.
If you are a very small business, with a minuscule marketing budget, you can still find much of this information in your Google Analytics (now known as Google Analytics 4). Many other specialist analytics tools can provide and expand on this data too.
This stat tells you the relative percentages of visitors who arrive at your site via:
- Direct – they enter the URL or follow a bookmark to your site
- Organic Search – they come to your site through an organic result in a Google search
- Social – they come to your site via a social media post
- Referral – they come to your site by clicking on a link on another website.
- Mail – they come to your site by clicking on a link in an email
You should put most of your resources into the sources that bring the most visitors to your site. For example, if you only have a small percentage of visitors from Social, it is probably not worth your effort to focus your campaigns on your social accounts, unless you have a specific goal to increase Social as a traffic source percentage.
2. Pageviews
This stat focuses on how often people click on the various pages on your website. Obviously, you want people to first go to your preferred landing pages, and then click through to your pages of focus.
This is an important stat that can help you set up your SEO. You will want to ensure your Calls to Action (CTAs) lead to pages with high pageviews. Too many websites channel people directly to their Home Page (expecting that to be the Direct URL that sends the most traffic) rather than to important pages that direct visitors to take the actions they want. For example, your ads could direct visitors to specific landing pages that only contain the links to products you most want your visitors to buy. You can test whether these ads are working by examining the pageviews of both the relevant landing page and the sales pages promoted.
3. Bounce Rate
The Bounce Rate is the percentage of people who only view one page of your website. A high Bounce Rate may mean that people come to your site, and then leave again because they can’t find what they are looking for.
Of course, this all depends on the structure of your site. If you use one of those modern single-page site designs, you will automatically have a very high (almost 100%) Bounce Rate.
Tie this in with how you have structured your campaigns. For example, if you have created PPC ads that lead to a specific landing page, and then you have sent visitors through to set sales pages, you would hope that most site users would visit at least two pages (three, if you, in turn, send customers to a separate sales page). In that case, you would aim for a small Bounce Rate.
If you operate a blog, and link to specific posts in your social media messages, you might have a higher Bounce Rate when visitors click on the link to a post, read the post, and then leave your site. In that case, you should consider adding more CTAs to your blog posts, to encourage visitors to explore more of your content and increase the Exit Rate on other pages of your site.
4. New vs Returning Visitors
Sometimes it will be useful to know the percentage of people visiting your website for the first time compared to those returning for a second or greater visit. This can relate to the goals of a specific campaign – who are you targeting – newcomers or repeat customers? If you are targeting newcomers in your marketing, but most of your site visitors are your “regulars”, then it is probably worth tweaking your campaign.
This statistic isn’t perfect from a marketing perspective, but acts as a reasonable proxy. Technically, New Visitors are those navigating to your site for the first time on a specific device, so somebody who comes to your site on their computer, and then returns on their phone, counts as two “new” visitors in Google Analytics. However, Google is getting smarter and can recognize that somebody logged into Chrome on two devices is probably a single person, treating their visit on the second device as a “return”.
If you find that a high percentage of visitors only come to your site once, you could incentivize return visits, for example by offering a new coupon code to customers after their first purchase. Alternatively, if you find new visitors don’t follow through to do whatever goal you’ve set them, you could look closely at the effectiveness of your Call-to-Action buttons or even incorporate an exit popup (but be careful with that - popups can annoy people - however they can nevertheless be highly effective).
It is worth comparing this statistic with your Bounce Rate. A high percentage of new visitors matched with a comparatively high Bounce Rate may indicate a problem – people coming to your site, perhaps as a result of a search, and then leaving again without finding what they want. If Returning Visitors have a higher bounce rate than New Visitors, the quality or the quantity of your content may be decreasing. Visitors may return briefly to the site but no longer find your content to be useful.
5. Average Session Duration
This stat indicates how long visitors spend on your website. The longer they spend there, the more they are looking at and searching around your site.
You must interpret the average session duration in context and in conjunction with other statistics. A long average session duration isn’t necessarily always good, however. It may mean that visitors get lost on your site and take time to find what they are looking for, so you should also keep a close look at the pages they have visited.
Your Average Session Duration will differ depending on the niche or industry you operate in. For example, if you operate a blog, you may find that your Average Session Duration may vary depending on how long it takes people to read your latest blog post. People probably don't spend a long time on banking websites, for example, just enough time to make their desired transactions and move on. If you run a large eCommerce store, however, your Average Session Duration may be quite lengthy as people spend time browsing, looking for products to buy. However, this will be affected by where people are in the purchasing funnel, and whether they are ready to buy or are still browsing, not committed to making a purchase yet.
6. Exit Rate
The Exit Rate shows the percentage of visitors who leave your site from a specific page. Obviously, everybody has to leave somewhere, but you should ideally be able to create a flow for your visitors to follow.
If you see unexpectedly high Exit Rates on certain pages, look more closely at the content on those pages and see what you can do to encourage visitors to increase their Average Session Duration by moving onto other pages.
7. Conversion Rate
Perhaps the most important small business marketing statistic, particularly if you use your website as a sales channel, is your Conversion Rate. However, remember that conversion doesn’t mean making more sales. In this context, you convert when people meet whatever marketing goal you have set for a campaign. So, your conversion rate may mean the percentage of website visitors who sign up for your newsletter, click through to your social pages, or whatever you want them to do when visiting your site.
8. Heatmaps and Scroll Maps
These visual tools offer a deep dive into user interactions and preferences on your site, shedding light on behavior patterns we might not otherwise detect.
Click Heatmaps give a visual representation of how people interact with your web pages. They are an overlay of your page that literally looks like fire. The “hotter” a region is (i.e. the more somebody clicks on a part of the page), the redder the heatmap overlay is. Sections of the page with fewer clicks are colored orange and yellow. “Dead” parts of your page (where few if any people interact with your site) are shown in shades of blue.
Heatmaps are generally generated based on mouse movement, clicks, and scroll depth.
Heatmaps can tell you if people are interacting with your site in the way you intended. For instance, you might find that virtually nobody scrolls down to the bottom of a landing page where you’ve placed action buttons. Perhaps you’ve used too much text and people move away from your site before they get to the action buttons.
Scroll maps are a variation of heatmaps that focus on how people scroll through your page, instead of looking at their clicks. The top section of your landing page will be red, but at some point, the region will change to orange, then yellow, to various shades of blue, depending on how far your site visitors have scrolled through the landing page you’re analyzing.
9. Website User Flow
By mapping out the journey users take on your site, you can gain insights into how to enhance the user experience and boost conversion rates.
Website user flows outline the path typical users take when exploring a website, app, or other digital product. They map out a user's entire experience, from their initial access point to the last interaction, detailing each step they take along the way.
Preferably, your website designer should create an ideal website user flow when designing your website or eCommerce store. To do this, however, they need to understand a typical user of your site. For example, your designer needs to research your site users’ goals, motivations, desired features, level of experience, and barriers they may face. Because you will probably have leads and customers at different stages of the sales funnel, you ideally need to reflect this in the design of different web pages.
Once your website is operational you can use your Google Analytics data to compare the actual website user flow with your original ideal model and optimize your site accordingly. You can also use products such as Userpilot to gather more in-depth data about how people use your site. For example, you can use funnel analysis on Userpilot’s platform to understand where users are getting stuck. You can also identify friction points that are affecting user activation, feature adoption, and expansion revenue.
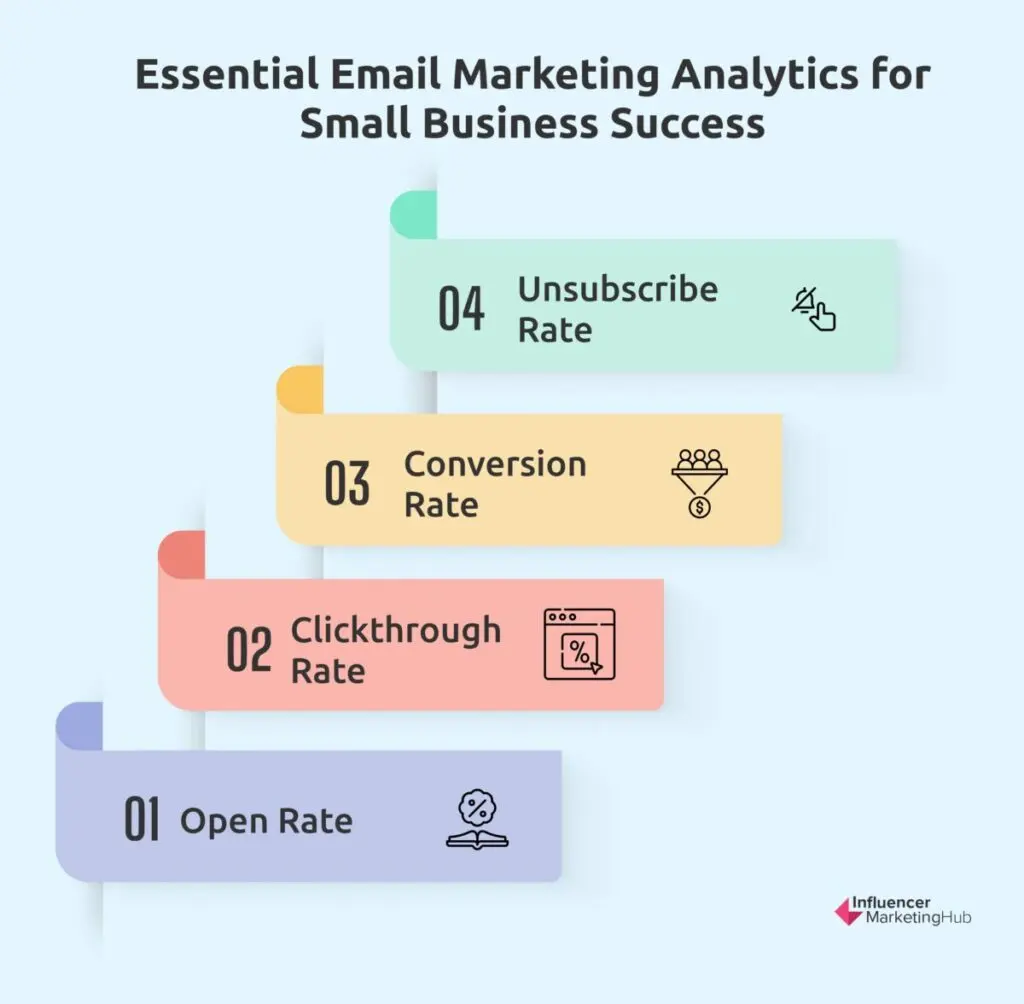
Email Marketing-Related Analytics
You should be able to find most of these in your Email Marketing Software. Most of these relate to specific emails you send, rather than to your email marketing as a whole. Many of our Best Direct Email Marketing Strategies utilize these analytics.
Email marketing analytics
1. Open Rate
This shows you the percentage of the emails you send that people open. As we saw in our Ultimate List of Email Marketing Statistics, the average open rate for emails (using MailChimp at least) is 21.33%. This varies across industries, however.
This is a very simple statistic - but your emails are of no value, no matter how well written they are, if nobody’s opening them. Nobody is going to click through or convert (or even unsubscribe) if they don’t first have a reason to open your emails.
There are a range of factors that affect your open rate, not all of which are within your control. These include:
- how strong and interesting your subject line is - people are unlikely to open emails with vague and weak subject lines
- your sender information, i.e. who the email appears to come from - you may need to test this. Some brands use their name in the From field, while others prefer to consistently use a person’s name.
- the time you send your email
- how well you segment your list - not all of your emails will be relevant to everybody on your email list. Segment your list so you only send emails to relevant recipients
2. Clickthrough Rate (CTR)
Unfortunately, not everybody who opens an email then clicks through to the links you’ve included in it. Your Clickthrough Rate shows the percentage of email recipients who click through to at least one link in a given email.
It is a vital metric for email marketing, as it gives you a guide to how much interest people have in a particular email. You can compare your Clickthrough Rates over time, to see how interested people are in engaging with your emails and establish the types of emails most likely to attract their attention.
The average email CTR is 1-5%, and most people consider a CTR of 3% or higher to be a good result. However, this will vary depending on factors like your company’s size, industry, country, the type of email you’re sending, and the quality of your email list.
There are various ways to improve your CTR, including:
- personalizing your emails, e.g. using the recipient’s first name
- include the most important information near the start of your email (making it scannable)
- only including a few important CTAs
- including high-quality images in your email
- optimizing your emails for mobile
3. Conversion Rate
As with most other types of digital marketing, email marketers can calculate their conversion rate. In this case, the Conversion Rate represents the percentage of people who open a given email you’ve sent, click on at least one link, and do some intended action, e.g. purchase a product, or read a promoted blog post.
Many of the factors that affect Open Rate and Clickthrough Rate also impact Conversion Rate. For example, using segmentation ensures that you only send your email to people who potentially will have an interest in its contents.
You can often improve your email Conversion Rate by using A/B Tests. For example, you could test how different CTAs affect your Conversion Rate, or whether personalization works best for your audience, without looking too creepy to them.
4. Unsubscribe Rate
Every time you send an email, some percentage of your email list is likely to click on the Unsubscribe button. While you would probably prefer everybody to like your emails, this is unlikely, and it is better to lose unhappy people, rather than to have them still receiving emails from you, feeling disgruntled.
This is less important than the other stats, however, you should keep an eye out for a sudden spike in this measure. The email marketing platforms become wary of customers with high Unsubscribe Rates.
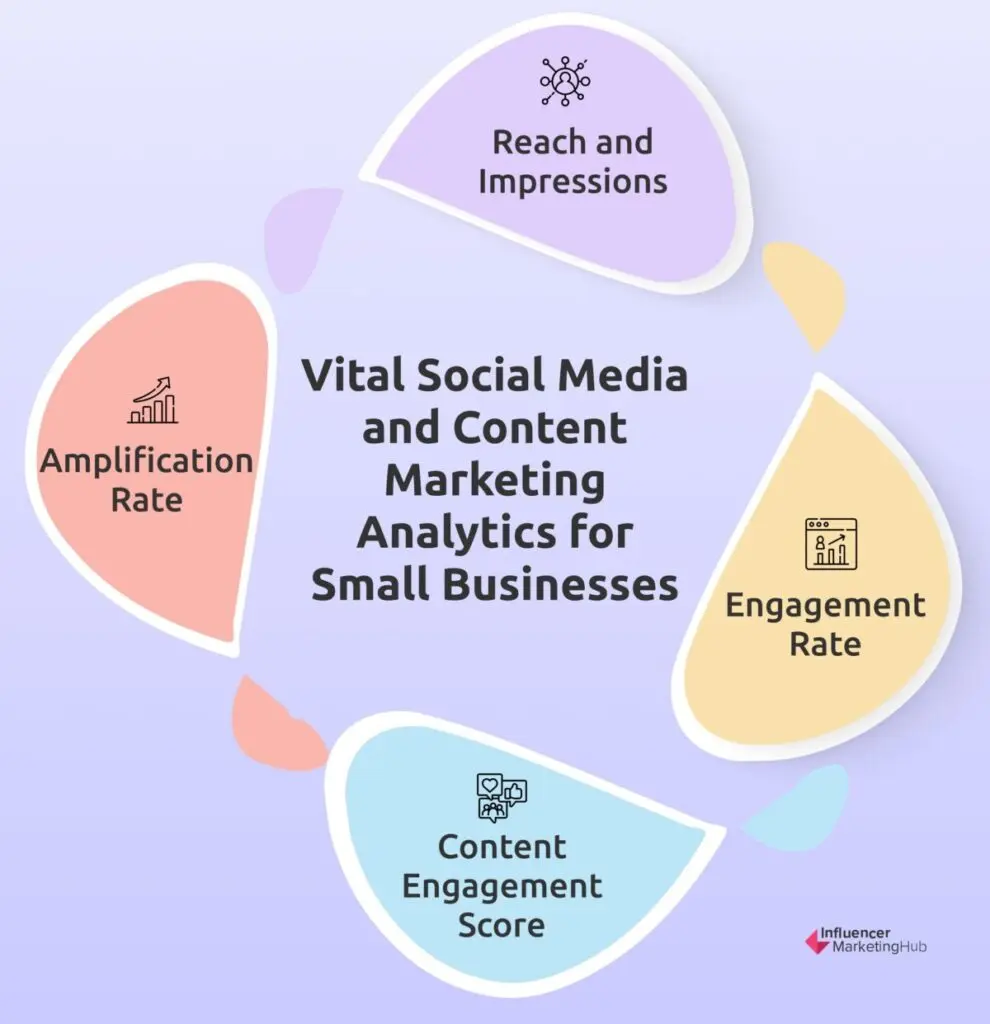
Social Media Marketing and Content Marketing-Related Analytics
Many of the following analytics apply to both social media marketing and content marketing, as both types of marketing involve sharing and distributing content. For example, a content marketer may create blog posts for a blog they host (possibly on their company website). They will in turn use social media to promote their newly created content.
Social media and content marketing analytics
1. Reach and Impressions
These stats are closely related. Reach indicates how many people have viewed a particular piece of social content. Although the Number of Followers is not a particularly important small business digital marketing analytic, it is worth looking at the percentage of your Reach made up of Followers, compared to Non-Followers. When you reach a high percentage of non-followers, you are finding a new audience that hopefully matches your target audience.
Impressions is a related statistic. This shows the number of times that somebody viewed your content. This differs from Reach, in that when someone clicks on your link a second time it shows as an Impression, but not an additional Reach. Repeated impressions are not necessarily bad, however, depending on where your visitors are in the Purchasing funnel. Those near the top of the funnel are likely to want to click on your posts multiple times before they make a purchase.
2. Engagement Rate
This indicates the percentage of times that people interact with your post. While the definition of engage varies across social platforms, it typically includes commenting, liking, and sharing; basically, whenever somebody does something with your post, rather than just scrolling down to the next post in their feed.
We have previously examined in detail how you can improve your Engagement Rate on both Instagram and TikTok. Suggestions include:
- being consistent in your social posting
- using hashtags
- posting Stories regularly
- mention others
- use video
- be authentic
3. Content Engagement Score
This is a holistic metric that provides a snapshot of how our content resonates with your audience, gauging engagement through their interactions. Alongside your Engagement Rate, it gives a good indication of the effectiveness of your content, what resonates with your audience, and what fails to attract readers or viewers.
To work out a Content Engagement Score you need to have clear goals for your content/social posts. That way you can focus on metrics that really matter to you (and your bosses). You can set up goals in Google Analytics, Facebook Ads, and most other advertising platforms to help with your data collection.
You will need to look closely at the goals you’ve set for your campaign and decide which engagement actions best represent success. Create a point system based on the relevant importance of each interaction.
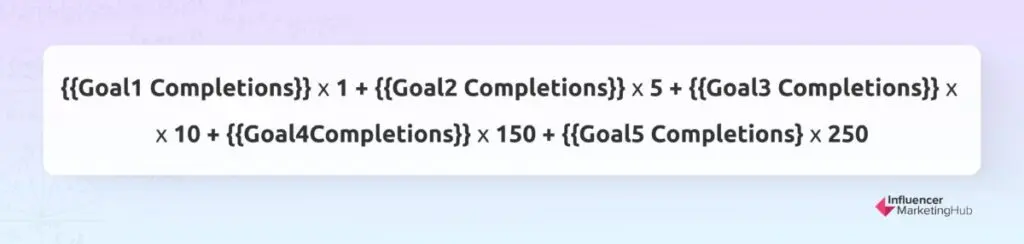
Martijn Scheijbeler provides an example for an eCommerce business, where he weighted interactions to content in a campaign as follows:
- Pageview: 1 point
- Article share: 5 points
- Newsletter subscription: 10 points
- eCommerce sale: 150 points (or varying on the product value)
- Ticket sale: 250 points
As you can see, ticket and eCommerce sales are much more important engagements than pageviews or article shares. You can then create a formula to work out your Content Engagement Score as follows:
Content engagement score
There is no ideal Content Engagement Score, however, the content that generates the highest score will be your best-performing content, and give you an idea of where to focus your future content creation/distribution.
4. Amplification Rate
Your Amplification Rate shows you the percentage of shares your post receives relative to your number of followers. The more people share your post, the greater your total audience will be. Amplification is the rate at which your followers take your content and share it through their network.
So what can you do to increase the Amplification Rate of your content? Begin by creating, highlighting, and sharing visual content - few people share basic text or link posts nowadays. Also, make a point of using trending hashtags and memes - just make sure that they are appropriate for your audience. And, as we’ve mentioned above, share your posts at peak times.
Online Advertising Marketing-Related Analytics
These relate to PPC online ads, like Google Ads, as well as paid Social Media ads, like Facebook Ads, and ads in places like Amazon.
Online advertising metrics
1. Cost Per Click (CPC)
This is relevant for any campaign where you have to pay every time somebody clicks on your ad. The CPC will often depend on what others bid for a particular keyword. We have looked at how to best utilize this stat in our Seller’s Guide To Paid Media.
Many factors affect your CPC. For example, on Google Ads, Google takes into account:
- Your maximum CPC bid
- Ad Quality
- Ad Rank thresholds
- Context of search
- Expected impact of ad extensions or ad format
- All of the above factors compared to your competitors
Advertisers with higher-quality ads end up paying lower CPCs. Google determines ad quality, using these factors:
- Expected click-through rate
- Ad relevance, i.e. how well your ad messaging matches the keyword’s search intent.
- Landing page experience, i.e. how well your landing page matches the keyword’s search intent.
You can improve your CPC by:
- Testing and modifying your bidding strategy
- Bidding on lower-cost keywords, avoiding highly competitive ones
- Targeting long-tail keywords
- Using negative keywords
- Creating unique ad sets for every targeted keyword
- Segmenting your audience and ads
- Testing and optimizing your landing pages
- Focusing on relevance
2. Cost Per Thousand Impressions (CPM)
Sometimes you are more interested in people viewing your ad, rather than clicking on any link. In that case, you could focus on ads that let you pay based on a Cost per Thousand Impressions (CPM). Obviously, you want a lower CPM, but only if you are still targeting the correct audience.
3. Return on Advertising Spend (ROAS)
This metric is crucial for understanding the efficiency of our advertising spend in generating revenue, guiding us towards more informed budget allocation decisions.
Return on Advertising Spend (ROAS) measures the amount of revenue earned for every dollar you spend on advertising. It effectively tells you your ROI on your advertising spending.
You can calculate your ROAS for a campaign as follows:
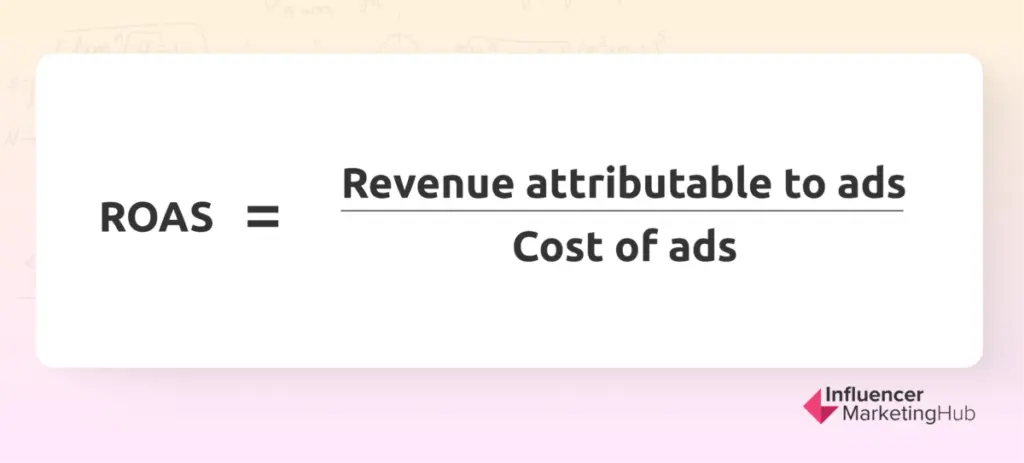
ROAS
ROAS = Revenue attributable to ads / Cost of ads
Although many firms use the cost they pay an advertising platform (such as Google or Facebook) as their “Cost of Ads”, some take a more granular approach and also include other costs, such as the salary they pay someone who manages the campaign internally, vendor costs (if a vendor facilitates the campaign), and affiliate costs (if they have to pay affiliates for sales they make as a result of a campaign).
ROAS can be particularly valuable to advertisers, because while ROI measures an organization’s overall profits, ROAS better shows how advertising contributes to the bottom line. Ideally, you should calculate separate ROASs for each campaign on each platform. You can break ROAS down to find the return on a particular ad platform, campaign, or ad.
Ideally, you should establish minimum, acceptable, and target ROASs before you start a campaign, and then modify your campaign if you find your ROAS is going outside your preferred range.
Wrapping Things Up
Overall, the main reason for even small businesses to take an interest in their digital marketing analytics is so that they can calculate the Return on Investment (ROI) of any marketing campaign. This calculation will vary depending on whatever goals you have set for your campaign. Despite a common misperception, ROI does not solely relate to your sales and profitability. It is completely related to your campaign goals – how successful has your campaign been at meeting those goals?


