How do you measure the success of your email marketing efforts? Or are you even tracking your campaign performance at all? Regardless of which side of the spectrum you’re on, this guide to email marketing benchmarks will get you sorted. If you want to build better email marketing strategies so you can improve your business’s performance year-over-year and campaign-over-campaign, keep reading. We’re going to share the most important email marketing benchmarks you need to be tracking to get the results you need to keep business booming.
Email Marketing Benchmarks You Need to Track Now:
Why Email Marketing Benchmarks Matter
In this guide to email marketing benchmarks, we’re going to be talking about things like email open rates, click-through rates, bounce rates, and more. But you may be wondering why email marketing benchmarks matter.
For starters, tracking your email marketing benchmarks lets you know if your subscribers are really engaged with your brand. If your open rates are low, your email marketing list might need to be cleaned up to remove those subscribers who aren’t actually interested in what you have to say. Yes, it seems counterintuitive after all the time you spent on growing your email list. However, keeping your list filled with only those subscribers who are engaged will improve your email marketing benchmarks. And, since the leads on your list truly want to be there, you’re more likely to convert those leads to customers.
The email marketing benchmarks we cover in this guide will also let you know how you compare to your competitors. These benchmarks will be different from industry to industry, but you can compare your benchmarks to your industry to get a better idea of how your email marketing success lands compared to the brands you’re competing against. Then, once you know where your email marketing is falling short, you can take steps to improve those benchmarks and blow your competitors out of the water.
The bottom line is that you need to know how your emails are performing if you want to run email campaigns that get results. If you’re not tracking and measuring your data as outlined in this guide to email marketing benchmarks, you’re not going to know how your campaigns are doing or how your email marketing strategies compare to others in your industry. Plus, you can track your email benchmarks over time to ensure that you’re constantly improving your performance.
In this guide, we’ll be talking about the email marketing benchmarks you can track to ensure that your email marketing efforts are working the way you want and expect them to. Ready to find out which email marketing benchmarks you need to track? Let’s dive in.
9 Email Marketing Benchmarks to Watch
Your business isn’t like any other business. Even your closest competitors are going to be different than you because, well, they aren’t you. That means that you need to establish goals and objectives that are right for your business. You don’t need to track every single email marketing benchmark. Instead, track those that matter to you. In this email marketing benchmarks guide, we’re going to share 9 commonly tracked benchmarks that you can use to create your email marketing plan.
1. Open Rate
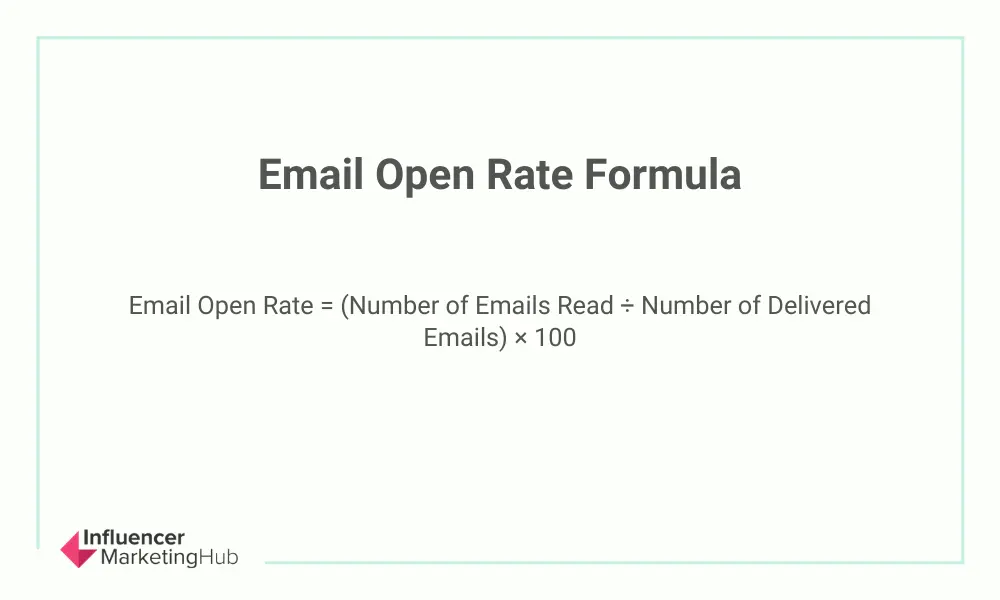
Email open rates are probably one of the most tracked email marketing benchmarks for email marketers. To calculate your open rate for an email marketing campaign, just take the number of opens and divide it by the number of emails sent (subtracting the number of bounces). Here’s the formula, though your email marketing service should automatically calculate this information for you:
The average email open rate across industries is 17.8%. If your open rate is lower than that, it can be due to a few factors. For starters, it could be that your subject lines just aren’t compelling enough to entice subscribers to click. To improve your subject lines you can keep them short, punchy, and personalized. The purpose of a subject line is to pique the reader’s interest and offer them the promise of something good should they choose to open and read your email. Check out these email subject line tips to help you craft truly clickable subject lines.
Another thing to look at when your open rates are lagging is your email list. When’s the last time you cleaned it up? Are you segmenting your subscribers and sending targeted messages designed for each segment? Maybe you’ve been added to a spam list?
If you want to dig deeper into your open rates, you can take a look at total opens compared to unique opens. This tells you if a subscriber opened your email just once, or if they went back to it a few times. This is great information to use when considering where leads might be in their buyer journey so you can match your message to the correct stage of your marketing funnel.
2. Click-Through Rate
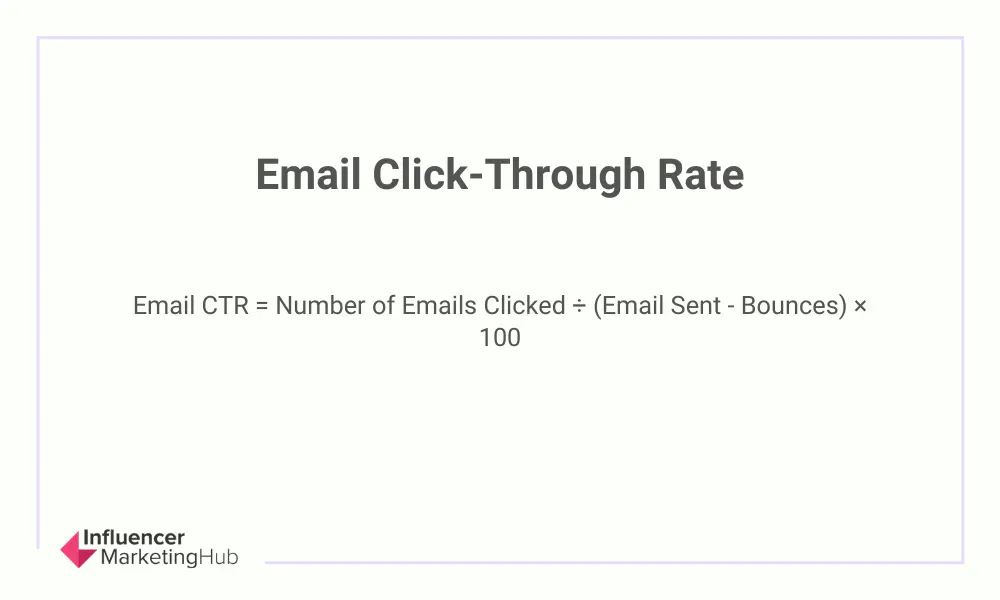
Your email click-through rate (CTR) is the percentage of recipients who click on a link in your email. According to Campaign Monitor, the average CTR across industries is 2.6%. You can calculate it on your own by dividing the number of recipients who clicked a link in your email by the number of emails you sent. Here’s the formula:
Many marketers understand CTR as the email marketing benchmark that helps them figure out if their content is interesting, engaging, and compelling enough to get subscribers to click. If you have a higher CTR, great! That means your calls-to-action (CTAs) are inspiring subscribers to action. But, if you’re seeing low click-through rates, don’t despair. Here are a few things you can do to improve them.
CTA Placement
According to a Journal of Marketing Communications study (2018), links in the top left of an email newsletter pack a bigger punch than links in the top right. This makes sense when you consider that our eyes naturally start in the top left when reading. Then, we move down the page in a Z pattern. Just like reading a book for the folks whose languages flow left to right.
Number of CTAs
Determining how many calls-to-action to include in your emails is a balancing act. On the one hand, you want to make sure that your subscribers don’t miss your CTA. On the other, you don’t want to include so many CTAs that your readers don’t know what’s going on. We recommend keeping your email marketing campaigns focused on a single goal. That means a single CTA. What is the most important thing you want your subscribers to do when they read this email? That’s your CTA.
3. Click-to-Open Rate
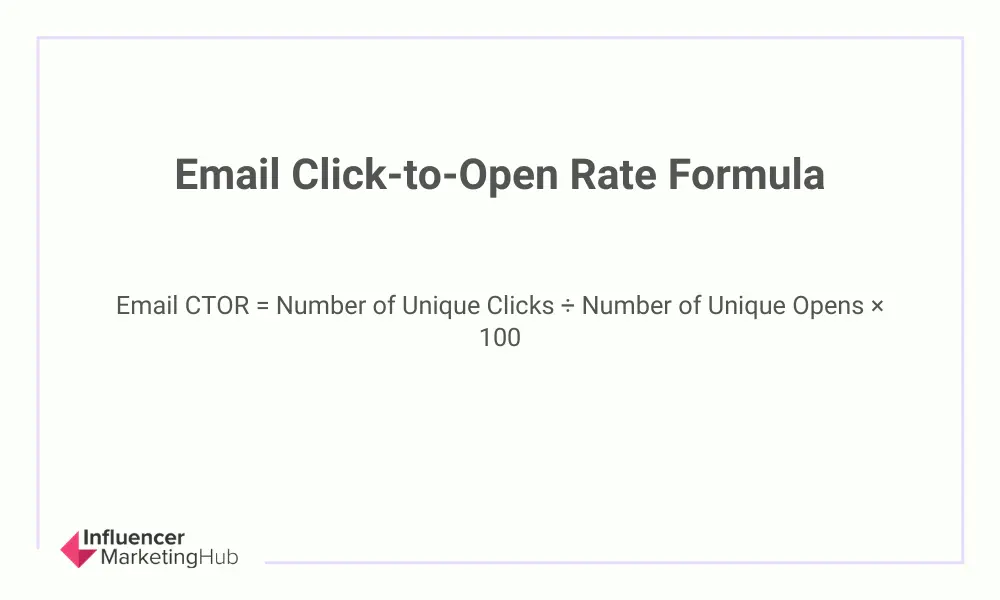
While your email open rate counts every open, the click-to-open rate (CTOR) counts only unique clicks. So, if recipients open your email more than once, your open rate is going to count each of those opens individually. The CTOR, however, counts only one open for each recipient no matter how many times that recipient opens your email. It’s calculated by dividing the unique number of email clicks by the total number of emails sent. Here’s the formula:
CTOR tells you how many recipients found your content valuable or relevant enough to them to drive them to click. If your click-to-open rate is low, have a look at your email campaign’s design. Is it easy to skim? Is it personalized and relevant? Using dynamic content is a great way to personalize your emails without needing to create several different emails for different segments. We’ve included CTOR in our guide to email marketing benchmarks because it tells you if your subscribers are, overall, interested in your content.
4. Unsubscribe Rate
You’re never going to make everyone happy with your email marketing. Some of your emails are going to result in unsubscribes and that’s okay. But knowing your unsubscribe rate and which emails resulted in unsubscribes is the best way to find out what’s working and what isn’t so you can make adjustments. The average unsubscribe rate across industries is tiny—just 0.1% (Campaign Monitor).
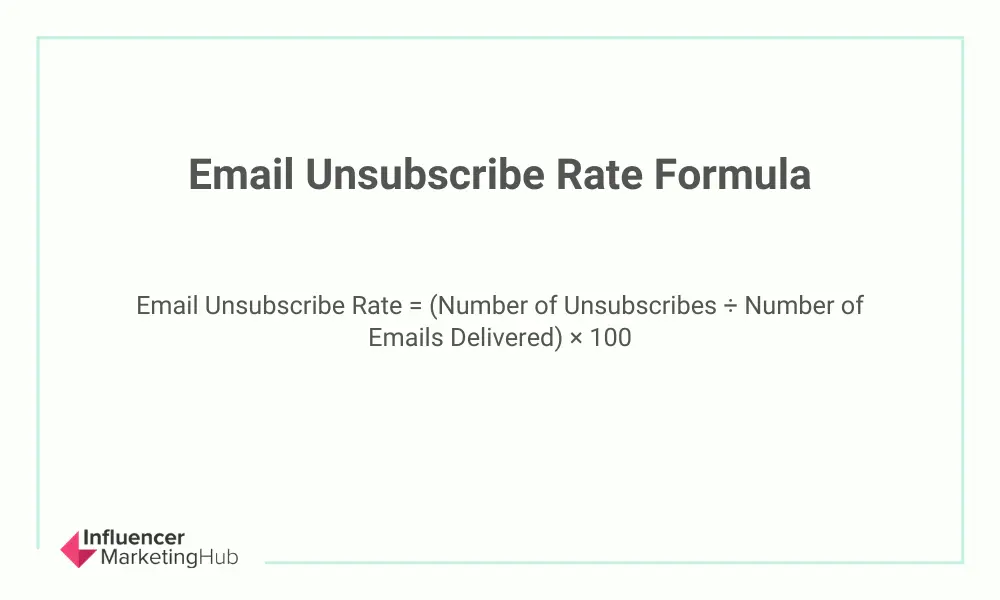
To calculate your unsubscribe rate, take the number of unsubscribes and divide that by the number of emails sent (minus bounces). Here’s the formula:
If you’re seeing high unsubscribe rates, there are a few things to take a look at. Once again, the first thing to consider is your subject line. It needs to be short, interesting, and personalized if you want subscribers to care about your emails enough to stay subscribed. You’ll also want to make sure that you aren’t sending too many emails. This will largely depend on what your audience wants, so we recommend testing different frequencies or just outright asking your subscribers how often they want to hear from you.
5. Bounce Rate
Bounced emails are those emails that couldn’t be delivered. This could be due to spam or server issues and can be either temporary or permanent. The bounce rate, then, is the percentage of subscribers who didn’t get your email because it was declined by their email server. Campaign Monitor reports that the average bounce rate across industries is 0.7%.
There are two different types of bounces: hard bounces and soft bounces. A hard bounce happens when your email is declined without ever being accepted by the recipient’s server. A soft bounce happens when your email makes it into the recipient’s email server but is still sent back as undelivered.
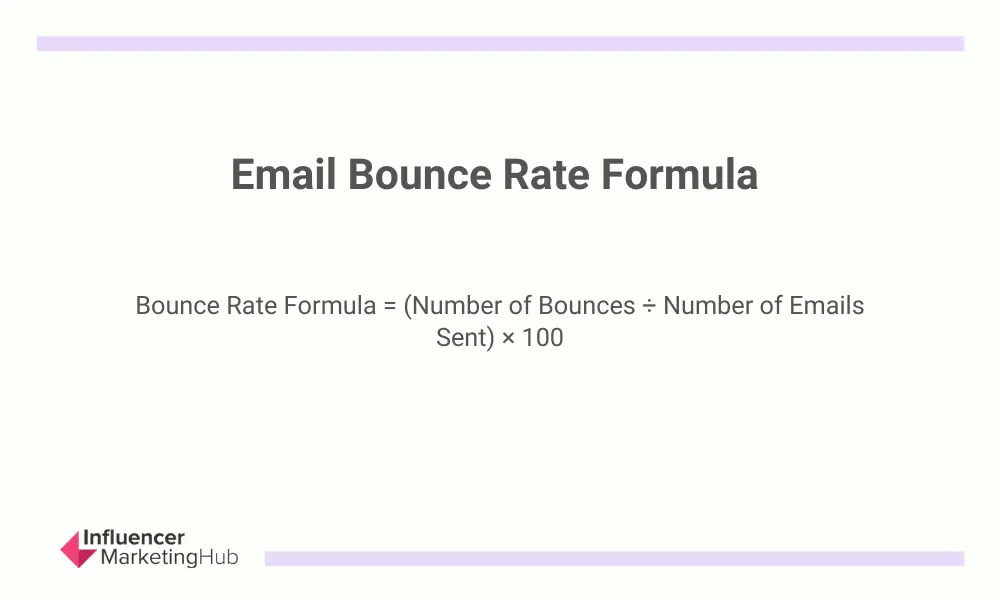
To calculate your email bounce rate, divide the number of undelivered emails by the number of emails sent. Here’s the formula:
If you’re seeing high bounce rates, you’ll want to make sure that your emails aren’t coming off as spam. There are several tools online that can help you determine the spam score of your emails. You’ll also want to make sure that your emails are getting to the right audience. This is another great reason to keep your email list clean.
6. Complaint Rates
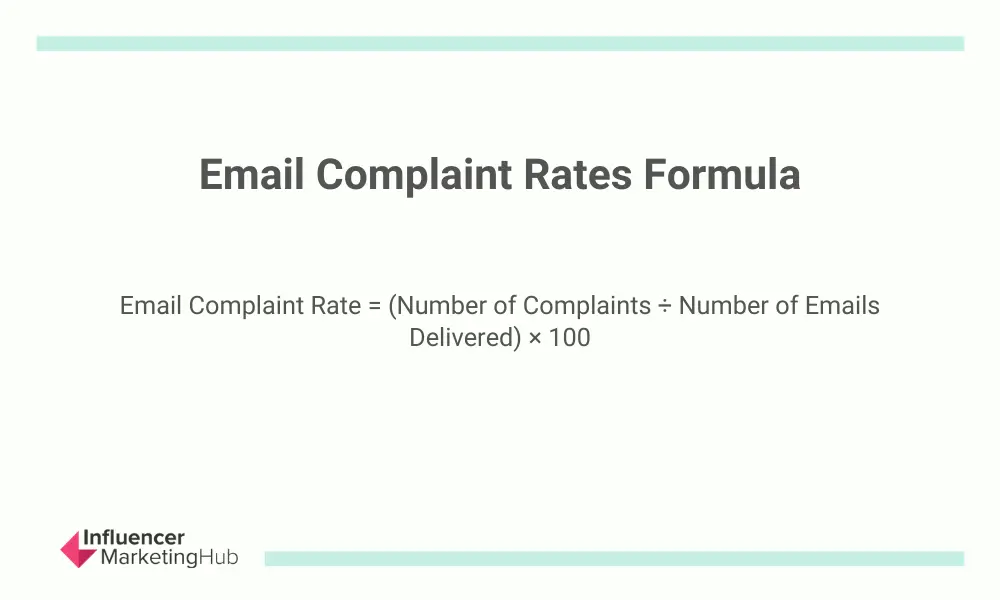
Next up in our guide to email marketing benchmarks is complaint rates. This is the number of emails that your subscribers are reporting as spam. It doesn’t happen often but it’s still important to track and understand. To calculate your complaint rate, divide the number of complaints by the number of emails sent (minus bounces). Here’s the formula:
When you get a large number of complaints, you’re more likely to be marked as spam by some of the big email services like Gmail. If you’re stuck with a “spam” label, it’s going to be very hard to get your content out to your intended recipients, so be sure to track your complaint rates before it’s too late.
7. Engagement Rates
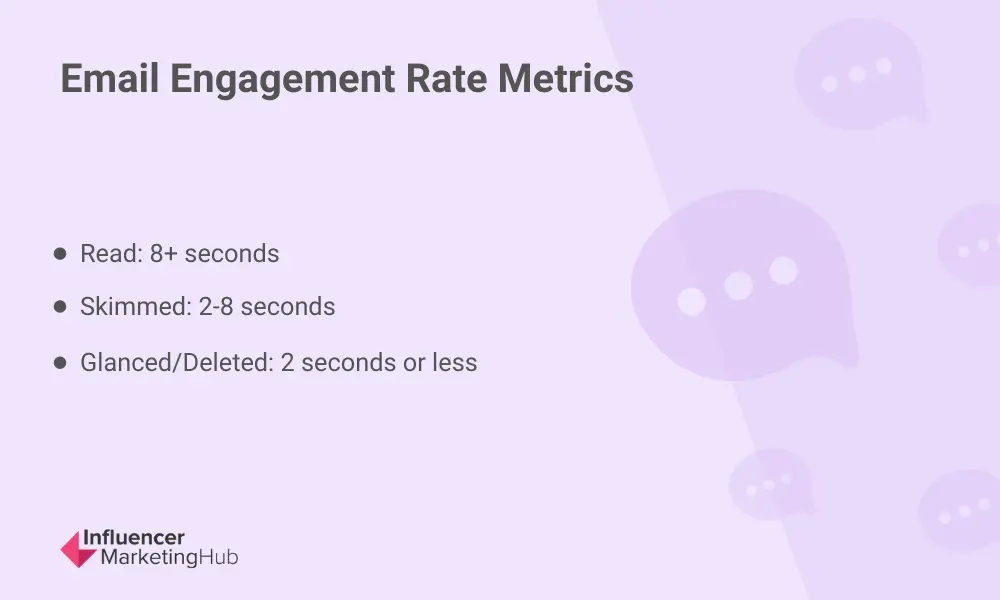
No guide to email marketing benchmarks would be complete without talking about engagement rates. Engagement is how long a reader stays on your email and engages with it and it’s typically described as the combination of three things: read, skimmed, and glanced.
If a reader spends more than eight seconds on your email, that is considered “read.” If they spend from 2–8 seconds on your email, they’ve “skimmed.” And, if a reader spends less than two seconds on your email, it’s considered “glanced.”
As you can probably tell, figuring out your engagement rate gets a bit complicated. It’s best to leave this up to your email marketing service. You should be able to run reports with this information.
8. Reply Rates
Reply rates are probably one of the most overlooked email marketing benchmarks but they’re one of the most important. Your email reply rate is the number of subscribers who respond positively to a certain CTA. So, even if you have a ridiculously high open rate, if your reply rate is low, your emails aren’t going to result in sales.
The average reply rate for B2B businesses is between 5%–6%, according to Vance Plunkett at B2B Data Guy. This isn’t an earth-shattering number but that’s largely due to the fact that some people will click on a link (increasing your click-through rate) without actually replying.
9. Deliverability Rates
The final benchmark in our guide to email marketing benchmarks is all about deliverability. We’ve talked a little bit about deliverability already. Email deliverability is the ability to get your emails into subscribers’ inboxes. Seems a little simplistic but there are several things that can keep your email from reaching its intended target; throttling, spam issues, bounces, ISP problems, and bulk emails can all decrease your deliverability. This is a metric to keep an eye on so you can identify problems before they turn into serious issues.
Use This Guide to Email Marketing Benchmarks to Improve Your Email Marketing
Email marketing benchmarks are extremely helpful in understanding how your email marketing strategies perform and compare to others in your industry. By evaluating your own metrics, you can even gauge your email campaigns’ effectiveness over time and take steps to improve it should things stop performing well.
Want more? Check out these email marketing best practices to make your email marketing even better!
Frequently Asked Questions
What are benchmarks in email marketing?
Email marketing benchmarks are a metric used for businesses and organizations to gauge their email marketing successes over time. Organizations will often use both internal and external benchmarks, along with industry-wide benchmarks, to measure performance.
What is a good open rate for email 2020?
A good open rate for email marketing in 2020 is 18% of opens. The average click-through rate for email marketing is 2.6%.
What is an average open rate for email marketing?
The average email open rate for email marketing is around 21%. Email open rates are the best way to know whether your email strategy is working. The open rate will tell you what percentage of your audience opens and engages with the emails you send them. Email open rates are probably one of the most tracked email marketing benchmarks for email marketers.
What is a good email marketing conversion rate?
A good email marketing conversion rate is around 19%. The average conversion rate peaked in 2018, according to statistics, and reached 18.49%.
Does email marketing really work?
Email marketing is an effective way to market to your customers. One survey found that 42% of those surveyed said the email marketing strategies are effective or very effective.

