
Live streaming has rapidly evolved from a niche form of content into a powerful revenue-generating tool across industries. Due to this, most social media platforms now offer live streaming as one of their features.
As viewers increasingly prefer live content—spending significantly more time on live streams compared to on-demand videos—businesses are recognizing the potential for new revenue streams through live events, product launches, live stream shopping, and interactive experiences.
However, before you can jump into live streaming, you should know which trends and platforms are suitable for this format. In this guide, we take a look at live streaming statistics around live selling, monetizing live streams, viewer preferences, platform efficiency, and more.
- General Live Video Streaming Statistics
- Live Streaming Stats About Gaming
- Live Video Streaming Stats for Marketing
- Live Streaming Platforms Stats
- Live Streaming Content Preferences Stats
- Live Streaming Viewers Stats
- Live Streaming Monetization Stats
- Live Shopping Stats
- Wrapping Things Up
- Frequently Asked Questions
General Live Video Streaming Statistics
Overall live video streaming stats
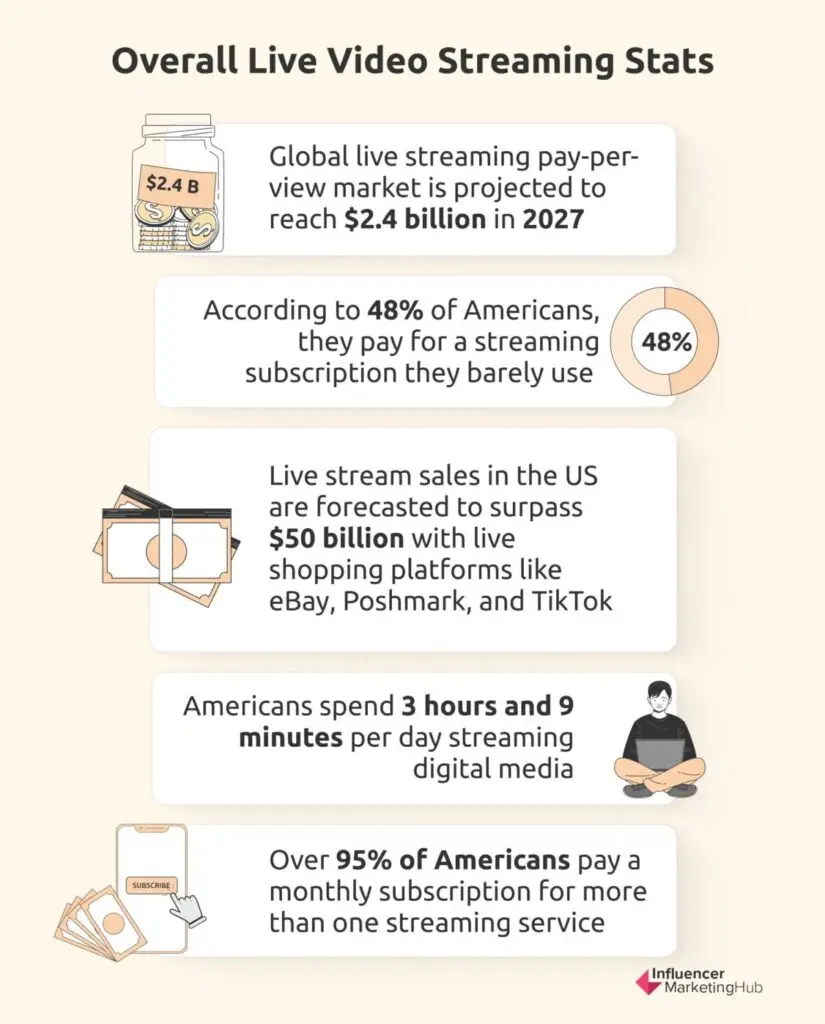
1. In 2023, the global live-streaming market grew to $1.49 billion from 2022’s $1.24 billion. It’s estimated that by 2027, the market will grow to more than $3 billion, indicating a compound annual growth rate of 21.2%. Furthermore, the global live-streaming pay-per-view market is projected to reach $2.4 billion in 2027. One of the industry’s main growth drivers is the increasing adoption of e-learning.

2. Live stream sales in the US are forecasted to surpass $50 billion with live shopping platforms like eBay, Poshmark, and TikTok replicating the success of this shopping format in China.
3. In the US, 18% of people have shopped through live streams. Only 6% of shoppers purchase items via live streams regularly.
4. Over 95% of Americans pay a monthly subscription for more than one streaming service. Nearly half (48.9%) of the respondents pay for 3 streaming services every month.

5. On average, Americans spend 3 hours and 9 minutes per day streaming digital media. That’s about 21 hours every week.
6. About 45% of Americans have canceled a streaming subscription in the past year due to the cost being too high. 44% of Americans have also reported that the cost of their streaming subscription service has increased in the last 12 months.
7. According to 48% of Americans, they pay for a streaming subscription they barely use. This shows that while subscription rates may be high, consumption is comparatively much lower.
8. Compared to social media posts, product pages, and blog posts, people are twice as likely to share video content with their network.
9. According to Wyzowl’s State of Marketing Report 2024, 60% of video marketers quantify success through video engagement, including shares, likes, and reposts, while 42% use customer engagement and retention as a measure for video success. 40% of marketers use video views to measure ROI, whereas 39% use brand awareness and PR.

How video marketers measure success
10. A study published in 2022 found that there are three key factors that affect viewers’ social presence, which, in turn, influence their live streaming watching. These are: a sense of community, interactivity, and emotional support. The study also notes that the streamer’s attractiveness also plays a significant moderating role between the viewers’ social presence and their live streaming watching.
11. Movie or TV streaming services are the most popular digital purchases, made by 31.7% of the respondents to a study. In second place in music streaming with 24.2% of buyers.
12. About a third of internet users have identified live video streams as the type of video content that they watch the most each week. Music videos were the most popular category, with over half of internet users revealing that they watch it online each week.
13. Some of the key players in the live streaming market include AfreecaTV Co. Ltd, Amazon, Facebook Inc., Google LLC, Instagram Inc., Microsoft Corporation, and Twitch Interactive Inc.
14. In 2022, the live streaming segment had the largest revenue share, accounting for approximately 62.28% of the market share. This growth is mainly driven by the increased demand for digital media services and the enhanced accessibility of quicker internet services.
Live Streaming Stats About Gaming
Gaming live streaming statistics
15. It’s estimated that this year, the global gaming live streaming audience will reach the one billion mark. By 2025, it’s projected that this number will grow to 1.4 billion, indicating a CAGR of 16.3% from 2020’s more than 660 million people.
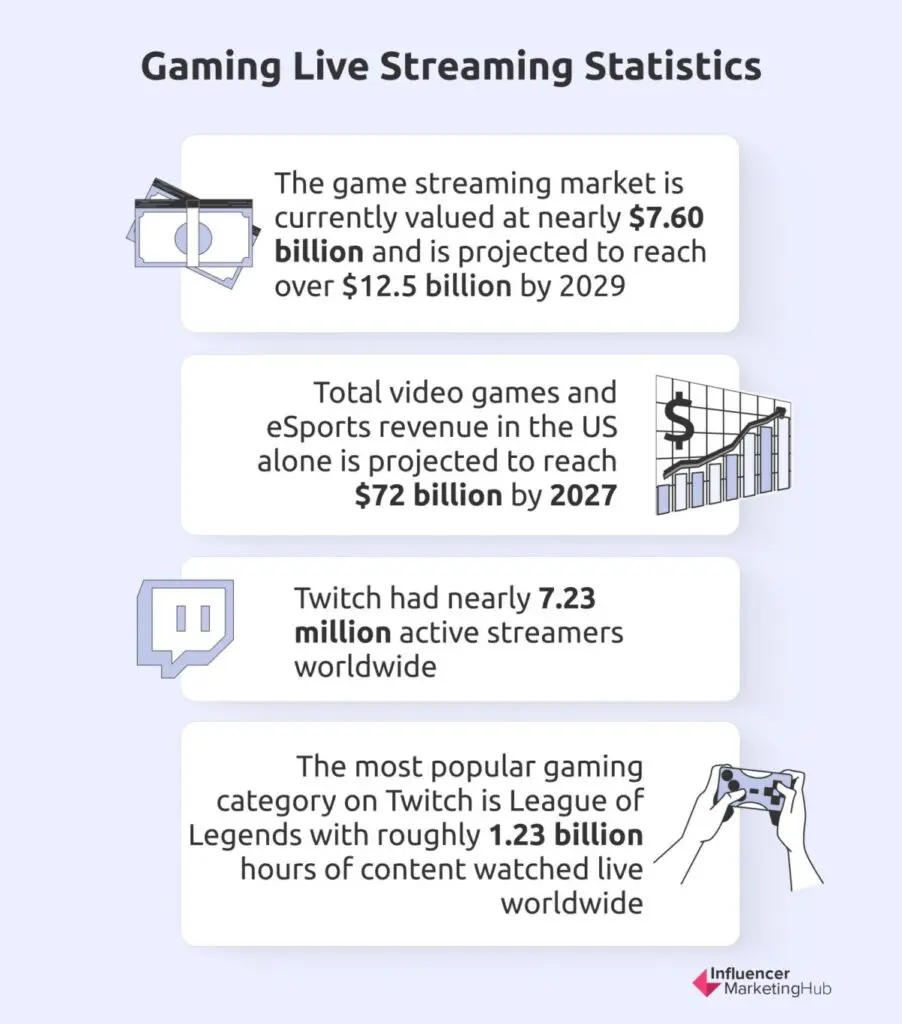
16. The game streaming market is currently valued at nearly $7.60 billion and is projected to reach over $12.5 billion by 2029, indicating a CAGR of 10.52%. Some of the main drivers of the industry’s growth include the increased adoption of video streaming apps and on-demand video content.
17. Total video games and eSports revenue in the US alone is projected to reach $72 billion by 2027, which represents a CAGR of nearly 6%. Key growth drivers include omnichannel consumer experiences and packaging and bundling.
18. In the latest TwitchTracker rankings, Kaicenat generated 16.3 million hours watched and had 721,715 all-time peak viewers in the last 30 days. Kaicenat is followed by Caseoh_, who generated 5.63 million hours watched and had 110,574 all-time peak viewers. Tarik is ranked number three for September 2024, with 4.17 million hours watched and 290,829 all-time peak viewers in the last 30 days.
19. In April 2024, Twitch had nearly 7.23 million active streamers worldwide, helping it retain its position as one of the world’s most popular streaming platforms. Ninja is still the platform’s most followed streamer, with over 19 million Twitch followers.

20. The Asia Pacific region is expected to dominate the game streaming market in the coming years. Key growth drivers of the industry in the region include the popularity of eSports and government initiatives that support the gaming industry’s growth.
21. The most popular gaming category on Twitch is League of Legends with roughly 1.23 billion hours of content watched live worldwide.
22. Summer Game Fest 2024 had over 1.6 million concurrent viewers and garnered almost 3.5 million hours watched, much lower than 4.4 million last year. It had an average viewership of 1.4 million people. The tournament was streamed on Twitch, Facebook, YouTube, and SteamTV.

23. The social and casual gaming category is the largest contributor to the US video games market’s revenue, pulling in over $37 billion in 2022. This number represents nearly 69% of the total revenue for video games and eSports. It’s projected that by 2027, this category will have a revenue of $53.2 billion.
Live Video Streaming Stats for Marketing
Marketing live video streaming stats
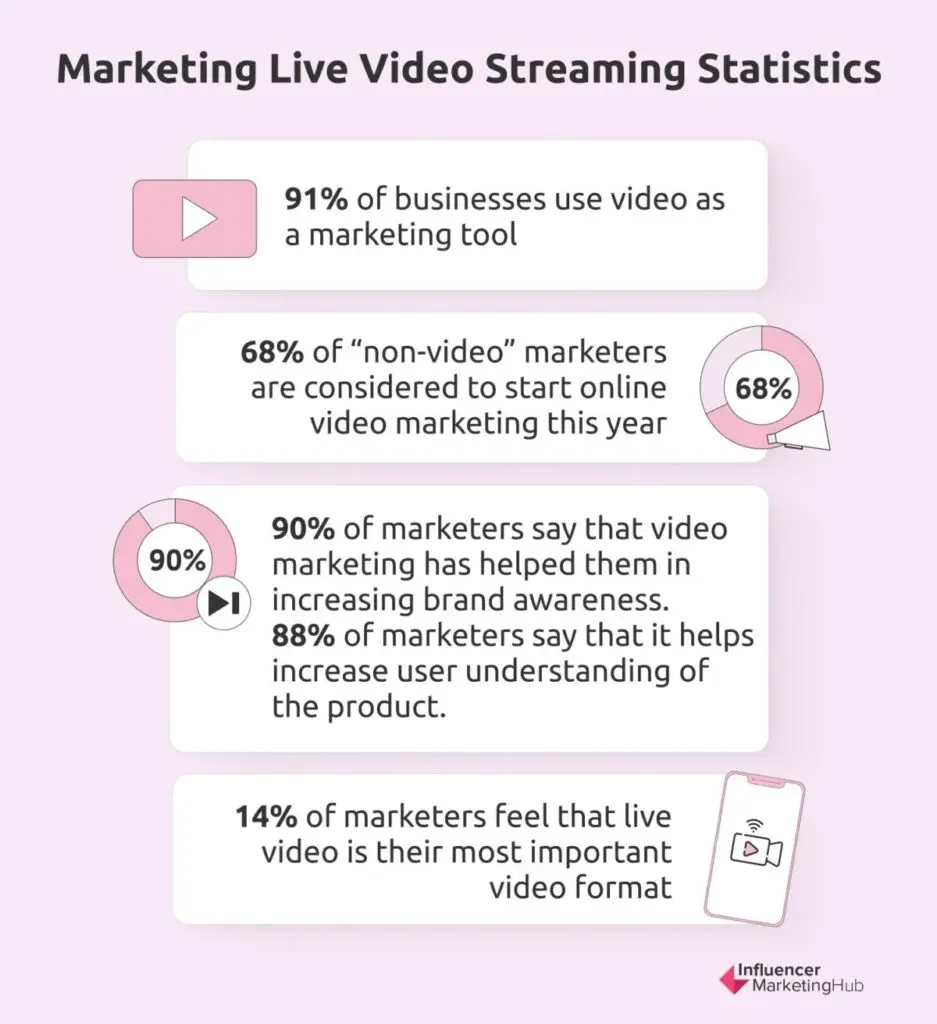
24. Over recent years, increasingly more businesses have started to use video for marketing purposes. In 2024, 91% of businesses use video as a marketing tool, which, according to Wyzowl, is an all-time high since they started tracking this particular data back in 2016. Furthermore, 88% of marketers see video as a crucial component in their marketing strategies.
25. While video marketing is becoming a significant aspect of marketing, there are still some businesses that don’t use video as a marketing tool because of reasons such as not having time to create video content (33%), thinking that creating video content is an expensive endeavor (20%), and not knowing where to start (15%). The good news is that 68% of these so-called “non-video” marketers are considered to start online video marketing this year.
26. While Twitch remains the most popular streaming platform for gaming, it’s also becoming a way for brands to engage with Millennial and Gen Z audiences through non-gaming channels. In 2022, Sports and Music were the two top non-gaming categories, garnering a total of 30 million unique viewers. Moreover, the Sports category grew significantly in 2022, amassing 25% more hours watched compared to 2021.
27. Non-gaming Twitch watch hours reached almost 400 million in 2023, with JustChatting channels, in which streamers interact with their followers, being the most watched. These channels present an opportunity for businesses to run streamer-led sponsorships and ads.
28. Wyzowl reports that most video marketers spend a big chunk of their marketing budget on this vertical. The majority of respondents said that they spend 21% to 30% of their overall budget on video content. On the whole, 6 out of 10 marketers spend anywhere from 11% to 50% on video marketing.
29. Wyzowl further found that, in 2024, 39% of video marketers created video testimonials, followed by 38% who created explainer videos. 34% created social media and presentation videos, while 32% made product demo videos.
30. The same report revealed that while 82% of people have bought a product or service after watching a video, 77% have downloaded an app after being convinced by a video.
31. Wyzowl also found that, in 2024, 89% of customers want brands to create more videos, indicating the preferences of audiences for video content over written or audio content.
32. Video plays a big role in creating a huge impact on key marketing metrics. For instance, 90% of marketers say that video marketing has helped them in increasing brand awareness. 88% of marketers say that it helps increase user understanding of the product.
33. According to 93% of marketers, video is an important part of their strategy.
34. The main objective for video marketing is lead generation and driving sales, cited by 38% of marketers. Similarly, 31% of marketers use video for product education and adoption, 17% use it for brand awareness and PR, and 8% use it for social media engagement.
35. Small businesses make 15 videos per year on average, medium businesses make 84 videos, while large businesses make 118 videos. That means small businesses make 1 video every 24 days, compared to medium businesses that make a video every 4 days, and large businesses that make a video every 3 days.
36. Organic video marketing is making waves in 2023, with 63% of marketers planning to learn more about organic video marketing on YouTube and 59% of marketers planning to utilize YouTube videos more.
37. Webinar is one of the most effective video channels, statistically speaking. 61% of marketers who hosted a webinar said that it was effective, making it the video marketing channel that received the biggest praise.
38. Only 14% of marketers feel that live video is their most important video format. Native video is by far the most popular.
39. Most marketers plan on using Instagram videos more in the future, followed by Facebook and YouTube. Instagram and Facebook are the video platforms marketers want to learn more about.
40. Unlike B2C marketers, the majority of B2B marketers want to find out more about LinkedIn videos.
41. Businesses are growing their efforts to make videos more accessible. While 41% of businesses add annotations and CTAs to their videos, 27% include closed captions and a transcript, while 9% allow viewers to change the player controls and colors.

42. Digital video ad spend reached $63 billion in 2024, indicating a 20% YoY increase. It is forecasted to increase by 16% in 2024. The largest spenders in this industry are social video (70%) and Connected TV (69%), which are must-buys because they deliver desirable performance outcomes for brands at the top and bottom of the funnel.
Live Streaming Platforms Stats
Twitch Statistics
43. In Q1 2024, the Twitch app generated around 15.24 million downloads worldwide.
 44. Twitch increased its market share (in terms of global daily active users) by 10% in a year. It increased from 63% at the beginning of 2020 to 74% at the beginning of 2021, which it managed to maintain in 2022.
45. Twitch has the most unique streaming channels. As of Q3 2022, it had nearly 10 million unique channels. To put this massive accomplishment into perspective, YouTube Gaming has 443,000, while Facebook Gaming has only 238,000.

46. Just Chatting remains one of the most watched categories on Twitch. In July 2023, the category accumulated nearly 281.6 million Hours Watched, which shows a 15% increase compared to June 2023. Other popular categories during the same period include Grand Theft Auto V, League of Legends, and Valorant.
47. Of the non-gaming categories on Twitch, Just Chatting makes up 74.2%, followed by sports with 6.5%. Other categories include music, special events, and ASMR.

Share of non-gaming categories on Twitch
48. As the data indicated in March 2024, approximately 63% of the adult user base on Twitch in the United States was composed of males, suggesting a prominent gender skew towards men in the platform's demographic makeup.
49. In 2024, the duration of Twitch live streams saw an increase compared to 2023. Streamers with an audience between 10,000 and 50,000 increased the stream duration by 15%, while smaller streamers increased the stream length by 20%. In comparison, streamers with more than 50,000 followers saw a decrease of 3.75 hours in 2024.
50. Big accounts with 10,000 to 50,000 subscribers streamed 8 times per week in 2023. Accounts with 2,000 to 10,000 subscribers halved the number of times they stream per week.
51. In 2024, audiences around the world streamed 54 million hours of Twitch content.
YouTube Live Statistics
52. 37% of US live stream viewers aged 18 to 34 used YouTube Live to watch live stream video content. In comparison, 39% of those aged between 35 and 54 watch live stream content on the platform.

Platforms used to watch live content
53. YouTube Gaming recorded just over 1.1 billion hours of content watched in Q3 2022. While this sounds like a lot, it shows a 4% decrease compared to the same period in 2021 was more than 13% lower than what it managed to generate for the same period in 2021.
54. Not only are people watching less live streaming via YouTube, but gamers are also streaming less. Since the end of 2021, the number of hours streamed on YouTube Gaming Live has declined steadily to reach just over 8 million hours in Q3 2022. For the same period in 2020, it was a whopping 17.9 million hours.
55. YouTube Gaming streams grew by 13% during Q1 2023, accounting for 17% of YouTube Live’s total Hours Watched.
56. Because they offer live television options, Hulu and YouTube TV have become more popular with sports enthusiasts.
57. Brands that use multiple video formats on YouTube, such as live streams and short-form videos, are likely to make more impact when it comes to ad recall and brand awareness. That’s because 90% of people watch content from creators or artists across different video formats.
Facebook Live Statistics
58. In Q3 2022, nearly 8 million hours of online games were streamed via Facebook Gaming.
59. Nearly 19% of the videos brands post on Facebook are live videos. In comparison, 81.1% of brand videos are pre-recorded.
60. In Southeast Asia, Thailand is the country with the highest use of Facebook Live for selling, followed by Vietnam and the Philippines.
TikTok Live Statistics
61. TikTok reports that 1 in 5 live streaming users on the platform watch TikTok Live. Of this group, 62% watch it every day. This means brands have an opportunity to get in touch with their audiences real time every day.
62. On TikTok, audiences are 1.6x more likely to watch live content from brands, and 1.7x more likely to watch live branded content to buy products.
63. TikTok audiences are only 2x more likely to say that live streams are the most trustworthy source of shopping on the platform.
64. Audiences are interested in a wide range of live content from brands on TikTok. 80% of people want to see how-to videos and tutorials, 78% want to see product releases, and 77% are interested in in-depth product reviews. Meanwhile, 72% of people want to watch product sales, while the same percentage are interested in live events.
65. 77% of TikTok users say that branded lives pique the most interest when run by creators while 72% feel the same about celebrity-run lives.
Other Platforms
66. In 2022, the number of daily video views on Twitter grew by 13%. Furthermore, 61% of social media users flock to Twitter to watch video content because the platform offers variety.
67. Between 2020 and 2021, the video watch time on Twitter went up by 30%.
68. Sony LIV is the most downloaded video streaming mobile app. In July 2024, it had about 15.6 million downloads. Netflix was in second place with just over 14 million downloads.

Live Streaming Content Preferences Stats
69. Almost 50% of consumers pay for streaming services without ads. People don’t want the disruption of ads in their entertainment process. In comparison, only 24.3% of consumers opt for ad-supported options, likely due to a lower price point.

Consumer streaming platform preference
70. While 68% of consumers pay for the cost of streaming services entirely on their own, 30% split them with friends and family.
71. If subscription prices increase, most people say they are likely to drop Disney+. Meanwhile, 40% of consumers say they will cancel Hulu while 35% say they will drop ESPN+. Then comes Netflix with 33% of consumers willing to drop it in the face of a subscription price hike.
72. Netflix is the most enjoyed streaming service, cited by 36% of consumers. Amazon Prime is in second place, selected by 14% of consumers as the most enjoyable streaming service for them due to its user interface.
73. Netflix’s live streaming is also gaining traction in the entertainment space. The streaming service has struck a $5 billion deal with WWE to live stream its show RAW on the platform from 2025. Since its launch in 2023, Netflix Live Events has done quite well. In fact, one of the first comedy live streams on the platform, Chris Rock: Selective Outrage, garnered a viewership of 798 million minutes on its opening weekend.
Live Streaming Viewers Stats
74. During Q3 2022, users amassed more than 7 billion hours of content watched. Furthermore, over 52% of global users are interested in consuming live branded content.
75. Video live streams are the third most popular content type, watched by over 27% of video viewers globally.
76. Global streaming viewing time continues to grow, with Asia (90%) and LATAM (70%) showing the largest growth. In North America, viewing increased by 5%.
77. Cheaper Android devices are the preferred streaming devices for markets outside of North America. That said, iPhones still lead the global race.
Live Streaming Monetization Stats
78. Live streams are quickly becoming a viable income source for content creators. For instance, streamers make money from sponsored videos on TikToK, live shopping on Instagram, and brand deals on Amazon Live. Depending on the platform and viewership, some creators can earn between $20 and $300 per live video on TikTok, while others have amassed thousands of dollars by live streaming on YouTube.
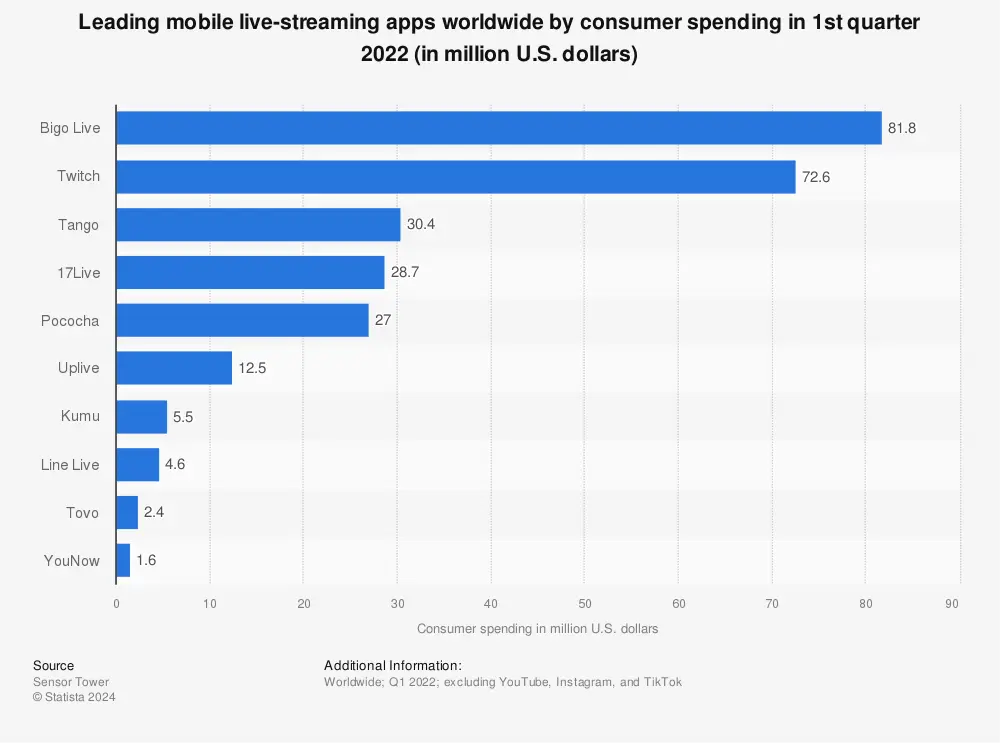
79. While Twitch might have the market share, Bigo Live leads the way in consumer spending. As of the beginning of 2022, Bigo Live generated almost $82 million in consumer spending, making it the highest-grossing mobile live streaming app. Twitch managed to generate “only” $72.6 million, placing it in second spot.
80. Twitch streamers who have around 10 views per day can earn between $50 and $100 monthly. However, popular creators can potentially earn millions annually. That’s on top of any additional income they earn from other contracts.
81. There are many ways that Twitch influencers can earn money on the platform. These include brand deals or sponsorships, donations, subscriptions, and Twitch bits, which is the platform’s virtual currency. In addition to these channels, Twitch streamers can also earn additional income through merchandise sales and ad revenue. However, when it comes to ad revenue, monetization is currently limited to affiliates and partners.
82. Younger streamers are having an easier time making money from live streaming. About 44% live streamers aged between 18 and 34 have revealed that they generated money via live streams, compared to over 79% of older streamers (55+ years old) who weren’t able to monetize their live content. Meanwhile, in general, 53% of live streamers weren’t able to generate revenue.
83. The global eSports market is projected to grow bigger in the coming years, growing as much as $1.87 billion by 2025, with China taking up almost one-fifth of the market share. In 2022, eSports and games streaming sales in China amassed nearly $320 million. By 2033, it’s projected to reach a valuation of $7.725 million.

84. The Southeast Asian eSport industry’s revenue is expected to exceed $64 million by 2027.
85. Douyu, a Chinese game-centric live streaming platform, made more or less 5 billion yuan via its live streaming business in 2022. Its live streaming revenue, which included ad services and virtual gift sales, accounted for more than 87% of its annual revenue.
86. The music streaming market is projected to be valued at approximately $120 billion by 2032. Key growth drivers include the growing popularity of streaming apps, live entertainment trends, access to high-speed internet, and the increased consumption of live music video content.
Live Shopping Stats
87. By 2032, the live ecommerce market is expected to reach $3532 billion. Key growth drivers include increased access to the internet and smartphones.
88. China is considered to have the most mature live commerce market. 57% of live commerce users have used this particular shopping format for more than three years, compared to 5-7% in regions like Europe and the US. The country also has the most live shopping attendees, clocking in at 87%. In the country, the most popular live commerce categories among live commerce users are groceries (54%), clothing (45%), footwear (33%), skincare (30%), and haircare (26%).
89. The add-to-cart conversion rate for live shopping events is 34%. Live shopping purchases also have a growth rate of 76%.
90. It’s estimated that live streaming e-commerce will account for nearly 19.2% of China’s retail e-commerce sales in 2024. According to an eMarketer forecast, total e-commerce sales in the country will jump to nearly $844 billion from $562.62 billion.
91. The live shopping market in China is already profitable, with projections indicating that approximately 42.1% of the country's digital shoppers, equating to 320 million individuals, are expected to make purchases through livestreams in 2023. Moreover, it’s estimated that this year, China will have 373.7 million digital buyers who will make purchases through live stream video content.
92. In 2022, the fashion category topped the chart as the most frequently bought product type by live shoppers in the United States. A survey revealed that approximately one-fourth (26 percent) of users admitted to purchasing clothing and apparel while on a livestream. The personal and beauty care category came in close second, with it being the choice of purchase for 22 percent of the respondents.
93. A 2022 survey found that over a third of U.S. shoppers were aware of live streaming shopping events, yet only 20% participated. Despite identical awareness levels, Denmark saw slightly more engagement, with 24% participation.
94. The 2022 survey identified the top global benefits of livestream shopping as exclusive discounts and inspiration, with 31% of respondents also noting it facilitated smarter, more informed purchases.
95. Facebook led the pack as the preferred social media platform for live streaming shopping in 2022, capturing the attention of nearly 58 percent of global internet users. Instagram secured the second spot with 46 percent of users, while TikTok trailed in third with close to 16 percent of respondents.
96. Besides preference, the same trend is also seen in social commerce shopper experience. In 2023, 23% of consumers said that Facebook offers the best live stream shopping experience, followed by Instagram, selected by 18%.
97. In 2023, Gen Z reported discounts and sources of ideas to be the primary benefit of live shopping. Additionally, more than 30% of Gen Z shoppers said that real-time engagement provides a more interactive shopping experience, which is a notable advantage of live shopping.
98. 3 out of 10 millennials reported watching a livestream shopping event in the week before a survey.
99. The top three countries where social media viewers watch live streams are in Asia. Indonesia is in first place, followed by Vietnam and China.
100. A 2023 survey found that 8 out of 10 Chinese shoppers are familiar with live commerce. India is in second place with 75% of respondents having used live stream shopping in the past. In contrast, shoppers in European countries aren’t very familiar with this format, with only 25% of French shoppers using it.
Wrapping Things Up
While these statistics clearly show that you can reach a wide audience with live streaming, there’s still a lot of critical work that needs to happen behind the scenes and on screen. You can’t just sit back and stream.
One of the main reasons why live streaming is so popular is because of the interaction. Your viewers will want to feel connected to you. So, you’ll need to be willing to interact with your viewers. Just like with any type of content, your live stream also needs to be engaging. Speaking of connection, you’ll also need to make sure that your ethernet connection is fast and reliable. Get these two main challenges right, and you’ll be able to generate a steady stream of income with live streaming.
Frequently Asked Questions
What types of content are popular for live streaming?
The following types of content are most popular for live streaming:
- Online gaming
- Sporting events
- Video game tournaments and gameplay streams
- Educational or instructional content, such as online classes or tutorials
- Q&A sessions with celebrities or experts
How can businesses leverage live streaming for growth?
Businesses can use live streaming as a powerful tool for growth in the following ways:
- Hosting product launches or demonstrations
- Hosting live selling events on social media
- Conducting virtual events
- Providing behind-the-scenes access to company operations
- Collaborating with influencers or industry experts for brand promotion
How can creators monetize their live streams?
Every platform has its own monetization options for live streaming. For example, on Twitch, creators can earn money through subscriptions, donations, and ad revenue. Similarly, YouTube allows creators to monetize their live streams with advertisements, Super Chat donations, and channel memberships. Creators on TikTok Live can also accept virtual gifts from viewers. Additionally, creators can also use live streams to promote their merchandise or services.
What are the most popular platforms for live streaming in 2024?
Some of the most popular platforms for live streaming are Twitch, YouTube Live, Facebook Live, Instagram Live, TikTok Live, Twitter, LinkedIn Live, and Livestream by Vimeo.
SUGGESTED
What is Live Streaming ?
Live streaming is a social media feature on platforms like Facebook and Instagram that...

Live Streaming Demands More Than Linear TV
58% of ad buyers expect advanced features—like real‑time targeting shoppable overlays...

Livestreaming Industry Shifts: TikTok Live Now Second Only to YouTube
TikTok Live now ranks second in total watch hours surpassing Twitch. With mobile-focused...