We are exposed to between 100-500 ads daily (and no, it's not 10.000 as many claim)... Yet, we do not remember most of those ads.
We’ve surveyed over 900+ marketers—not to ask the tired old “What’s your ROI?” kind of questions, but to dig into what really moves the needle.
Written by marketers, for marketers, this is your guide to what’s next—the unspoken challenges, the bold opportunities, and the strategies that will define 2025 and beyond. Welcome to a marketing revolution. Are you ready?
10 Core Highlights for the Social Media Benchmark Report
- Ad Fatigue is Reaching New Heights
72% of surveyed marketers agree that audiences are not just ignoring ads but actively rejecting transactional marketing. Consumers are shifting expectations toward authentic storytelling and value-driven content. - Short-Form Video Dominates Engagement
45.8% of marketers report short-form videos, such as TikTok and Instagram Reels, as the most engaging content format. These formats resonate especially with Gen Z and Millennials, driving rapid audience growth. - Zero-Click Strategies are Reshaping Conversion Tactics
41% of respondents report marginal increases in conversions using zero-click strategies, while 30.1% saw significant improvement. Platforms like TikTok Shopping and Instagram Checkout are leading this shift. - AI is Transforming Social Media Marketing
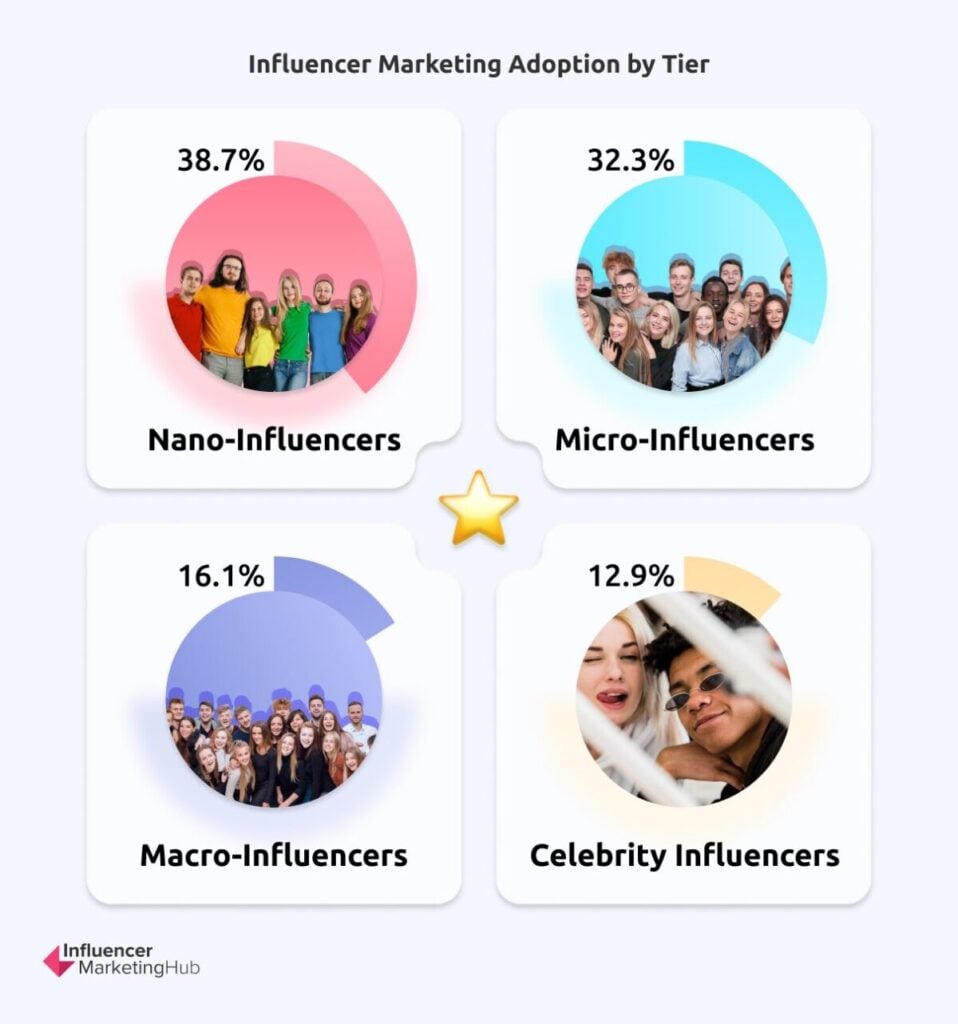
60.4% of respondents have integrated AI-driven personalization and automation into their strategies. Of these, 58.6% find AI "very effective" in improving engagement, especially for predictive trend analysis and content optimization. - Nano- and Micro-Influencers Lead the Pack
38.7% of marketers prioritize nano-influencers (1-10K followers), while 32.3% leverage micro-influencers (10-100K followers). These influencers deliver superior engagement rates at a fraction of the cost of macro-influencers and celebrities. - The Cookie Apocalypse Forces a Return to Basics
With the decline of third-party cookies, 57% of marketers are turning to first-party data strategies like email lists, loyalty programs, and direct engagement. Transparency and trust are now critical for data collection. - Rising Ad Costs Strain Budgets
34.3% of respondents identify increasing ad costs as their top challenge, particularly on platforms like Facebook and TikTok. Hyper-targeted campaigns and audience segmentation are emerging as solutions to maximize ROI. - Influencer Marketing is Becoming Strategic
64.6% of respondents actively use influencer marketing, with a growing focus on long-term partnerships. 56% of these campaigns aim to generate user-generated content, while direct sales account for only 23%. - Community-Driven Marketing is Essential for Loyalty
45.2% of marketers rated community-driven efforts, like Facebook Groups or Discord, as "very effective" in fostering loyalty and driving repeat engagement. Interactive formats like Q&As and contests further amplify these efforts. - Budget Increases Reflect Social Media Confidence
44.8% of respondents plan significant increases in their 2025 social media budgets, driven by rising investments in social commerce, AI-driven tools, and zero-click strategies to maintain a competitive edge.
8 Core Trends - Editing team picks:
Let’s peel back the layers and get to the real state of social media marketing in 2025. This isn’t the story you’ll find in glossy reports or platform-sponsored whitepapers. It’s the untold challenges marketers face when chasing relevance in an era where attention is fragmented, trust is eroding, and creativity often gets drowned in the noise of optimization.
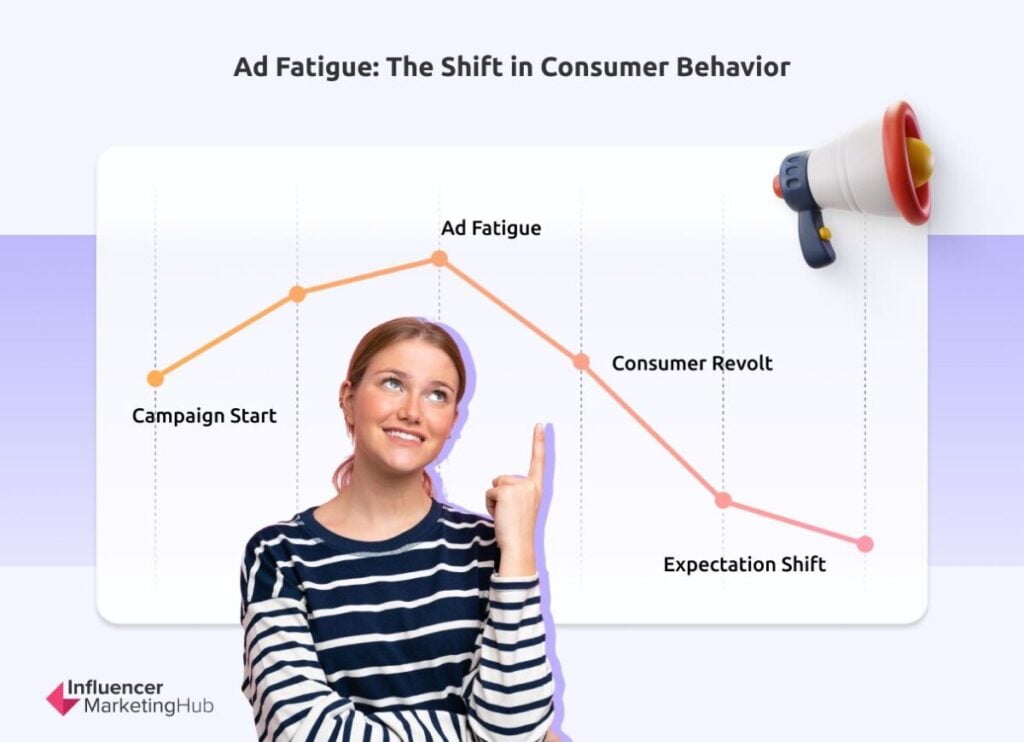
1. Ad fatigue is on the rise, like never before
We’ve spent years treating consumers like conversion machines, optimizing every touchpoint to squeeze out the next click, the next lead, the next sale. But here’s the truth: consumers are no longer just ignoring ads; they’re rejecting the entire premise of transactional marketing. Today’s audiences don’t want to be targeted—they want to be understood. They aren’t just ad-blocking; they’re expectation-shifting.
The rise of social activism, ethical alignment, and authentic storytelling isn’t a trend; it’s a consumer revolt. Users are demanding1 substance over style, depth over flash. Gen Z and Millennials want brands to show up not just as advertisers but as contributors to the culture, communities, and causes they care about. Superficial ads with catchy jingles and slick visuals? Dead on arrival.
2. Algorithms Have Outpaced Humanity
Every marketer loves to talk about beating the algorithm, but let’s be honest: the algorithm has already won. AI-driven feeds are dictating what audiences see, when they see it, and how they interact with it. For brands, this means fighting a losing battle for organic visibility and paying for every inch of digital real estate. But here’s the twist: the real challenge isn’t visibility—it’s relevance.
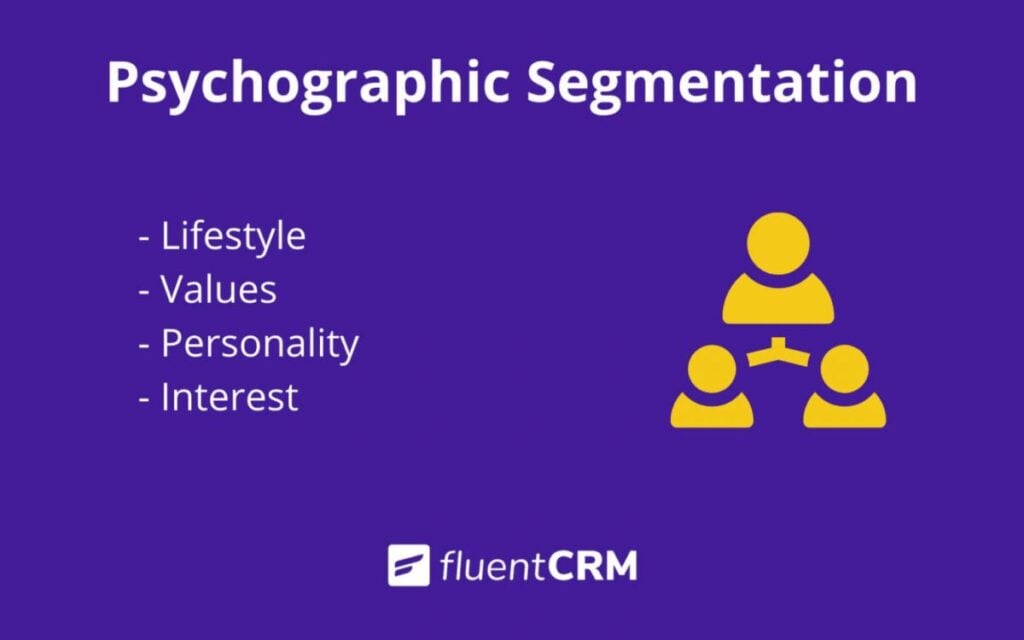
In 2025, the most successful brands won’t just be optimizing for algorithms; they’ll be optimizing for psychographics. They’ll use AI not just to predict what their audience will like but to understand why their audience likes it. The future of social media isn’t about playing the algorithm’s game better—it’s about creating content so deeply resonant that audiences will seek it out, algorithms be damned.
Source: fluentcrm.com
3. The Death of the Funnel: Enter the Buyer Maze
Forget the clean, linear journey of awareness, consideration, and conversion. Social media has turned the buyer’s journey into a chaotic, nonlinear maze. A user might discover a brand on TikTok, engage with it on Instagram, compare products on YouTube, and make a purchase after reading reviews on Pinterest—all in the span of 48 hours. Or they might interact with your content ten times before ghosting you entirely.
The brands that win in 2025 are those that embrace omnichannel storytelling and adapt to this messy reality. They’ll understand that every piece of content, on every platform, must not only serve its specific audience but also contribute to a cohesive narrative across the ecosystem. It’s no longer about guiding the customer—it’s about being where the customer is, consistently and authentically.
Multichannel Ecommerce or Omnichannel Ecommerce, which one is the right match for you? 📌
let's find out here: https://t.co/JNHon5vur6. pic.twitter.com/je3kil0u9c
— Semrush (@semrush) December 8, 2023
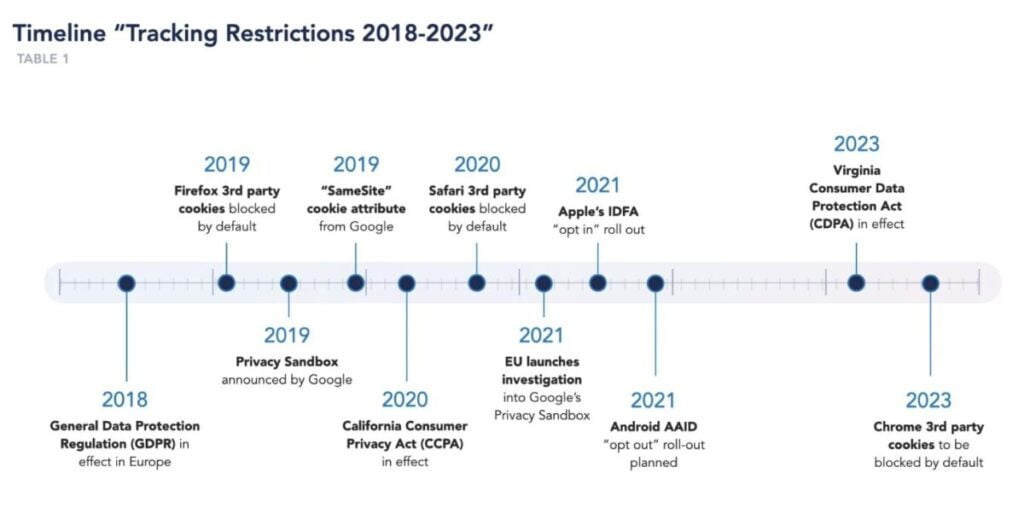
4. The Cookie Apocalypse: A Blessing in Disguise
The death of third-party cookies has sent shockwaves through the industry, but the real story is how it’s forcing marketers to go back to basics. Without the crutch of hyper-targeted ads, brands are rediscovering the power of first-party data and direct connections. Social media Influencers, email newsletters, and loyalty programs have never been more valuable.
But here’s the catch: first-party data is only as good as the trust you’ve built to earn it. In a world where users are skeptical of how their data is being used, brands need to prioritize transparency and reciprocity. Tell your audience what you’re collecting, why you’re collecting it, and what they get in return. If you’re not building trust, you’re not building anything.
Source: arcalea.com
5. Influencers Are the New Creators-in-Chief
Influencer marketing has grown up. It’s no longer about celebrity endorsements or massive followings—it’s about finding influencers who are true cultural translators. These are the creators who can decode the psychographics of their niche audiences, crafting narratives that resonate on a deeply emotional level.
In 2025, the most forward-thinking brands are co-creating with influencers, not just paying them to post. They’re treating influencers as strategic partners, involving them in campaign planning, content creation, and even product development. The old model of "pay-per-post" is giving way to long-term partnerships that build trust and credibility over time.
6. AI Is Automating Everything—But Creativity Is the Differentiator
Yes, AI can write your captions, generate your hashtags, and analyze your metrics. But here’s the truth: automation can’t replace inspiration. In a sea of AI-generated content, human creativity will be the ultimate differentiator. Brands that stand out in 2025 will be those that use AI to amplify their creativity, not replace it.
AI can free up time and resources, but it’s up to marketers to create bold, provocative, and emotionally resonant content that connects with audiences on a human level. Automation is the tool; creativity is the strategy.
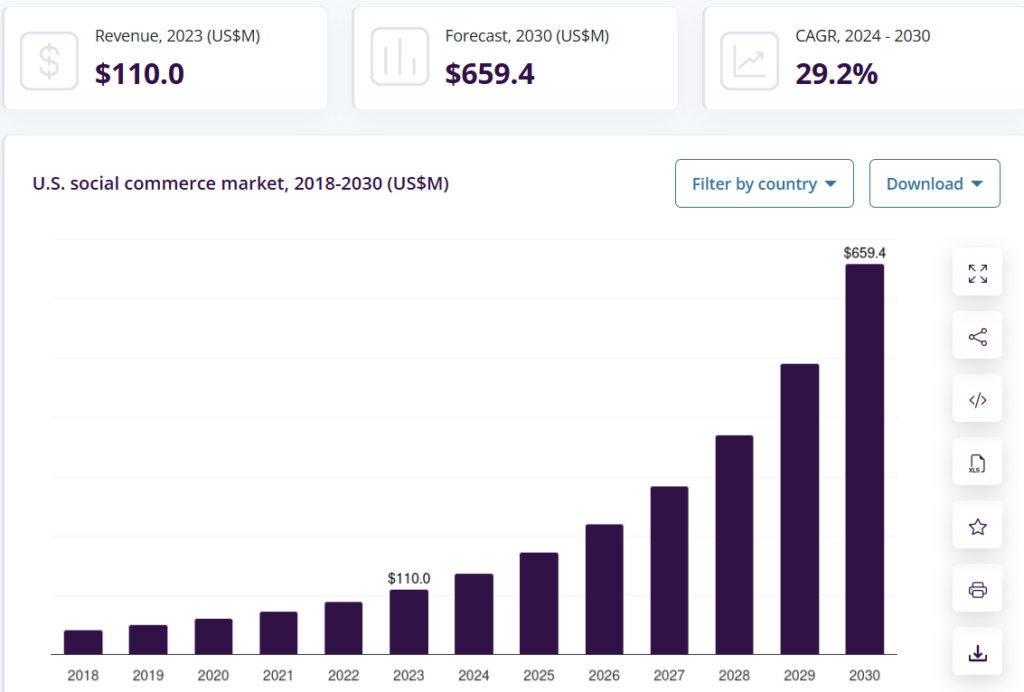
7. The Quiet Crisis of Social Commerce
Social commerce was supposed to be the next big thing, but it’s hitting some serious roadblocks. Users don’t trust platforms with their wallets, they’re wary of spammy sellers, and the buying experience often feels clunky and impersonal. The promise of seamless shopping has been overshadowed by the reality of poor execution.
The solution? Closed-loop ecosystems. Platforms like TikTok and Instagram are starting to nail the integration of discovery, purchase, and post-purchase engagement—all without users leaving the app. In 2025, the brands that thrive in social commerce will be those that master trust-building and experience design, creating a frictionless journey from interest to checkout.
Source: grandviewresearch.com
8. The Unspoken Reality: Marketing Fatigue
Here’s a truth no one wants to admit: marketers are just as fatigued as their audiences. The constant churn of content, the pressure to perform, and the relentless pace of change are taking their toll. In 2025, the most successful marketing teams will be those that prioritize sustainability over scale. They’ll focus on doing fewer things better, creating campaigns with depth and staying power instead of chasing every trend.
The future of social media marketing isn’t about more—it’s about better. It’s about stepping back, reevaluating what matters, and building strategies that prioritize quality, authenticity, and long-term impact.
So Where Does That Leave Us?
The state of social media marketing in 2025 is at a crossroads. It’s a time of reckoning for brands that have relied on superficial tactics and a time of opportunity for those willing to dig deeper. The brands that will thrive are those that embrace authenticity over vanity metrics, creativity over complacency, and connection over conversion.
Because in the end, marketing isn’t just about reaching people—it’s about resonating with them. And that’s a challenge no algorithm can solve.
Survey Audience
Insights from our first-party data reveal that Retail and E-commerce lead in social media adoption, representing 24% of survey respondents. This sector heavily utilizes social platforms for consumer engagement and direct sales, driven by features like shoppable posts and live shopping.
Media and Entertainment accounts for 14.6% of respondents, reflecting the growing importance of video content and live streaming. Other notable sectors include Education and Training (12.5%) and B2B and Professional Services (9.4%), both leveraging social media for thought leadership and lead generation.
Small businesses (1-10 employees) dominated the survey, comprising 66.7% of respondents, showcasing their reliance on cost-effective platforms like Instagram and TikTok. Mid-sized companies (11-50 employees, 13.5%) and large enterprises (over 1,000 employees, 7.3%) also have a strong presence, with larger firms utilizing advanced tools for personalization and data-driven campaigns.
Social Media Marketing Budgets
Social media budgets serve as a barometer for businesses’ confidence in digital platforms. Understanding how companies allocate their funds reveals evolving priorities and challenges in an increasingly competitive digital landscape.
Current Budget Allocation
Social media marketing budgets reveal a complex landscape, reflecting varying levels of commitment across industries and business sizes. According to our survey, 46.9% of companies allocate less than 10% of their total marketing budgets to social media, signaling a cautious approach, particularly among smaller businesses. Limited resources often drive these companies to prioritize low-cost, high-impact strategies, such as organic content and community engagement.
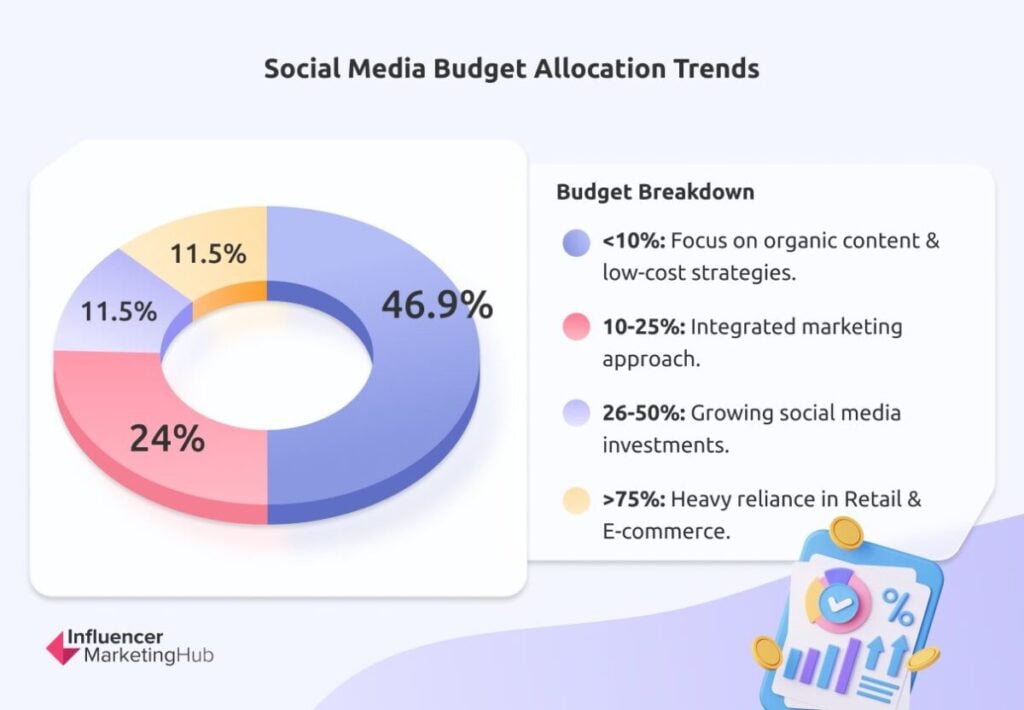
In contrast, 24% of respondents invest between 10-25% of their budgets, indicating moderate reliance on social media as part of an integrated marketing approach.
Meanwhile, 11.5% of businesses allocate 26-50% of their budgets, and an equal percentage commits over 75%, highlighting industries where social media is indispensable. For sectors like Retail and E-commerce, this higher allocation aligns with their dependence on features like shoppable posts, live shopping, and direct consumer engagement.
Year-over-year comparisons from the 2024 Benchmark Report suggest polarization in budget trends. Previously, a larger percentage of businesses fell into the 10-25% allocation bracket. However, as some companies scale their social media investments to leverage advanced tools and trends, others maintain minimal spending, reflecting varying strategic priorities.
For example, a small local bakery might allocate under 10% of its marketing budget to social media, focusing on Instagram Stories to engage local customers, while a global fashion retailer dedicates over 75% to leveraging TikTok influencers and shoppable posts for broader reach.
Budget Trends: 2024 vs. 2023
Budget trends over the past year demonstrate a cautiously optimistic trajectory. Survey responses indicate:
- 28.1% of companies maintained their budgets at 2023 levels, reflecting stability amid broader economic uncertainty.
- Another 28.1% increased their budgets moderately (10-25%), signaling a steady belief in social media’s ROI potential.
- Notably, 24% reported a significant budget increase (over 25%), illustrating growing confidence in social media’s effectiveness in driving business outcomes.
While 10.4% of respondents decreased their budgets moderately, and 9.4% experienced significant cuts, these figures remain lower than anticipated, given ongoing financial challenges across sectors. This suggests that businesses increasingly view social media as a non-negotiable investment rather than a discretionary expense.
The shifts observed in 2024 reflect not only immediate adjustments to economic conditions but also a forward-looking perspective as businesses prepare for the rapidly changing social media environment in 2025.
Future Budget Projections for 2025
Looking ahead, the data suggests sustained optimism and a commitment to scaling social media investments:
- 44.8% of respondents expect significant budget increases in 2025, driven by the expanding role of social commerce and AI-driven personalization.
- 32.3% predict slight increases, while only 7.3% foresee any form of budget reduction.
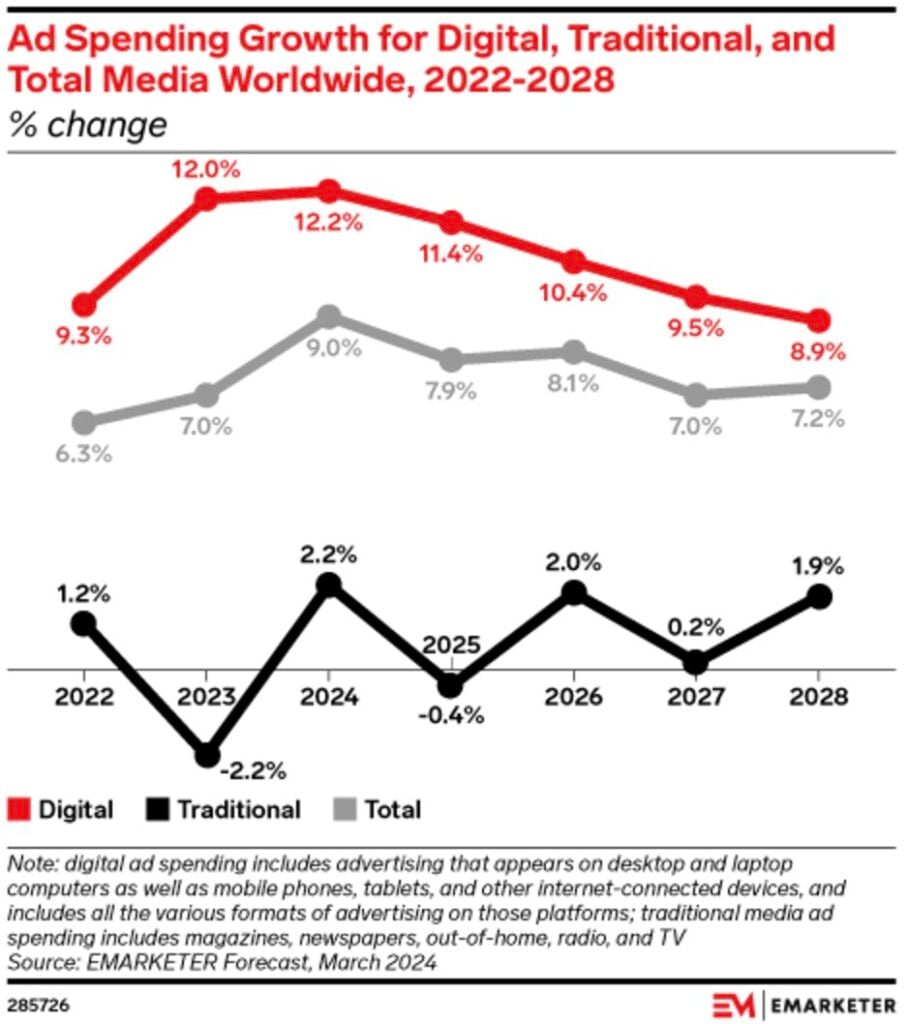
This bullish outlook reflects growing confidence in social media’s ability to deliver measurable results, particularly in industries that are early adopters of new technologies. As platforms introduce advanced features like augmented reality shopping and algorithmic audience targeting, businesses are preparing to capitalize on these opportunities. According to eMarketer, global social media ad spend is projected to grow by 11,4% in 2025, further validating the optimism reflected in our survey.
Challenges in Budget Allocation
Have you noticed your social media ads not reaching as many people as they did a year ago? You’re not alone—platform algorithm changes and rising ad costs are affecting businesses everywhere.
Despite the upward trends, businesses face persistent challenges in effectively allocating social media budgets. Respondents identified several key pain points:
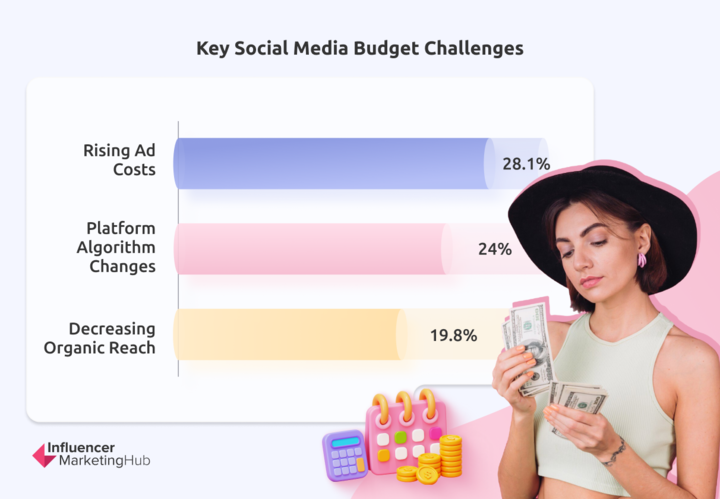
- Rising ad costs (28.1%): As platforms continue to refine monetization strategies, businesses are grappling with increased expenses to maintain visibility.
To combat rising ad costs, businesses can focus on hyper-targeted campaigns and leverage platform-native tools like Meta’s Advantage+ or TikTok’s Smart Optimization features, which streamline ad placements for cost efficiency.
Introducing TikTok Smart+ Campaigns! 🚀
TikTok is launching Smart+, a cutting-edge AI-powered solution designed to help businesses run campaigns more efficiently and maximise returns 🎉
With Smart+, brands can now:
💡 Achieve better performance – leverage machine learning and… pic.twitter.com/3pMyaynlE5
— Nonsensical | The TikTok Agency (@nonsensical_uk) October 10, 2024
- Platform algorithm changes (24%): Frequent updates disrupt content performance, forcing businesses to pivot strategies quickly and allocate additional resources to paid campaigns.
Staying informed about algorithm updates through platform blogs or expert webinars can help businesses adjust content strategies proactively.
- Decreasing organic reach (19.8%): The diminishing effectiveness of unpaid content necessitates higher investments in ads, adding financial strain, particularly for smaller businesses.
Insights and Implications
- Strategic Budget Increases Drive ROI
Businesses allocating larger portions of their budgets to social media are better positioned to leverage emerging features, such as shoppable posts and video-first strategies. These investments align with the 2024 report’s findings that industries like Retail and Media are leading the adoption of platform-specific tools. - Balancing Paid and Organic Strategies
With organic reach in decline, businesses must innovate to sustain engagement. AI-driven tools for predictive analytics and content optimization, as discussed in later sections, could offer pathways to maximize ROI while controlling costs. - Adapting to Rising Costs
The persistent rise in ad costs underscores the need for businesses to optimize budget efficiency. Short-form video, live shopping events, and audience segmentation emerge as high-impact solutions for navigating financial pressures. - Confidence Signals Strategic Shifts
The high percentage of businesses planning budget increases for 2025 reflects growing confidence in social media’s ability to deliver measurable outcomes. However, success will require agility to adapt to platform-specific changes and evolving audience behaviors.
Looking Ahead
As we move into 2025, the social media marketing landscape presents both challenges and opportunities. Businesses must align their budget strategies with broader marketing goals, ensuring adaptability to changing technologies and platform dynamics. With its unique ability to foster direct engagement and drive measurable ROI, social media will remain a critical component of marketing strategies across industries. The ability to allocate budgets effectively, however, will separate industry leaders from laggards in an increasingly competitive digital-first environment.
Social Media Platform Performance and ROI
Platforms Generating the Highest ROI
Our survey reveals distinct frontrunners among social media platforms in delivering exceptional ROI for paid advertising campaigns. Each platform offers unique strengths tailored to different industries and demographics:
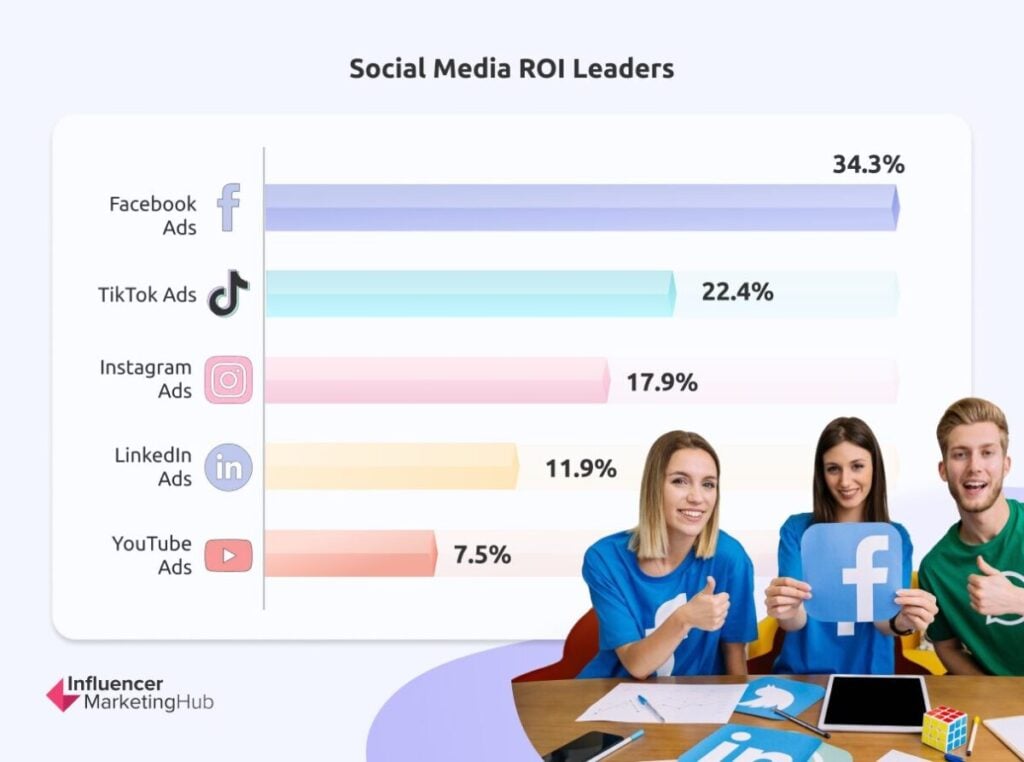
- Facebook Ads (34.3%): Continually ranked as the top performer, Facebook excels in audience targeting, making it the go-to platform for Retail and E-commerce brands aiming to drive direct sales. Its shoppable ad formats and cross-platform integration with Instagram ensure streamlined customer journeys. For example, West Gold & Silver tried using Facebook Dynamic Product Ads (DPA) to efficiently design and manage its ads campaign and saw a 36% higher return on Ad-Spend and a 60% lower cost per purchase.
- TikTok Ads (22.4%): Known for its immersive short-form video ads, TikTok has rapidly become the platform of choice for engaging Gen Z and Millennials. With features like Branded Hashtag Challenges and TikTok Shopping, it’s a goldmine for Media and Fashion brands looking to amplify reach and build cultural relevance. One of the best examples of this is the #MonclerBubbleUp challenge which included paid TikTok ads in Italy and France and brought in 7 billion views, which led to 170,000 new followers for the famous Fashion Brand.
- Instagram Ads (17.9%): With its emphasis on stunning visuals and interactive features, Instagram stands out in Fashion and Consumer Goods. Tools like Reels Ads and Stories Ads help brands capture audience attention at every stage of the funnel.
- LinkedIn Ads (11.9%): In the B2B space, LinkedIn shines as a hub for lead generation and professional networking. Industries like Education and Professional Services report significant ROI from Sponsored Content campaigns. One survey respondent noted, “LinkedIn allows us to reach decision-makers directly, reducing our sales cycle by 20%.”
- YouTube Ads (7.5%): A stalwart in long-form video content, YouTube offers unparalleled opportunities for storytelling. Brands use it to create in-depth tutorials and product demos that resonate with niche audiences. For instance, Extra Space Storage achieved a 14x growth in their share of rentals from online conversions with optimized TrueView Ads.
Organic Content Engagement Across Platforms
Organic content continues to be a cornerstone of social media strategies, with 86.5% of survey respondents actively incorporating it into their overall marketing efforts. However, the engagement landscape varies widely across platforms, as each caters to unique content preferences and audience behaviors.
Dominance of Short-Form Video (45.8%)
Short-form video formats like TikTok, Instagram Reels, and YouTube Shorts dominate organic engagement metrics. Their shareable nature, coupled with the ability to convey impactful messages within seconds, makes them a favorite among audiences, particularly Gen Z and Millennials.
- TikTok: With its algorithm prioritizing fresh, relatable, and trend-driven content, TikTok continues to outperform in terms of virality and organic reach. Brands such as Tenengroup have reported a 52% increase in conversion rate by utilizing the platform's “For You” Page, showcasing the platform’s power in driving revenue growth.
- Instagram Reels: Offering a mix of discoverability and storytelling, Reels remains a top choice for brands in Fashion, Travel, and Food & Beverage. One respondent noted, “Reels has completely transformed how we engage our audience—our post impressions doubled within three months.”
- YouTube Shorts: While newer to the game, Shorts allows brands to tap into YouTube’s massive audience base with bite-sized, high-impact videos, especially in the tech and education sectors.
Steady Performance of Image-Based Posts (25.3%)
Image posts on platforms like Instagram and Facebook maintain strong engagement, particularly for industries emphasizing visual storytelling. Static imagery, combined with compelling captions, drives brand awareness and aspirational messaging.
- Instagram Posts: Fashion and beauty brands see particularly high engagement rates through curated, aesthetic posts that resonate with aspirational audiences.
- Facebook Posts: While Facebook prioritizes video content in its algorithm, image-based posts still serve as an effective medium for audience engagement, particularly among older demographics.
Engagement Potential of Long-Form Video (16.9%)
Audiences seeking in-depth storytelling gravitate towards platforms like YouTube, where long-form video content thrives. Tutorials, explainer videos, and behind-the-scenes content allow brands to foster deeper connections and build trust.
- YouTube: Long-form video remains a top choice for educational content and product demos.
Emerging Role of Interactive Content (6%)
Although a smaller share of organic strategies, interactive formats like polls, quizzes, and live Q&A sessions are gaining traction. These formats foster two-way communication, allowing brands to directly engage with audiences and gather valuable insights.
- Instagram Stories Polls: Respondents noted success with using polls to gauge audience preferences, improving campaign targeting by 15%.
- TikTok Q&As: With TikTok Live enabling real-time interaction, brands are connecting with audiences on a personal level, increasing loyalty and trust.
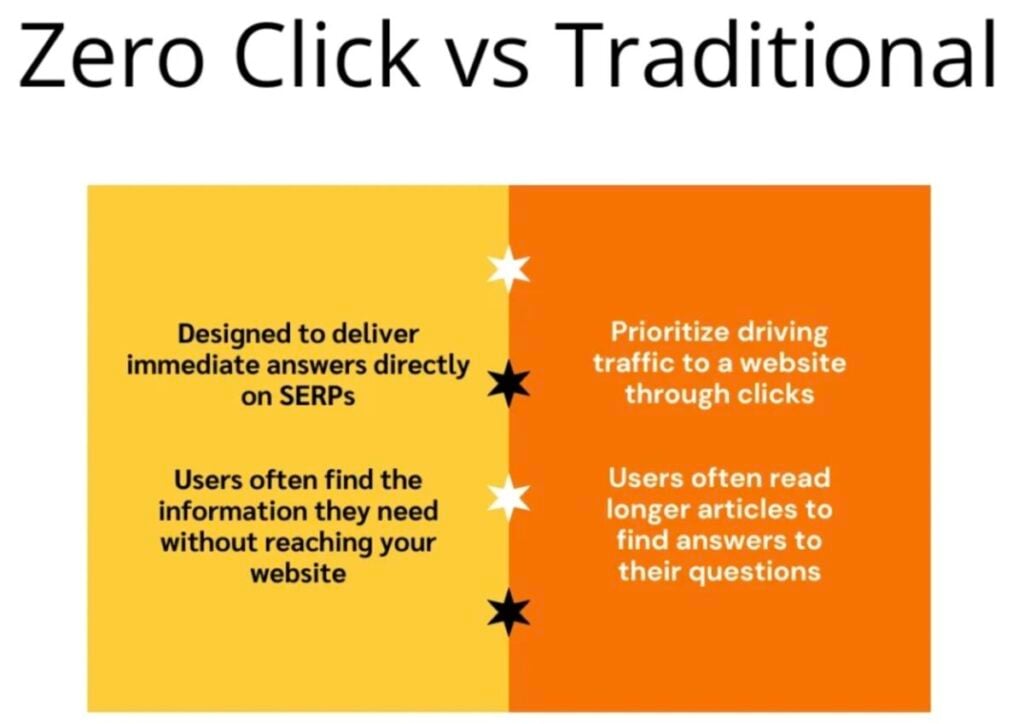
Zero-Click Strategies and In-Platform Conversions
Zero-click strategies, where user engagement and conversions occur entirely within a social media platform, are redefining how businesses approach digital marketing. These strategies eliminate the need for users to leave the platform, streamlining the customer journey and enhancing engagement. Our survey highlights the growing adoption and challenges of these approaches across platforms.
Source: impact.com
Adoption and Success of Zero-Click Strategies
Survey results reveal a marked increase in the use of zero-click strategies, reflecting their growing popularity:
- 41% of respondents reported marginal increases in conversions from zero-click tactics.
- 30.1% saw significant improvements, particularly on visually and video-driven platforms such as TikTok (32.5%) and Instagram (23.6%).
These platforms lead the way in offering innovative features that cater to seamless in-platform transactions:
- TikTok: The rise of TikTok Shopping and live shopping events has made it a hub for Gen Z and Millennials seeking quick and entertaining buying experiences.
- Instagram: Features like Shoppable Posts and Instagram Checkout allow brands to integrate shopping directly into the user experience, reducing friction and increasing conversions.
Challenges in Implementing Zero-Click Strategies
While the benefits of zero-click strategies are evident, brands face several hurdles in optimizing their implementation:
1. Difficulty Tracking Conversions and ROI (37.3%)
- As platforms increasingly limit third-party tracking tools, measuring the effectiveness of zero-click campaigns has become a significant challenge.
- Solutions like in-platform analytics (e.g., Meta Ads Manager or TikTok Ads Dashboard) can provide partial insights but often lack the depth of traditional analytics tools.
2. Maintaining Brand Visibility (20.5%)
- By keeping users within their ecosystems, platforms can overshadow individual brand identities, leading to inconsistent visibility.
- Businesses must focus on creating highly recognizable content, such as branded templates or influencer collaborations, to stand out.
3. Sustainability of Long-Term Engagement
- Zero-click strategies often focus on short-term gains, such as immediate purchases or sign-ups, at the expense of fostering lasting customer relationships. Brands need to integrate nurturing efforts like email campaigns or loyalty programs into their strategies to retain customers post-conversion.
Challenges in Social Media Performance
In the dynamic world of social media marketing, businesses face an array of challenges that can hinder their performance and ROI. From rising ad costs to managing organic content strategies, these obstacles underscore the need for innovative solutions and strategic agility.
Key Challenges in Paid Strategies
1. Rising Ad Costs (34.3%)
- The Issue: As social platforms increasingly focus on monetization, advertising costs have surged, making it challenging for businesses, especially small to medium-sized enterprises (SMEs), to maintain profitability.
- The Impact: Higher costs often result in reduced ad spend efficiency, with smaller budgets unable to compete against larger competitors.
- Industry Example: Retail and E-commerce brands have particularly felt the pinch as they rely heavily on paid ads for direct-to-consumer engagement.
- Potential Solutions: Businesses can mitigate these costs by adopting platform-specific optimizations such as retargeting campaigns and narrowing audience segments for precision targeting.
2. Managing Targeting and Segmentation (28.4%)
- The Issue: Increasing audience fragmentation and stricter data privacy regulations have made it more complex to identify and engage target audiences effectively.
- The Impact: Inaccurate targeting leads to wasted ad spend and lower campaign ROI.
- Emerging Solutions: Advanced tools like AI-driven predictive analytics and behavioral segmentation models can help marketers refine their targeting, even in fragmented ecosystems.
3. Low Engagement with Ads (17.9%)
- The Issue: As users are inundated with advertisements, breaking through the noise has become increasingly difficult.
- The Impact: Low engagement rates undermine campaign effectiveness, decreasing the likelihood of conversions.
- Recommendations: Brands should focus on hyper-personalized messaging and compelling creative assets, leveraging data insights to craft content that resonates with audience needs and preferences.
Challenges in Organic Content Strategies
1. Generating Creative Ideas Consistently (37.3%)
- The Issue: Many teams, particularly those in smaller organizations, struggle to maintain a steady pipeline of innovative content ideas.
- The Impact: Content fatigue leads to diminished audience interest and lower engagement rates over time.
Proposed Solutions:
- AI-Driven Tools: Platforms like ChatGPT and Canva can assist in brainstorming and automating aspects of content creation.
- User-Generated Content (UGC): Encouraging audiences to contribute content can diversify the content mix while building community engagement.
2. Keeping Up with Platform Algorithm Changes (16.9%)
- The Issue: Frequent algorithm updates often shift the way content is prioritized, leaving brands scrambling to adapt.
- The Impact: Unpredictable changes can drastically reduce organic reach, disrupting content strategies and requiring more investment in paid amplification.
Strategic Recommendations:
- Regularly analyze platform insights and industry trends to anticipate changes.
- Maintain flexibility in content strategies to pivot quickly when algorithms shift.
Insights and Recommendations
1. Leverage Platform-Specific Strengths
- Focus on high-ROI platforms like Facebook, TikTok, and Instagram while tailoring strategies to their unique strengths.
For example:
-
- Use Facebook for robust audience targeting and shoppable formats.
- Leverage TikTok to engage Gen Z and Millennials through short-form videos.
- Maximize Instagram’s visual appeal for industries like Fashion and Consumer Goods.
- Explore niche platforms like LinkedIn for B2B marketing or YouTube for long-form video storytelling.
2. Invest in Short-Form Video Content
- The dominance of short-form videos in both organic and paid engagement underscores their importance in social media strategies.
- Regularly produce high-quality, trend-aligned short-form videos for platforms like TikTok, Instagram Reels, and YouTube Shorts.
- Use interactive video features like polls, stickers, and call-to-actions to boost engagement.
3. Optimize Zero-Click Strategies
- Implement in-platform features like shoppable posts, live shopping events, and in-app checkout to drive conversions without leaving the platform.
- Use AI-driven analytics to improve tracking and attribution, addressing the challenge of measuring ROI in zero-click environments.
- Balance zero-click tactics with strategies that maintain brand visibility across external platforms and owned channels.
4. Address Performance Challenges with Agility
- Rising Ad Costs: Focus on high-performing formats like carousel ads or retargeting campaigns to maximize ROI.
- Targeting and Engagement: Utilize AI-driven tools for precise audience segmentation and personalized messaging to combat audience fragmentation and improve ad engagement.
- Content Innovation: Use UGC and collaborations with influencers to inject fresh ideas into campaigns, while AI tools can help streamline ideation and production.
5. Stay Adaptive to Platform Changes
- Monitor platform updates and algorithm changes to ensure content strategies remain effective.
- Build a multi-platform approach to reduce dependence on any single platform’s algorithmic fluctuations.
6. Collaborate with Influencers and Creators
- Influencer partnerships can drive both organic and paid engagement, particularly on platforms like Instagram and TikTok.
- Focus on micro- and nano-influencers for more authentic connections and higher engagement rates at lower costs.
The findings underscore the rapidly evolving nature of social media platform performance and ROI. Platforms like Facebook and Instagram continue to dominate, but emerging players like TikTok are redefining engagement norms with innovative formats and younger demographics. Meanwhile, the rise of zero-click strategies marks a shift in how businesses drive conversions within platform ecosystems.
Challenges such as rising ad costs, audience segmentation complexities, and algorithmic unpredictability highlight the need for businesses to adopt a dual strategy of innovation and agility. By investing in high-ROI platforms, embracing short-form videos, optimizing zero-click tactics, and staying attuned to platform dynamics, marketers can overcome these hurdles and capitalize on social media’s vast potential.
Ultimately, the key to thriving in the digital landscape lies in a balanced approach—leveraging data-driven insights, creative excellence, and cutting-edge technology to deliver impactful campaigns. As social media continues to transform, businesses that stay ahead of trends and adapt to challenges will remain poised for success in an increasingly competitive space.
Social Media Content Trends
Dominant Content Formats
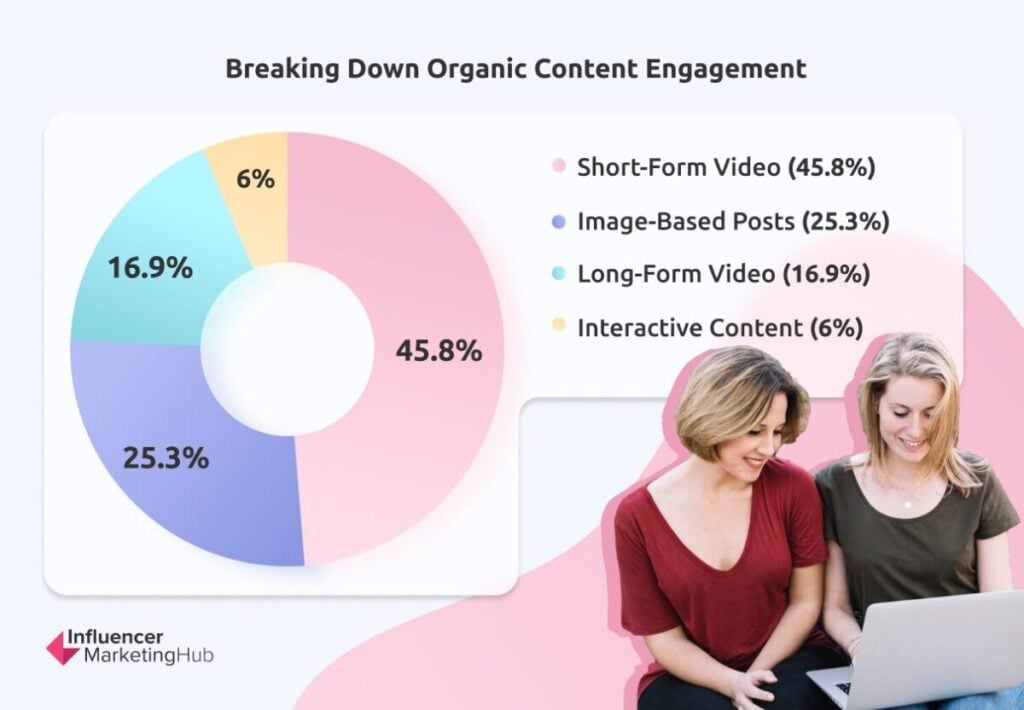
The survey results illuminate a decisive shift toward content formats that consistently generate the highest engagement across social platforms:
- Short-Form Video (45.8%): TikTok and Instagram Reels lead the pack, captivating fast-scrolling audiences with bite-sized, trend-driven content. This format thrives on its ability to entertain and inform within seconds, making it indispensable for brands targeting Gen Z and Millennials. For example, a fashion brand might use TikTok challenges to amplify reach and boost engagement rates.
- Image-Based Posts (25.3%): Despite the rise of video, image content remains vital for storytelling. Industries like Fashion, Travel, and Food & Beverage leverage visually striking posts on Instagram and Facebook to showcase their brand identity and connect emotionally with audiences.
- Long-Form Video (16.9%): YouTube dominates this category, offering a platform for detailed tutorials, product reviews, and narrative-driven content. For instance, beauty brands often use YouTube to share makeup tutorials, building trust and loyalty.
- Interactive Content (6%): Although niche, formats like quizzes, polls, and live Q&A sessions create unique opportunities for direct audience interaction. These formats are particularly effective for generating excitement around product launches or events.
The dominance of short-form video reflects a cultural shift toward instant gratification and shareable content, but the enduring relevance of other formats highlights the need for a diversified content strategy.
Gen Z vs. Millennial Content Preferences
Generational insights from the survey underscore distinct content preferences, revealing critical opportunities for targeted engagement:
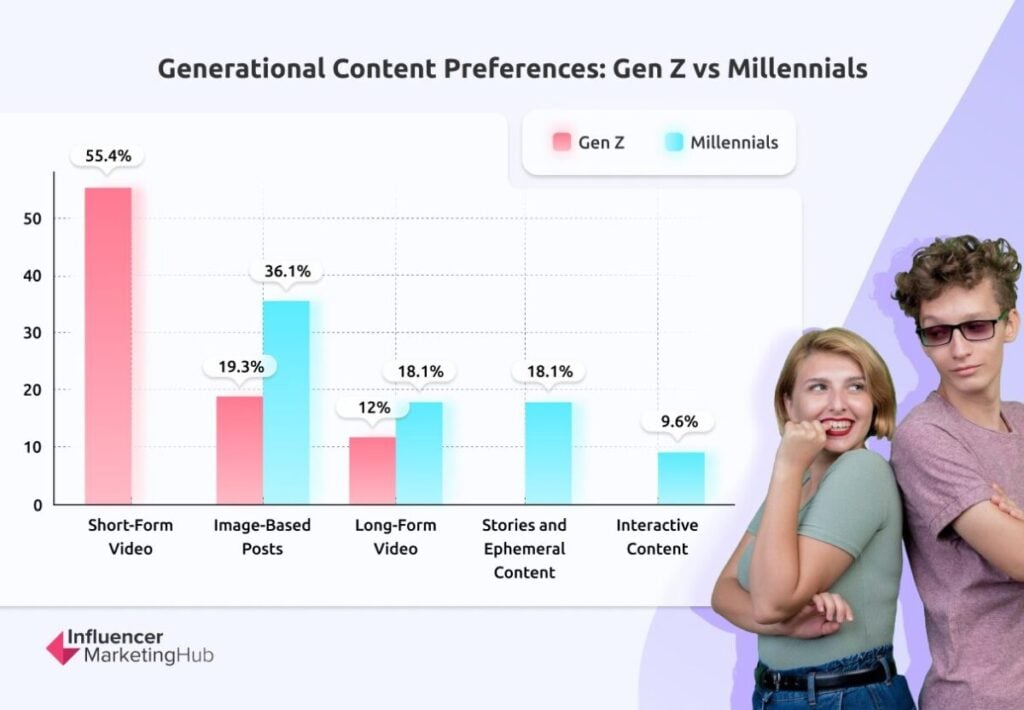
Gen Z Preferences:
- Short-Form Video (55.4%): Platforms like TikTok and Instagram Reels cater to Gen Z’s appetite for concise, visually dynamic, and entertaining content. Brands like Nike effectively harness TikTok to create trend-driven videos that resonate with this demographic.
- Image-Based Posts (19.3%): While secondary, aesthetic-driven images still hold appeal, particularly on Instagram.
- Long-Form Video (12%): YouTube remains relevant, offering depth in content such as gaming walkthroughs or DIY tutorials.
Millennial Preferences:
- Image-Based Posts (36.1%): Millennials gravitate toward visually rich platforms like Instagram, often favoring brands with strong storytelling elements.
- Stories and Ephemeral Content (18.1%): Millennials appreciate the authenticity and immediacy of Instagram Stories, which brands like Airbnb use effectively to showcase travel destinations.
- Long-Form Video and Interactive Content (18.1% and 9.6%): Millennials value detailed narratives and enjoy participatory formats, making them receptive to YouTube explainers or Instagram polls.
These insights highlight the importance of tailoring content strategies to generational behaviors, ensuring relevance and resonance across audience segments.
Challenges in Content Creation
The survey highlights significant hurdles faced by marketers in producing compelling social media content:
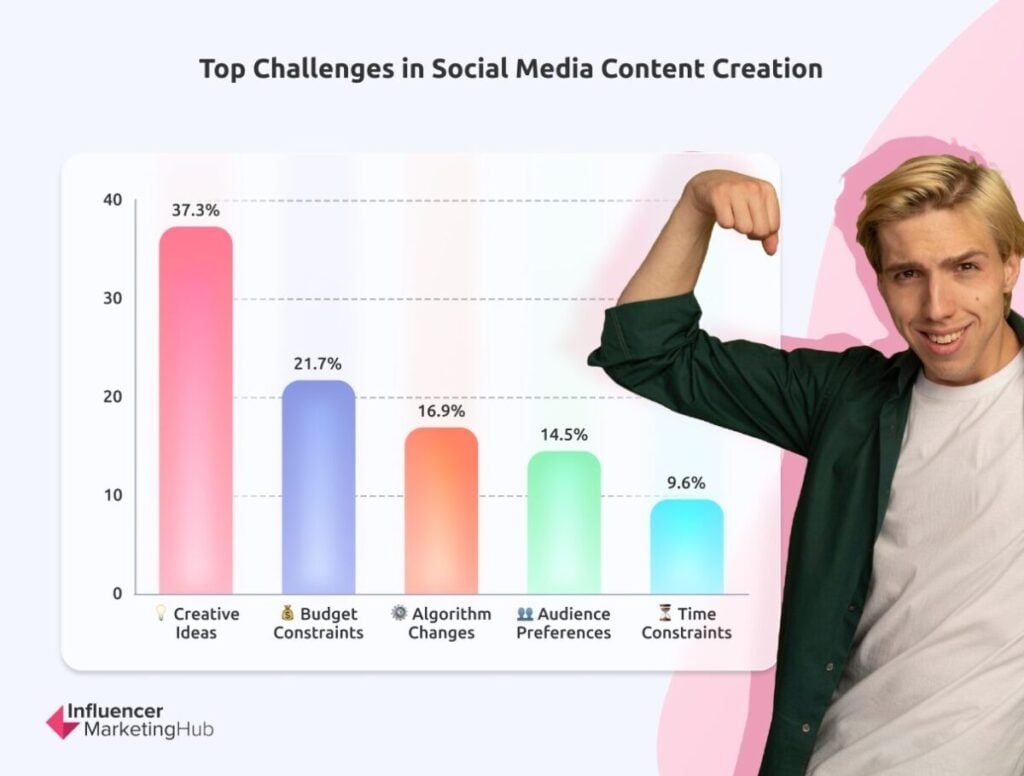
- Generating Creative Ideas (37.3%): Creativity remains a top challenge as brands strive to differentiate themselves in a crowded landscape. Smaller teams, in particular, may lack the bandwidth for continuous innovation.
- Budget Constraints (21.7%): Limited budgets hinder access to professional production resources, particularly for SMBs, forcing them to rely on DIY solutions or user-generated content.
- Keeping Up with Algorithm Changes (16.9%): Rapidly evolving algorithms on platforms like Instagram and TikTok complicate efforts to maintain visibility and engagement.
- Understanding Audience Preferences (14.5%): Decoding audience preferences requires consistent monitoring of trends, analytics, and feedback.
- Time Constraints (9.6%): Smaller teams juggling multiple responsibilities often struggle to dedicate sufficient time to strategic content creation.
These challenges call for innovative solutions, such as leveraging AI tools for ideation and workflow optimization.
Zero-Click Strategies and In-Platform Conversions
The growing adoption of zero-click strategies reflects a shift toward platform-native engagement, where users interact without leaving the platform:
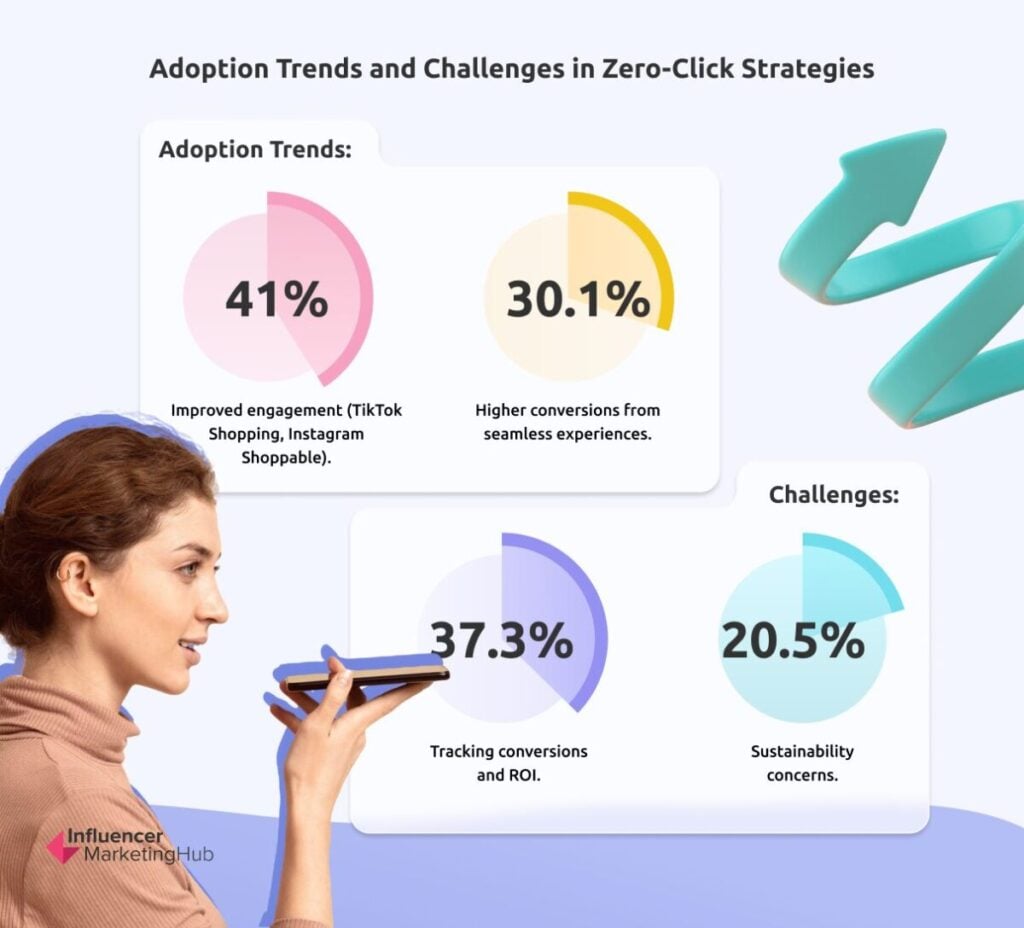
Adoption Trends:
- 41% reported improved engagement, attributing success to features like TikTok Shopping and Instagram Shoppable Posts.
- 30.1% experienced significant increases in conversions, especially on platforms prioritizing seamless user experiences.
Challenges:
- Tracking Conversions and ROI (37.3%): Limited tracking capabilities hinder precise measurement of campaign success.
- Sustainability Concerns (20.5%): Issues such as brand control and long-term engagement sustainability create uncertainty for marketers.
Brands that address these challenges through robust analytics and creative consistency can capitalize on zero-click opportunities.
Content Trends by Platform
The survey underscores the diverse roles platforms play in shaping content strategies:
- TikTok: Short-form video and trend-driven content reign supreme, making it the preferred choice for engaging Gen Z and younger Millennials.
- Instagram: Combines visually rich formats like image posts and Reels with ephemeral content through Stories. It remains essential for industries like Fashion and Lifestyle.
- Facebook: Retains its relevance for community-driven content and image-based posts, appealing to older demographics.
- YouTube: Dominates long-form video, offering unmatched depth for tutorials, educational content, and product reviews.
Understanding these platform-specific dynamics allows brands to allocate resources effectively and maximize reach.
Insights and Recommendations
1. Invest in Short-Form Video
- Focus on producing engaging TikTok videos and Instagram Reels that tap into trending themes and audience interests.
- Use influencers and UGC to enhance authenticity and reach.
2. Segment Content by Generational Preferences
- Prioritize trend-driven short-form video for Gen Z, while offering a mix of visually rich and interactive content for Millennials.
3. Leverage Zero-Click Opportunities
- Invest in shoppable features like Instagram’s product tags or TikTok’s shopping integrations.
- Use AI-driven tools for enhanced tracking and ROI measurement to mitigate data challenges.
4. Streamline Content Creation
- Explore AI tools like Canva or ChatGPT to generate ideas and designs efficiently.
- Build partnerships with content creators to reduce the production burden.
5. Stay Agile with Platform Trends
- Monitor algorithm updates and emerging platforms regularly to refine strategies and experiment with innovative formats.
These insights illustrate the transformative role of short-form video in driving social media engagement while emphasizing the need for tailored strategies to cater to diverse audience preferences. Generational distinctions between Gen Z and Millennials further highlight the importance of adaptive approaches.
The challenges in content creation, particularly around creativity and budgets, underscore the value of leveraging technology and collaboration to overcome resource constraints. Meanwhile, the rise of zero-click strategies offers new opportunities for brands to engage users and boost conversions within platform ecosystems.
By aligning content strategies with these insights, brands can enhance their impact, foster stronger connections, and remain at the forefront of social media innovation.
Influencer Marketing Insights
Adoption of Influencer Marketing
Influencer marketing remains a cornerstone of social media strategies, with a majority of businesses recognizing its value in building authentic connections and driving engagement:
- Widespread Adoption (64.6%): Nearly two-thirds of respondents incorporate influencer collaborations into their marketing efforts, highlighting its role as a trusted approach for brand amplification and audience engagement.
- Popularity of Nano- and Micro-Influencers:
- Nano-Influencers (1-10K followers, 38.7%): Praised for their authentic connections and high engagement rates, nano-influencers are particularly effective for hyper-targeted campaigns. Their relatability makes them ideal for small businesses and niche brands aiming to foster deeper audience trust.
- Micro-Influencers (10-100K followers, 32.3%): Offering a balance between reach and affordability, micro-influencers are a popular choice for campaigns that require scalability without compromising engagement quality.
- Macro-Influencers (100K-1M followers, 16.1%) and Celebrity Influencers (1M+ followers, 12.9%): These influencers are leveraged more selectively due to higher costs and diminishing engagement rates, often reserved for major campaigns that prioritize broad visibility.
This distribution underscores a strategic shift toward smaller influencers, reflecting the increasing demand for authentic and relatable brand advocacy.
Key Benefits of Influencer Marketing
Survey respondents highlighted several distinct advantages of influencer collaborations, particularly when working with smaller-scale influencers:
- High Engagement Rates: Nano- and micro-influencers consistently deliver superior engagement, with their audiences viewing their recommendations as genuine and relatable. This translates to higher ROI for brands compared to traditional advertising.
- Enhanced Trust and Credibility: Smaller influencers are perceived as more approachable and relatable, fostering stronger connections with their audiences. This trust is invaluable for brands seeking to humanize their messaging.
- Cost Efficiency: Nano-influencers, in particular, offer a favorable cost-per-engagement ratio, allowing brands to achieve impactful results without overspending.
These benefits make influencer marketing an indispensable tool for brands aiming to amplify their reach and resonance with audiences.
Challenges in Scaling Influencer Campaigns
Despite its benefits, scaling influencer marketing campaigns presents notable challenges:
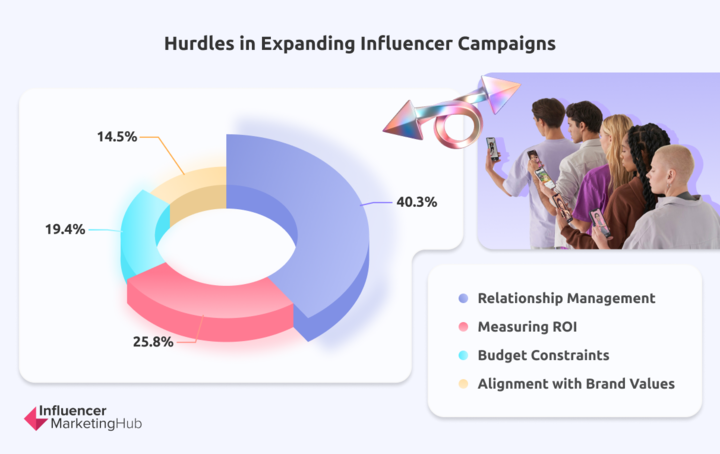
- Relationship Management (40.3%): Building and maintaining relationships with multiple influencers is resource-intensive. Brands often struggle to balance personalization with efficiency, particularly when managing numerous partnerships.
- Measuring ROI (25.8%): Tracking the direct impact of influencer collaborations on sales or conversions remains a critical pain point. The lack of standardized metrics makes it difficult to quantify success.
- Budget Constraints (19.4%): Allocating resources for larger-scale collaborations or campaigns with multiple influencers is challenging, particularly for smaller brands with limited marketing budgets.
- Alignment with Brand Values (14.5%): Finding influencers whose values align with a brand’s ethos requires rigorous vetting. Misalignment can risk audience alienation and diminished campaign effectiveness.
Addressing these challenges is crucial for brands to scale their influencer efforts while maintaining campaign integrity and effectiveness.
Influencer Marketing Trends
The influencer marketing landscape is evolving rapidly, with several key trends shaping its future:
- The Rise of Nano- and Micro-Influencers: Smaller influencers are becoming the backbone of influencer campaigns, offering niche targeting and authentic engagement. Brands are shifting focus away from celebrities to emphasize relatability and community trust.
- Performance-Driven Campaigns: Marketers are increasingly tying influencer collaborations to measurable outcomes, such as conversions and lead generation. Social commerce integrations, such as shoppable posts, are pivotal in this trend.
- Integration with Social Commerce: Influencers are driving in-platform purchases through features like TikTok Shop and Instagram Shopping. These tools simplify the customer journey, enabling seamless conversions from influencer content.
- Diversification Across Platforms: While Instagram remains dominant, TikTok’s rise as a short-form video powerhouse and YouTube’s reliability for in-depth content are encouraging brands to explore multi-platform strategies.
These trends highlight the growing sophistication of influencer marketing, moving beyond awareness campaigns to drive tangible results.
Platform-Specific Insights
Survey data reveals platform-specific preferences for influencer marketing:
- Instagram: Continues to dominate as the platform of choice for influencer collaborations, with its visually focused ecosystem. Features like Stories, Reels, and Shoppable Posts make it indispensable for lifestyle, fashion, and beauty brands.
- TikTok: Emerging as a frontrunner for short-form video collaborations, TikTok excels in engaging younger audiences with creative, trend-driven campaigns. Its viral nature makes it particularly effective for product launches.
- YouTube: A trusted platform for long-form video content, YouTube is ideal for in-depth product reviews, tutorials, and brand storytelling.
- Facebook: While less prominent, Facebook remains relevant for nano-influencers targeting community-driven campaigns, particularly among older demographics.
By aligning influencer strategies with platform strengths, brands can maximize their campaign impact.
Insights and Recommendations
To optimize influencer marketing strategies, brands should focus on the following:
- Emphasize Nano- and Micro-Influencers
Invest in influencers with smaller followings for authentic engagement and cost-effective results. These partnerships foster trust and relatability, especially in niche markets. - Leverage Social Commerce Features
Collaborate with influencers to create shoppable posts and drive in-platform conversions. TikTok Shopping and Instagram Shop are particularly effective for seamless customer journeys. - Streamline Relationship Management
Adopt influencer management platforms to handle outreach, contracts, and performance tracking efficiently. Tools like Aspire or Upfluence can centralize operations. - Enhance ROI Measurement
Invest in analytics tools that provide deeper insights into influencer performance. Metrics such as cost-per-click (CPC) and attributed revenue can help quantify campaign success. - Diversify Platform Strategies
Expand beyond Instagram by leveraging TikTok for short-form content and YouTube for in-depth narratives. This multi-platform approach ensures comprehensive audience reach.
These findings underscore the transformative power of influencer marketing in today’s social media landscape. The rising popularity of nano- and micro-influencers reflects a broader shift toward authenticity and niche targeting, enabling brands to foster meaningful connections with their audiences.
While influencer marketing offers unparalleled benefits, challenges such as relationship management and ROI measurement highlight the need for strategic planning and technological support. Emerging trends, including the integration of social commerce and performance-driven campaigns, further emphasize the evolution of this space.
By adopting these insights and aligning their strategies with platform strengths, brands can navigate the complexities of influencer marketing to achieve measurable success and lasting audience loyalty.
Community-Driven Marketing
The Role of Community Engagement in Social Media Marketing
Community-driven marketing is no longer a luxury—it’s a necessity for brands looking to foster genuine connections with their audiences. Beyond mere transactions, these communities become spaces where customers feel seen, heard, and valued.
According to our survey:
1. 64.6% of respondents actively engage in community-driven efforts, using platforms like Facebook, Reddit, or Discord to cultivate strong bonds.
2. Engagement Frequency:
- 54.8% engage weekly: These brands demonstrate their commitment through consistent dialogue and content delivery.
- 29% engage monthly: Even less frequent touchpoints can be effective when aligned with audience needs and expectations.
Take, for example, Patagonia, whose Facebook Group fosters discussions around sustainability—a shared value that strengthens customer loyalty. These insights reflect a growing trend where brands transform communities into hubs for user-generated content, advocacy, and long-term loyalty.
Most Effective Platforms for Community Engagement
Not all platforms are created equal. Survey respondents highlighted their preferences based on audience demographics and community goals:
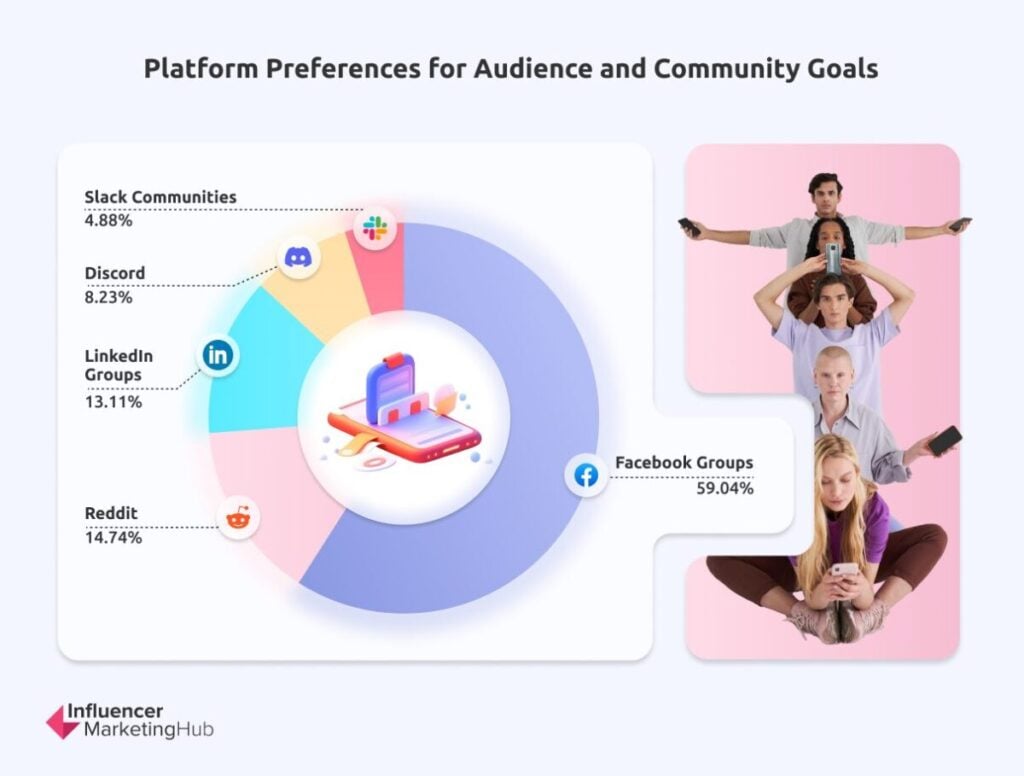
- Facebook Groups (58.1%): With features like polls, events, and threaded discussions, Facebook Groups are ideal for fostering diverse, active communities.
- Reddit (14.5%): Known for niche, topic-focused subreddits, Reddit offers unparalleled engagement for brands willing to participate authentically.
- LinkedIn Groups (12.9%): B2B brands thrive here by facilitating professional exchanges and thought leadership.
- Discord (8.1%): Emerging as a favorite among younger audiences, Discord’s real-time communication tools and gamified channels create dynamic engagement opportunities.
- Slack Communities (4.8%): While niche, Slack excels in creating exclusive spaces for professionals and industry-specific discussions.
Methods for Fostering Engagement
Sustaining a vibrant community requires innovative strategies:
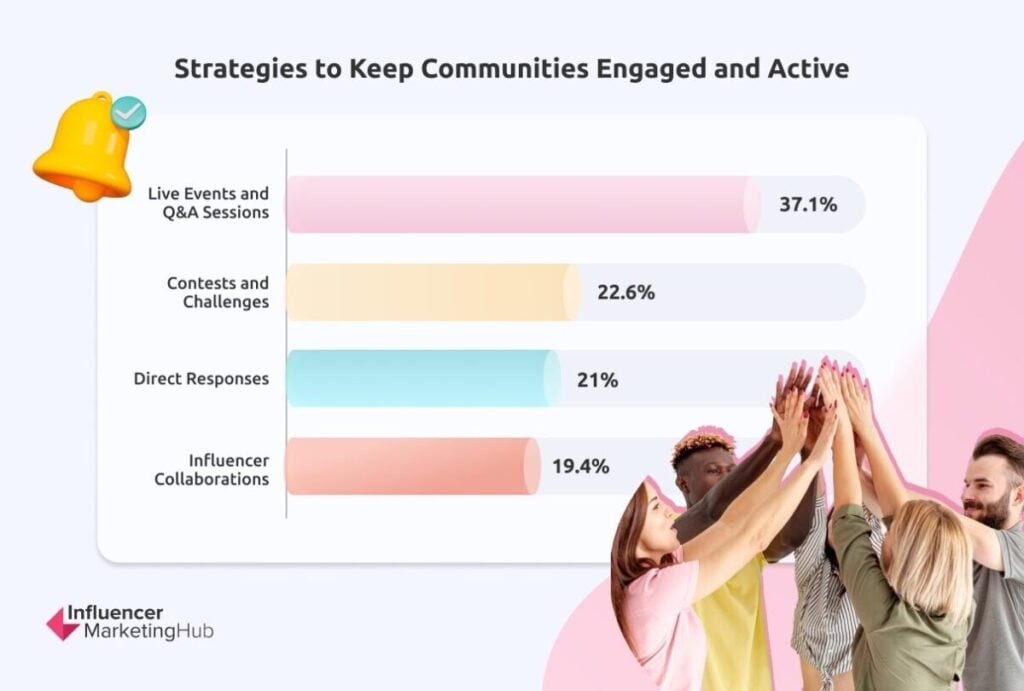
- Live Events and Q&A Sessions (37.1%): Real-time interactions—like AMAs (Ask Me Anything) or live product demos—help brands build trust. Glossier’s live Instagram Q&As have become a go-to for fostering transparency and authenticity.
- Contests and Challenges (22.6%): Gamified campaigns, such as “Best User Photo Challenges,” inspire participation while promoting brand visibility.
- Direct Responses (21%): Quick, thoughtful replies to audience comments signal attentiveness, fostering a stronger connection.
- Influencer Collaborations (19.4%): Partnering with community influencers can amplify trust and enhance engagement. For example, Lululemon’s ambassadors actively participate in their brand communities, driving authenticity.
Effectiveness of Community Engagement
The ROI of community-driven marketing is undeniable:
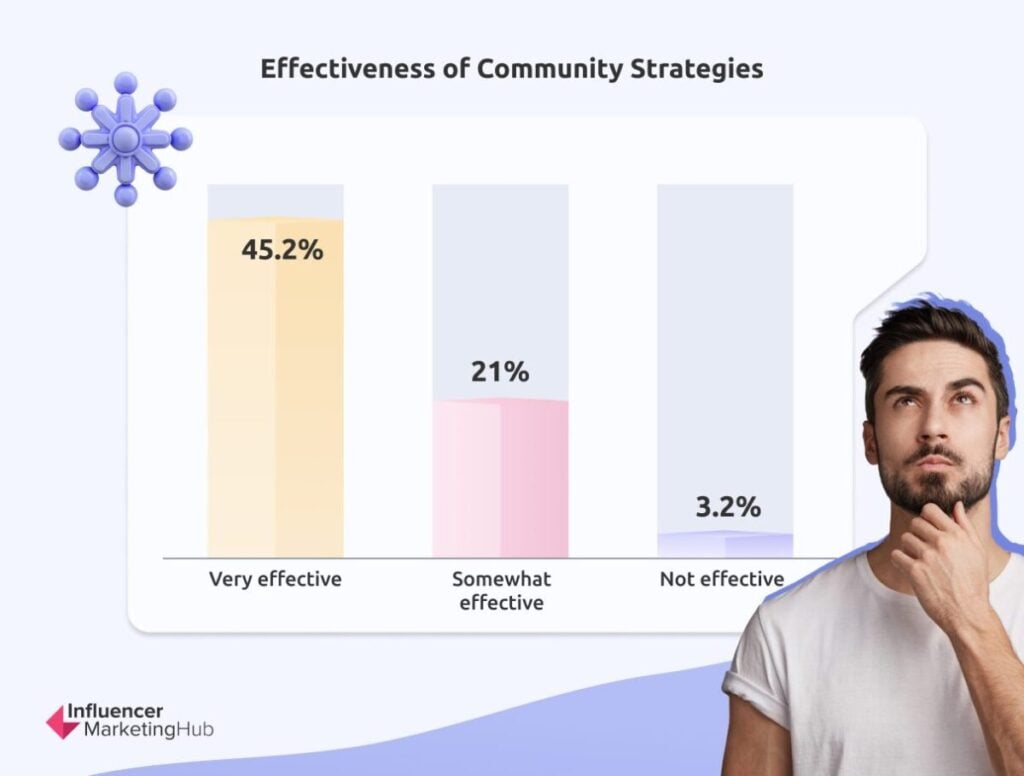
- 45.2% of respondents rated it as “very effective,” attributing success to increased loyalty, awareness, and even sales.
- 21% found it “somewhat effective” but acknowledged potential gaps in execution or alignment with broader marketing goals.
- Only 3.2% deemed it “not very effective”, often due to resource constraints or unclear objectives.
Challenges in Community-Driven Marketing
While impactful, community-driven strategies require overcoming key obstacles:
Challenge Solution Maintaining Consistent Engagement: Audiences can quickly lose interest without regular, relevant content. Use scheduling tools or dedicated managers to ensure steady content flow. Resource Allocation: Small teams may struggle to manage the workload of active communities. Outsource moderation or leverage AI tools for efficiency. Platform Limitations: Limited analytics or moderation tools can hinder scalability. Consider multi-platform management tools like Sprout Social or Hootsuite.
Insights and Recommendations
To unlock the full potential of community-driven marketing, brands should:
- Invest in Dedicated Community Management
Assign community managers or leverage outsourced experts to ensure consistent, quality interactions. - Leverage Analytics for Data-Driven Strategies
Use tools like Brandwatch or Facebook Insights to understand what resonates with your audience and adapt accordingly. - Expand to Niche Platforms
While Facebook dominates, exploring Reddit or Discord can uncover untapped audiences, especially among younger demographics. - Partner with Influencers or Ambassadors
Collaborating with trusted voices enhances authenticity and deepens connections, particularly on platforms like Discord or Reddit. - Foster Interactivity
Keep audiences engaged with challenges, live Q&A sessions, and gamified rewards systems.
Community-driven marketing is no longer just a trend—it’s a transformative approach to building lasting relationships with customers. Platforms like Facebook Groups and Reddit remain essential for engagement, while Discord is rapidly gaining traction among younger, tech-savvy users. Methods like live events, contests, and direct responses enable brands to cultivate vibrant, loyal communities.
Challenges like resource constraints and platform limitations can be mitigated with strategic investments in tools, data-driven approaches, and platform diversification. In a landscape where authenticity is paramount, brands that prioritize community-building will not only foster loyalty but also differentiate themselves in competitive markets.
By embracing these practices, businesses can create thriving ecosystems where customers feel valued, engaged, and empowered to advocate for the brand.
AI and Automation in Social Media Marketing
The Rise of AI-Driven Personalization and Automation
AI and automation are revolutionizing social media marketing, empowering brands to deliver hyper-personalized content, streamline workflows, and maximize ROI.
Survey data reveals:
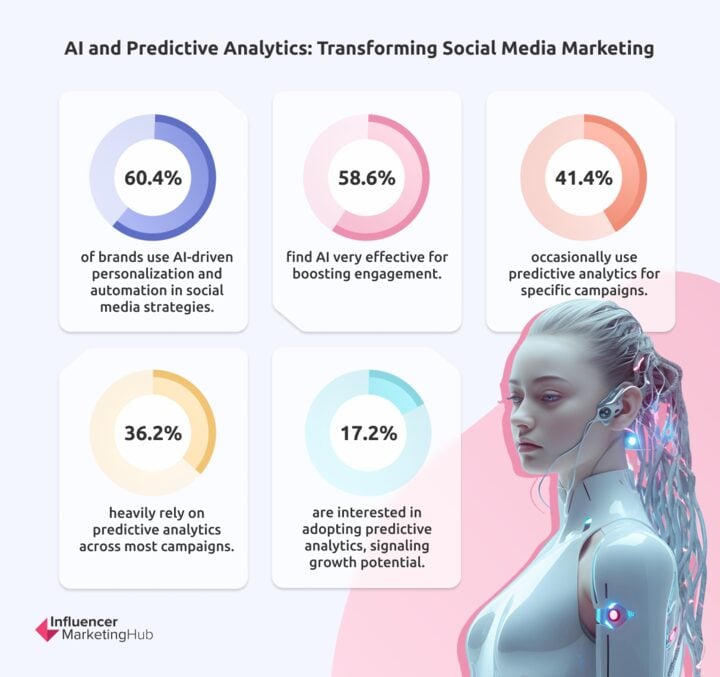
- 60.4% of respondents have integrated AI-driven personalization and automation into their social media strategies.
- Among these, 58.6% find AI “very effective” in improving engagement, while an additional 25.9% rate it as “somewhat effective.”
The power of AI lies in its ability to analyze user behavior, predict preferences, and deliver tailored content in real time. For example, Spotify leverages AI-driven social ads to promote personalized playlists, creating highly relevant and engaging experiences that enhance customer loyalty.
Brands that fail to adopt AI risk falling behind competitors. One retail brand, for instance, missed seasonal engagement peaks due to delayed implementation of predictive analytics, underscoring the competitive edge provided by real-time insights.
Use of Predictive Analytics in Campaigns:
Predictive analytics, a key component of AI, is emerging as a game-changer in social media marketing:
- 41.4% of respondents occasionally use predictive analytics for specific campaigns, while 36.2% heavily rely on it across most campaigns.
- 17.2% expressed interest in adopting predictive analytics, highlighting significant growth potential.
By examining historical data and audience trends, predictive analytics helps marketers anticipate behaviors, such as purchase intent or engagement likelihood.
Benefits of AI-Driven Marketing
AI is driving innovation across three critical areas of social media marketing:
1. Enhanced Engagement
- AI-powered tools personalize content recommendations, delivering posts aligned with user interests.
- 56.9% of respondents reported improved customer satisfaction and loyalty due to AI-driven strategies.
- Example: Netflix uses AI to promote content tailored to viewer tastes, driving seamless engagement across its social channels.
2. Increased Efficiency
- Automation simplifies repetitive tasks like scheduling, monitoring, and reporting, allowing teams to focus on strategy.
3. Improved ROI Tracking
- AI algorithms enable precise campaign performance measurement, allowing marketers to allocate budgets more effectively.
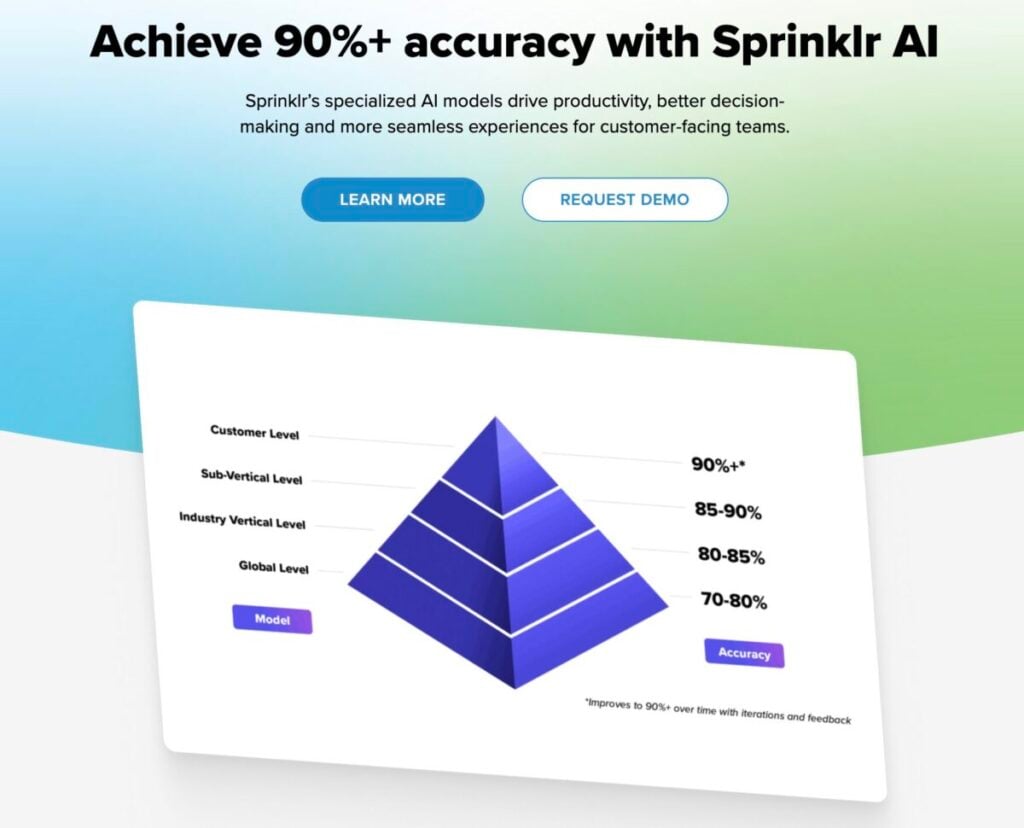
- Example: Dashboards like Sprinklr’s AI suite provide real-time insights into ROI, helping marketers identify and scale high-performing campaigns.
Challenges in Leveraging AI and Automation
Despite its advantages, AI integration presents several challenges:
1. Accuracy and Relevance (41.4%)
- AI tools sometimes provide inaccurate recommendations, leading to inefficiencies in targeting.
- Solution: Regularly audit AI-generated insights to ensure alignment with brand goals and audience expectations.
2. Lack of Human Connection (41.4%)
- While AI scales interactions, it cannot replicate the emotional nuance of human engagement.
- Solution: Blend AI with human oversight, particularly in customer service and brand storytelling.
3. Cost and Complexity (15.5%)
- High implementation costs and steep learning curves deter smaller businesses.
- Solution: Start with affordable, scalable AI tools and gradually expand capabilities as your business grows.
4. Data Privacy Concerns (1.7%)
- Ethical concerns about data usage persist, especially with evolving regulations like GDPR and CCPA.
- Solution: Adopt transparent practices and communicate clearly with customers about how their data is used.
Future of AI in Social Media Marketing
Optimism for AI’s future in social media marketing is high:
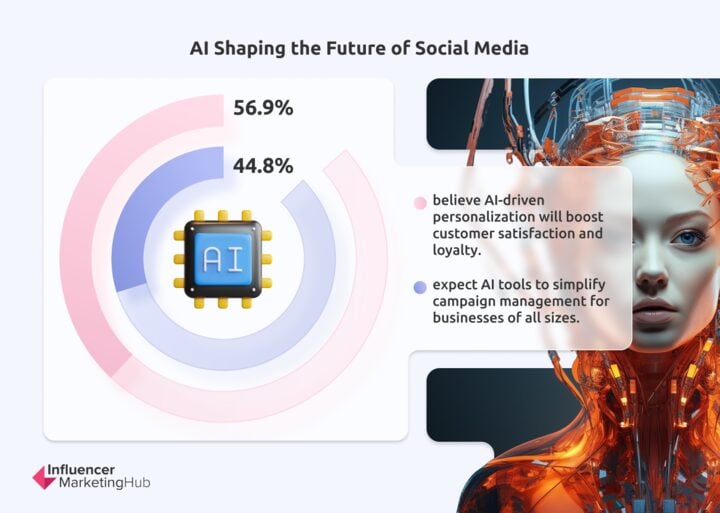
- 56.9% of respondents believe advancements in AI-driven personalization will significantly enhance customer satisfaction and loyalty.
- 44.8% expect AI tools to simplify campaign management, making them more accessible to businesses of all sizes.
Emerging technologies, such as generative AI, promise to revolutionize creative production, while advancements in machine learning will further refine audience targeting.
Recommendations for Optimizing AI Use in Social Media
To fully harness AI’s potential, marketers should adopt the following strategies:
1. Focus on Data Quality
- Ensure clean, accurate, and comprehensive data to maximize the effectiveness of AI algorithms.
- Example: A retail brand combined purchase history with engagement data to refine its targeting strategy, boosting conversion rates by 15%.
2. Combine AI with Human Oversight
- Automate operational tasks while maintaining a human touch in customer interactions.
- Example: A fashion brand used AI for scheduling but relied on its social team to respond personally to customer queries.
3. Invest in Scalable Solutions
- Choose tools that can grow with your business and integrate seamlessly with existing platforms.
- Example: Hootsuite Amplify offers flexible solutions for small businesses and enterprises alike.
4. Prioritize Ethical AI Use
- Maintain transparency about data collection and comply with privacy regulations to build trust.
- Example: Brands can create public-facing policies explaining how AI improves user experiences without compromising privacy.
5. Train Your Team
- Equip your staff with the skills to leverage AI tools effectively, from interpreting analytics to implementing automation workflows.
- Example: A global FMCG brand conducted workshops on tools like Sprinklr and Jasper AI, increasing team efficiency by 30%.
AI and automation have fundamentally reshaped the social media marketing landscape, empowering brands to deliver personalized experiences, streamline operations, and achieve higher ROI. From predictive analytics to advanced automation tools, AI equips marketers with the insights and capabilities needed to thrive in an increasingly competitive environment.
While challenges such as cost, complexity, and maintaining a human connection remain, they can be mitigated through careful strategy, ethical practices, and ongoing training. As AI technology evolves, it will unlock even greater precision, efficiency, and innovation, enabling brands to connect with audiences in unprecedented ways.
By investing in data-driven, ethical, and scalable AI solutions, businesses can position themselves as leaders in the rapidly advancing social media marketing space. Now is the time to embrace AI’s potential, ensuring not just adaptation but leadership in an AI-driven future.
Conclusion: A Time of Reckoning
The marketing landscape in 2025 isn’t just evolving—it’s fracturing. The old playbook of linear funnels, vanity metrics, and mass targeting is no longer sufficient. Social media is not just a platform; it’s a dynamic ecosystem of fragmented attention, rising skepticism, and unprecedented competition for relevance.
Three Core Realities Marketers Must Face:
- Trust is Non-Negotiable: Consumers demand authenticity, transparency, and ethical alignment. The brands they trust will thrive; those that rely on hollow promises or performative marketing will be rejected.
- The Algorithm is Not Your Friend: Social platforms prioritize their profitability, not yours. Fighting for visibility requires understanding the human motivations driving behavior—not just chasing clicks.
- Creativity Outpaces Efficiency: In an era of automation, the true differentiator isn’t speed or scale—it’s bold, resonant creativity that makes consumers stop scrolling and start engaging.
Marketers face a stark choice: adapt to this fragmented, value-driven ecosystem or fade into irrelevance.
10. Recommendations for Marketers
1. Optimize Budget Allocation for Maximum ROI
Survey results reveal that a significant percentage of marketers allocate less than 10% of their budget to social media marketing (46.9%) while many are increasing their budgets for 2025:
- Recommendation: Shift budgets toward high-performing channels and formats like short-form videos and influencer collaborations. Platforms such as TikTok, Instagram Reels, and Facebook Ads continue to deliver strong returns.
2. Focus on Short-Form Video Content
Short-form video remains the most engaging format, especially among younger audiences:
- 45.8% of respondents said short-form video generates the highest engagement.
- Recommendation: Prioritize investments in video production tailored to platforms like TikTok and Instagram Reels. Leverage trend-driven content and experiment with storytelling to captivate Gen Z and Millennials.
3. Leverage Social Commerce Features
Social commerce is a growing revenue driver, with 57.3% of respondents incorporating it into their strategies:
- Recommendation: Use features like Instagram’s Shoppable Posts, TikTok Shop, and Facebook Marketplace to create frictionless shopping experiences. Partner with influencers to integrate authentic product endorsements into shoppable content.
4. Embrace AI and Predictive Analytics
AI is transforming social media marketing with personalized recommendations and dynamic content strategies:
- 58.6% of respondents rated AI-driven personalization as “very effective.”
- Recommendation: Invest in AI tools for real-time personalization, predictive trend analysis, and automating repetitive tasks. Use predictive analytics to refine targeting and campaign performance.
5. Prioritize Influencer Marketing with Nano and Micro-Influencers
Nano-influencers (38.7%) and micro-influencers (32.3%) are the most effective at driving engagement due to their authentic connections with audiences:
- Recommendation: Build long-term partnerships with smaller influencers who align with your brand values. Focus on niche communities to maximize engagement and credibility.
6. Strengthen Community Engagement
Community-driven marketing is highly effective, with 45.2% of respondents finding it “very effective” in achieving brand goals:
- Recommendation: Build and maintain active communities on platforms like Facebook Groups and Reddit. Host live Q&A sessions, run challenges, and respond directly to audience inquiries to foster loyalty and trust.
7. Adapt to Zero-Click Strategies
Zero-click engagement improves algorithmic performance but poses challenges in tracking ROI:
- Recommendation: Optimize in-platform content to increase engagement while developing alternative strategies to track conversions effectively. Balance zero-click strategies with efforts to drive traffic to owned platforms like websites or apps.
8. Address Key Challenges
Rising ad costs and platform algorithm changes remain top challenges for marketers:
- Recommendation: Diversify advertising spend across platforms and focus on organic strategies like community-building and SEO. Stay updated on algorithm changes and refine content strategies to maintain visibility.
9. Tap into Emerging Trends
Stay ahead by adopting innovative approaches to social media marketing:
- Experiment with AR/VR experiences to enhance engagement.
- Explore niche platforms like Discord and Quora for targeted outreach.
- Highlight sustainability and social responsibility to resonate with value-driven consumers.
10. Foster Agility and Innovation
The fast-paced evolution of social media requires adaptability:
- Recommendation: Encourage experimentation and foster a culture of innovation within your marketing team. Monitor trends, test new platforms, and analyze performance data to pivot strategies as needed.
To navigate the challenges and opportunities of 2025, marketers must adopt a proactive and data-driven approach. By aligning budgets with impactful strategies, leveraging emerging technologies, and fostering authentic connections with audiences, brands can thrive in the ever-changing social media landscape.