While they might seem a bit daunting, statistics are key to understanding the ins and outs of digital marketing. They give you an insider's view of what's happening in the digital marketing world.
Whether you're a solo digital marketer or an agency, you must stay on top of the latest stats to remain competitive in this cut-throat space.
Let's look at some digital marketing agency statistics that you can use in designing your campaigns and strategies.
Where Do Digital Marketing Agency Statistics Come From?
These statistics come from different sources, some of which include:
- Research studies
- Surveys
- Industry reports
- Case studies
For example, HubSpot releases an annual report on the state of inbound marketing. Similarly, consultancies and publications like Deloitte, McKinsey, Forbes, Gartner, and eMarketer publish reports on digital marketing.
Additionally, digital marketing agencies themselves may also conduct internal research or gather data from their own campaigns to generate insights and statistics.
Why Are Digital Marketing Agency Statistics Important?
As a digital marketing agency, these statistics are important because they inform your campaigns. For example, if a report finds that X% of marketers use a blend of TikTok B2B marketing and SEO to reach Gen Z, that's an insight you can use to design campaigns for your clients targeting that demographic.
Digital marketing statistics are also representatives of the latest digital trends. For example, if statistics show that investment in social commerce has grown, it indicates the rise of platforms like Instagram and TikTok shopping.
You can also use statistics to benchmark your agency's performance against industry standards. If a report shows that the average click-through rate for Facebook ads is 1%, you can use it to judge your own campaign.
See if you fare well against the average. If not, it's time to tweak your strategy.
47 Must-Know Digital Marketing Agency Statistics
We have categorized the top digital marketing agency statistics into different categories. You can either go through them all or skip to the section that interests you the most.
Digital Marketing & Advertising Industry Size and Spend
1. The Global Spending on Digital Advertising is Set to Increase
In 2021, the global spend on digital advertising was $506.43 billion, a figure that increased to $667.58 in 2024 and is expected to reach $870.85 by 2027. It shows that more and more businesses are recognizing the importance and effectiveness of digital advertising in reaching their target audience.
PwC also reports similar findings. According to their Global Entertainment & Media Outlook report, advertising has seen a 22.6% increase, which is a testament to the growing prominence of digital channels. The report also forecasted that the growth of the advertising sector will increase at a compound annual growth rate (CAGR) of 6.6%, soon to become a $1 trillion market of its own.
The majority of this growth is fed by digital. PwC's forecasts are in line with those of Statista, showing that digital advertising will reach a valuation of $723.6 billion in 2026.
2. The US Digital Advertising Market Is Huge
According to PR Newswire, the digital advertising and marketing market in the US is valued at $460 billion, which indicates that the US is a huge stakeholder in the global digital advertising market. This observation is supported by the fact that companies in North America and Northern and Western Europe allocated 7.7% of their business revenues to marketing.

Marketing budget as a percentage of total revenue
In another survey, 43% of chief marketing officers (CMOs) and business leaders from North America and Northern and Western Europe reported planning to increase their digital marketing spend. Of all the digital marketing channels, almost half the marketing leaders plan to increase their digital marketing budgets for online video ads, influencer marketing, and social advertising.
3. Search Engine Marketing and Digital Audio Ad Spending Is Declining
Statista reports that one-fifth of marketing leaders plan to reduce their digital marketing spend on digital audio ads, digital out-of-home (DOOH) media, search engine marketing, and search ads. It's likely that the increase in ad-blocking software has influenced these decisions. The growing preference for ad-free streaming services could also play a role in the decline in digital audio ad spend.
4. Paid Media Gets a Quarter of the Marketing Budgets
In North America and Northern and Western Europe, marketing leaders allocate 27.9% of their marketing budget to paid media. The trend has remained consistent from 2018 to 2023, with a quarter of the digital marketing spending going to this segment.
Marketers use this budget to partner with paid media agencies or run campaigns on their own. Since Google Ads and Facebook Ads are the two largest ad platforms, they take up most of the paid media budget.
Creative Advertising Stats
5. BETC Is the Most Creative Advertising Agency In the World
Statista's survey found that Paris-based BETC is the most creative agency in the world. BETC is a full-service advertising agency that also offers digital marketing services such as social media management, website design, and influencer marketing. The agency had a 792.8-point creativity ranking. Some other agencies on the list are Ogilvy, DDB, VML, and Worldwide.
6. The USA Is the Most Creative Advertising Market
The USA topped the list for the most creative advertising market. The Gunn Report ranked the country first with 7.22 thousand points in its survey. The USA is home to some of the world's largest and most innovative companies, making it a highly competitive market for creative advertising.
The USA's ranking was higher than the next three countries on the list combined, i.e., France, the UK, and Canada. It shows the massive investment in digital marketing by US companies, be it through luxury marketing agencies or in-house marketing teams.
7. Oglivy and DDB Worldwide Are the Most Creative Ad Agency Networks
An ad agency network is a group of agencies under the same parent company, working together to provide creative and marketing services. Oglivy is the most creative agency network globally, with over 3.6 thousand points in the creativity ranking. It is followed by DDB Worldwide with 2.7 thousand points and VML with 2 thousand points.
Growth of Digital Marketing
8. Digital Marketing Is Forecasted to Grow At a CAGR of 9%
Digital marketing is expected to grow at a compound annual growth rate (CAGR) of 9% from 2020 to 2026, reaching a valuation of $786.2 billion. The same report from PR Newswire also found that the fastest and most popular growing digital marketing regions are the US, Europe, Canada, and Japan.
It's hard to dispute these numbers when we look at the increase in digital advertising in the past few years. For example, Oberlo reports that digital advertising spending increased by 10.9% between 2023 and 2024. However, this isn't a new trend. The largest annual growth in digital ad spending worldwide came in 2021, with a 29.8% year-over-year increase.

Digital ad spend between 2021 and 2027
9. B2B Service Marketers Spend More on Digital Marketing Than B2B Product Marketers
Web Strategies found that B2B product marketers allocate 57.1% of their marketing budgets to digital marketing, compared to 55.9% of B2B service marketers. The difference is likely due to the nature of B2B services, which are intangible and require more explanation for potential buyers. In contrast, B2B products can often speak for themselves through demos or samples.
On the other hand, in the B2C product industry, 61.1% of the total marketing budget goes to digital marketing. Even in the B2B service field, 58.5% of the budget is allocated to digital marketing.
Again, it makes sense since B2C businesses have a larger ground to cover than their B2B counterparts. Since their audience size is more significant and the target demographics are more diverse, B2C marketing must rely heavily on digital channels.
10. Digital Marketing Growth Is Higher In Some Industries
Digital marketing growth is higher than average in communications/media, consumer services, and technology industries, where the budget spend is 90%, 86.7%, and 70.3%, respectively. These industries have a higher reliance on online platforms for their products or services, making it important to invest more in digital marketing.
For example, media companies have to take the digital route to reach their audience, especially since traditional avenues like print and broadcast are declining in popularity. The same goes for tech, which has become largely digital. Since consumers are found online, businesses have to meet them there with targeted digital marketing.
11. Digital Marketing Is the Fastest-Growing In-Demand Skill
As digital marketing becomes mandatory for businesses, the need for professionals in this field is at an all-time high. Forbes reports that digital digital marketing is the fastest-growing skill in demand. Jobs in the digital marketing sector are expected to increase by 6% by 2032, much higher than the average job growth rate.
With digital marketing forecasted to be a $1.5 trillion industry by 2030, this spike is no surprise. CNBC also reports that search marketing managers and customer marketing managers are listed as the fastest-growing jobs in the US. Both jobs pay in the six-figure range and have a high growth potential.

Source: glassdoor.com
Content Marketing Statistics
12. Blog Posts Are a Popular Marketing Medium
Blog posts are extremely popular among marketers, with 90% of content marketers using them to fulfill their content marketing objectives. There are many ways to use blog posts. For example, marketers can use them to inform, educate, engage, and even entertain their target audience.
However, now that AI writing tools are available, 43% of content marketers are using them to generate blog ideas. Only 3% write complete blog posts using AI tools, while 28% use them to generate content outlines. This shows that while AI tools can assist in the content creation process, they are not a replacement.

How bloggers use AI tools
13. Blogs Bring in 67% More Leads
Demand Metric found that companies that have a blog on their website generate 67% more leads than those that don't have a blog. That's why, according to Orbit Media, every one in four content marketers says that blogs offer ''strong'' results for their digital marketing campaigns.
In the same Demand Metric infographic, we found that over 37% of marketers believe content-led websites are the best way to engage customers. Time and money investment is not just a marketer-side pursuit; customers also want to learn about brands through content.
Demand Metric reports that while 80% of customers are happy to learn about a brand through their personalized content, 68% of consumers spend their time learning about companies they are interested in. So, having blog content on your website, preferably personalized, not only brings in more leads, it also helps to provide customers with the information they want about your brand.
14. Blog Posts Are Under 1,500 Words On Average
The Orbit Media findings we've mentioned earlier also reveal that content marketers take 3.51 hours on average to create a blog post, compared to 2.24 hours in 2014. Meanwhile, the average length of a blog post is 1,427 words, which is 77% longer compared to 10 years ago. This is a clear sign that customers now need more value and depth from blog content.
15. Video Content Drives Strong Results
Orbit Media also found that 34% of content marketers report videos to drive strong results in their blogs. Video content is only second to audio (38%) in this regard.
Video marketing is not limited to blog posts alone. Wyzowl's State of Video Marketing report also shows that a staggering 91% of businesses use video marketing, the highest since 2016.

Video use by businesses over time
About 88% of marketers view video as an important part of their digital marketing strategy.
The most common type of video created by marketers is live action (48%), which is followed by screen recording (22%) and animated (24%). As for the use cases, 39% of marketers use video for customer testimonials, which is the most prevalent use case. Customer testimonials are followed by explainers, social media, presentations, product demos, and sales videos.
16. Shorter Videos, 1 to 3 Minutes Long, Are Most Commonly Used
As attention spans have decreased, video marketers are now creating shorter videos. The most common length of a marketing video is between 1 to 3 minutes. According to a HubSpot report, 35% of video marketers use this video length, whereas 27% of marketers believe 4 to 6 minutes to be the perfect length.
The same report also found that short-form video content is the most commonly produced video type in content strategies. These videos may include Instagram Reels, TikTok videos, teasers, and even short 30-second ads.
The effectiveness of short-form video content is such that marketers are increasing their investment in it every year. 26% of marketers plan to invest more budget in short-form video than other video formats.

Investment in marketing formats
Moreover, 57% of marketers who already use video content marketing plan to increase investments in this format in 2024. Similarly, 30% of marketers who did not use short-form video before will start using it in 2024.
17. CTAs and Annotation Links Improve Video Conversions
While the content in your marketing videos is definitely important, some extra elements can improve the overall performance of your videos. Wistia found that 41% of businesses add CTA, email capture forms, and annotation links to their videos to improve conversions.
Of these elements, annotation links are the most commonly used, as 45% of marketers use them to keep their viewers engaged. In contrast, 40% of marketers use CTAs, and 15% of them use email capture forms.
18. Over 200 Million People Listen to Digital Audio
eMarketer reports that around 222.7 million people, or 74% of all US internet users, listen to digital audio. By 2026, this number will go to 234.2 million, at a 1.6% increase. Marketers are turning to audio advertising as a new option to reach audiences because people seem to listen to and retain audio messages well.

US digital audio listeners
According to Audacy Inc., compared to other channels, 86% of consumers recall the ads they hear on podcasts. More so, 65% of listeners have bought a product or service from a company they heard about in an audio advertisement. Unlike TV ads, which only 19% of viewers watch till the end, 61% of audio listeners hear the whole ad till the end.
So, there's a potential for audio advertising to be an effective marketing tool. Podcast marketing agencies can expect to see a lot of demand for their services in the coming years.
19. Digital Advertisers Spend $9.74 Per Listener on Audio Ads
As we've already established, digital audio is a rising trend, and businesses are jumping on the bandwagon. According to Statista's outlook, by 2028, digital audio advertising ad spending will reach $13 billion, compared to $10 billion in 2023.
The increment in audio spending makes sense, as by 2029, there will be 1.5 billion users in the digital audio advertising market. On average, digital advertisers spend US $9.74 per listener on audio ads, so you can imagine the total sum spent on audio advertising to be massive.
Another interesting thing to note about audio advertising is that it is largely mobile-based. Statista also reports that 78% of total ad spending in the digital audio advertising market will come from mobile in 2029. So, we can expect to see more digital audio ads, such as Spotify Ads, on our phones.
Influencer Marketing Statistics
20. The Influencer Marketing Market Is Worth $24 Billion
According to our own State of Influencer Marketing Benchmark Report, the influencer marketing market has reached a valuation of $24 billion, which is quite a feat considering its infancy. Our Benchmark Report explains why this is the case. Since 85% of our survey respondents reported that they believe influencer marketing to be effective, we can see why the market is growing.
In another report, Statista also found that the global influencer marketing spend is $34.08 billion, while US businesses spend $26.09 billion on influencer marketing. This shows that the US is the largest market for influencer marketing.
21. Over 37% of Businesses Work With Up to 10 Influencers
Over 37% of businesses worked with up to 10 influencers in 2024, compared to 14.7% who worked with more than 1,000 influencers. It's likely that larger brands with bigger budgets are able to work with more social media influencers, but this statistic shows that influencer marketing is accessible to businesses of all sizes.

Number of influencers brands worked with in 2024
22. Over Half the Businesses Plan to Increase Influencer Marketing Spending
In our report, we found that in 2024, 59.4% of businesses plan to increase their budget allocation for influencer marketing. At the moment, 8.9% of businesses spend $50 to $100k on influencer marketing, while 8.3% spend $100k to $500k. About 14.5% of businesses spend more than $500k on influencer marketing.

How much brands spend on influencer marketing
We also noticed that businesses seem to see results through influencer collaborations, which is why many of them work with the same creators over and over again. Our survey showed that 63.2% of businesses work with the same influencers, while 36.8% work with new influencers on each campaign.
23. Most Businesses Work With Nano-Influencers
There are different types of influencers based on their industries and follower count. In terms of follower count, nano and macro-influencers seem to be the most popular among businesses. We believe this is due to their lower cost and higher engagement rates.
Also, there's an abundance of micro-influencers, especially on TikTok. Statista found that there are more than 100,000 TikTok influencers in the US and 42,000 of them have 50,000 to 100,000 followers.
Our survey showed that 44% of businesses will mostly use nano-influencers in 2024, while 25.7% plan to work with micro-influencers. Less than 13% of businesses work with mega and celebrity influencers. Most of these businesses are large enterprises that can afford to offer higher rates for influencer collaborations.
Our Monthly Influencer Marketing Report for July 2024 also showed that about 25% of businesses have shifted their budgets from mega and celebrity influencers to micro and nano-influencers. This trend is expected to continue in the coming years as businesses see more value in working with smaller-scale influencers who have a highly engaged audience.

Shift to micro and nano influencers
24. Employees Have Now Become Brand Influencers
Many businesses have also started to leverage their own employees as brand influencers. After all, who better to promote a company's products or services than the people who work for them?
According to the findings of our monthly report for July, almost 33% of brands actively use employees as influencers, while almost 20% of businesses use employees occasionally. In the future, we can expect to see more companies using employee advocacy to influence their target audience.

Employee-driven influencer marketing
25. Over 63% of Businesses Plan to Use AI in Influencer Marketing
In our benchmark report, we found that 63% of businesses plan to use AI in their influencer marketing campaigns. The same trend was visible in our monthly report, in which over 39% of respondents said that their views on AI integration in influencer marketing are highly favorable.
From AI marketing tools to AI influencer discovery and management, there are many ways to use AI in your influencer marketing campaigns. Our AI in Influencer Marketing Report provides further insights.
Social Media Marketing Statistics
26. Facebook Gets the Third Most Web Traffic of All Websites
Facebook gets the third most web traffic of any website in the world, behind only Google and YouTube, which shows the massive reach and influence of the social media platform. With over 2.96 billion monthly active users, Facebook is also the most used social media site. That's why the platform was able to generate $131 billion in ad revenue.
27. People Get News and Brand Information From Facebook
Facebook is not just a platform for connecting with friends and family; it has also become a major source of news and information for many people. According to Pew Research, of the internet users in the US who take their news from social media, 30% use Facebook.

News consumption by social media site
Similarly, people use Facebook to reach out to their favorite brands. Khoros found that 59% of Facebook users have contacted a brand through the platform, and 46% of these messages have been about customer care.
That means brands can use Facebook as a medium for customer service and marketing. For example, you can use Messenger and Facebook comments to communicate with your customers and resolve their issues. As for marketing, Facebook Ads help you reach a highly targeted demographic.
Wordstream reports that the average click-through rate for Facebook ads is 2.50% for lead generation ads. The CTR varies across industries, with medical, arts, real estate, and sports sectors having a CTR of 3%. The travel industry has a CTR of 6% on Facebook.
28. Facebook Users Are 25 to 34 Years Old
The majority (24.4%) of Facebook users are aged between 25 and 34. Since these people are in their prime working and spending years, they represent a highly lucrative target audience for businesses. In terms of gender, men are slightly more likely to use Facebook than women, with a breakdown of 56.8% male users and 43.2% female.
29. Instagram Has Over 1.4 Billion Active Users
There are over a billion monthly active users on Instagram. The figure is expected to reach 1.44 billion by 2025. Since it's a part of the Meta family, it shares user demographics similar to Facebook. That's why 55% of marketers use Instagram as a digital marketing channel, and 29% report getting the highest return on investment (ROI) from Instagram compared to other social media platforms.
Compared to all other social media platforms, marketers from around the world selected Instagram as the second most important social media platform for digital marketing campaigns.
30. Instagram Has a High Engagement Rate of 6.01%
Marketers tend to select Instagram as a marketing channel because of its high engagement rate. Mention reports that the average engagement rate on Instagram is 6.01%. Video posts do the best on the platform. While the global average engagement rate is at 6.01%, engagement in North America is up to 6.05%.

Instagram average engagement rate
You can also use Instagram auto-generated captions to increase the engagement rate of your posts, as Mention found that including a caption in your Instagram posts can increase the engagement rate by 5.38% to 6.7%.
31. Instagram Is The Way to Reach Gen Z
If your brand's target audience includes young adults, Instagram is a go-to platform for you. Statista reports that Gen Z US Instagram users spend 5 hours on the platform every week. That's enough time to reach and engage with them. Just make sure you select the best time to post on Instagram to maximize your engagement.
32. X Has 550 Million Users
X (previously Twitter) has 600 million active users, and 58% of them are under the age of 35. The platform is mainly populated with men, as it has a 2:1 male-to-female user ratio. Since X is not highly visual, most people spend around 34.5 minutes on the platform daily. If you want to capture your audience's attention during this time, you'll definitely need some Twitter marketing tools to help you out.
33. One-Third Brands Feel X Benefits Their Business
Although 60% of brands have a presence on X, only one-third of them feel that it benefits their business. Hootsuite also found that most brands don't use X for marketing because they don't achieve a positive return. In fact, only 30% of social media marketers believe they get a positive return on investment from X.
34. Pinterest Has 2.3x Lower Cost Per Acquisition Than Other Social Media Platforms
With over 522 monthly active users, Pinterest has emerged as a useful social media platform for marketing, especially for female-centric brands. Gen Z makes up 42% of Pinterest's user base, making the platform suitable for brands targeting younger audiences.
Part of the reason you can use Pinterest for business is that ads on the platform reach 28% of high-income earners. Even better, the platform's internal data shows that Pinterest ads are 2.3 times more efficient in terms of cost per acquisition.
Ads on the platform also see a two times higher return on ad spend. Plus, these ads bring in 11.4 times more prospects compared to other social media platforms. So, this might be the year you shift some of your advertising focus to Pinterest.
35. LinkedIn Has Higher Conversion Rates Than Other Platforms
Bringing in a revenue of $15 billion in Q3 of 2023, LinkedIn has become a popular platform of choice for digital marketing agencies and marketers. Why? Because the platform has twice the engagement and conversion rates of other platforms.
A common issue with LinkedIn is that not everyone gets the same results; some achieve great success, while others struggle to get views and engagement. So what sets them apart? Noah Kagan recommends writing long-form content on the platform, ranging in length from 1,900 to 2,000 words, since it gets the most engagement. Similarly, posts with headings also do better than single-heading posts.
You should also add images to your posts to get higher engagement. LinkedIn's data shows that images in posts generate 98% more comments than text-only posts.
36. Snapchat Has Over 422 Million Daily Active Users
Statista's recent report shows that Snapchat has over 422 million daily active users. Most of these users are young, with teenagers in the US considering Snapchat to be the most important social media platform of their generation. To put it in perspective, 48% of US internet users between the ages of 15 and 25 use Snapchat.
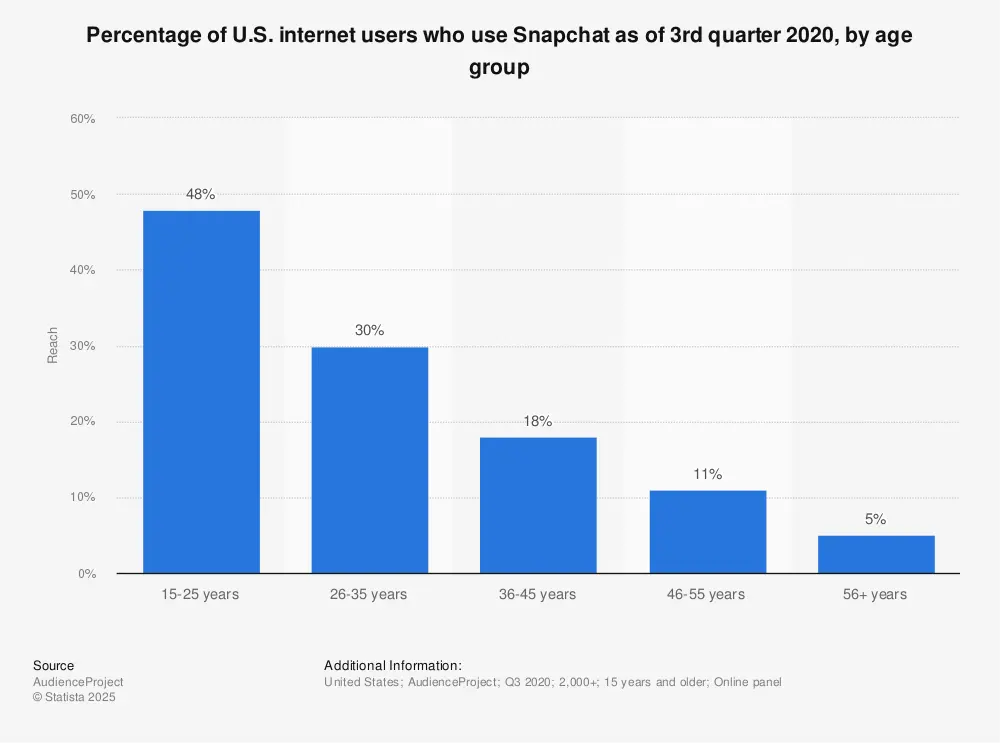
Snapchat users in the US
So, if you want to target teenagers, Snapchat can help you reach them. According to Snapchat, the platform reaches 90% of the population aged 13 to 24 years of age and 75% of the population aged 13 to 34 in more than 25 countries. This means the social media platform is excellent for global reach, too.
37. TikTok Has Been Downloaded Over 4 Billion Times
With over a billion users, TikTok has been downloaded over 4.1 billion times globally. Backlinko reports that there are 150 million TikTok users in the US monthly, with Americans over the age of 18 spending almost an hour (55.8 minutes) on the platform daily.
38. TikTok Users Trust Creator Recommendations
TikTok influencer marketing is bound to be effective, as 65% of TikTok users say they rely on creator recommendations and online reviews to inform their online buying decisions.
TikTok users don't seem to mind ads much, either. Social Media Today found that 70% of TikTok users say the platform's ads are enjoyable, while 72% say they find TikTok ads to be inspiring. It also helps that TikTok reaches 55.4% of the US population.
When you advertise on the platform, you have the potential to reach millions of users in countries all across the world. Sporting a highly saturated audience with a decent purchasing power, TikTok can be quite a money-maker for brands, especially those in the US, since the US has the second largest TikTok audience with 121.5 million users.
39. TikTok Generated $3.8 Billion In Consumer Spending
TikTok first generated over a billion dollars of consumer spending in a single year in 2021. Since then, the app has continued to flourish, generating $3.8 billion in consumer spending in 2023. Brands that want to stay ahead of the curve must have a TikTok marketing strategy.
Search Engine Optimization Statistics
40. The Conversion Rate for eCommerce Websites is Over 1.5%
Digital marketing agencies also have to account for SEO services for their clients. However, search engine marketing needs extra effort due to its low conversion rates and high competition. Statista found that the average conversion rate for eCommerce websites across all industries is a little over 1.5%.
Among all industries, general apparel has the highest conversion rate of 2%, while active apparel is in second place with a 1.9% conversion rate. Most of this conversion comes from Google traffic since the search engine accounts for most of the web traffic, including 95% of the mobile search market share.
41. The First Result on Google SERPs Has a CTR of Over 9%
A study found that the click-through rate of the top-ranking result on Google is 9.28% on average, while the second and third results have an average click-through rate of 5.82% and 3.11%. So, ranking on the top page of Google is a must if you want attention on your web pages.
Ahrefs found that 96.55% of the search results on Google do not get any traffic, most likely because they're too far down in search results. Only 1.94% of Google search results get one to 10 search visits per month.

Google search traffic to pages
Backlinko also found similar results in their research, citing that the number one organic search result on Google is 10 times more likely to get a click than the number 10 result. Also, the top result on Google SERPs is 27.6% of organic clicks. If you don't improve SEO for your website, there's little to no chance of getting any clicks or traffic from Google since Backlinko found that only 0.63% of Google users go to the second page to search for anything.
42. Google Business Profile Helps Rank Local Businesses
In BrightLocal research, 32% of SEO specialists said that Google Business Profile is the most integral ranking factor for local SEO. So, you should have a complete Google Business Profile. Don't stop there, though.
Post regularly on your Google Business Profile, just as you would with social media platforms. You can use Google Business scheduling tools to make the process easier. Also, ask your happy customers to leave a review on your Google Business Profile since that builds credibility.
Paid Marketing Statistics
43. Most Google Users Click on Ads
Demandsage found that 63% of Google users have clicked on an ad. On average, you can expect your ad to be clicked on by 5% of the users since the click-through rate for Google Ads is between 4% and 6%. On the display network, the click-through rate is even lower, so it's important to have an enticing ad creative that gets noticed and clicked on.
The position of your ad on SERPs also impacts its click-through rate. Having the first organic and ad position drives 49% of all Google clicks to your page. So, combining your organic SEO offers with paid ad campaigns can get you half the traffic for your targeted keywords.
44. SMBs Spend More on PPC Marketing Than SEO
Agency Analytics reveals that small and mid-sized businesses spend 7 times more on pay-per-click (PPC) ads than search engine optimization (SEO). The spending is so high because of the higher cost of running ads. Also, SMBs often have to compete with readily established larger businesses. So, they resort to paid marketing to stand out on Google's SERPs.
AI Use in Digital Marketing
45. Over 60% of Marketers Use AI Tools
HubSpot's State of AI report reveals that 60% of marketers use AI tools in one way or another in their profession. Of those using Gen AI, 47% use it to create images for marketing content, 45% use it to write copy, and 44% use it for content quality assurance, such as writing recommendations and spellcheck. As you can see, AI content creation software can be a huge time-saver and productivity booster for marketers.
46. AI Use Increases ROI by 70%
A Kibo study found that marketers who use AI in their marketing strategies are able to increase their ROI by an average of 70%. The higher ROI could be due to AI saving time for creative tasks, automating marketing operations, offering detailed insights on customer behavior, and personalizing marketing messages to each individual customer.
47. Marketers Are Divided About AI Taking Their Jobs
Our AI Marketing Benchmark Report found 35.6% to be worried about AI taking their jobs. However, the same percentage also believes the opposite. Meanwhile, 28.8% of marketers are not certain about the implications of AI for marketing professionals.

How marketers feel about AI
It's likely that some of this fear stems from not completely understanding what AI can and cannot do, as our study found that of marketers who are not using AI in marketing, 49% cite lack of understanding as the main reason. As the familiarity with AI increases, it's possible that concerns about job displacement may decrease.
Conclusion
Now that you have a list of digital marketing agency statistics to reference, you can start to improve your own marketing strategy. Keep in mind that these statistics are constantly changing as the digital landscape evolves.
New reports and benchmark studies come out every year. You should continue to keep an eye on these statistics to make sure your marketing strategy stays relevant.
For reports about influencer marketing, head over to Influencer Marketing Hub to stay updated on our latest research and insights.
Frequently Asked Questions
What does a digital marketing agency do?
A digital marketing agency provides digital marketing services, such as social media, paid content, search engine, email, and influencer marketing.
Which services do digital marketing agencies provide?
Digital marketing agencies provide a host of services, including but not limited to social media marketing, influencer marketing, email marketing, content marketing, and PPC marketing.
How much does it cost to work with a digital marketing agency?
The cost of working with a digital marketing agency varies depending on the services needed and the business scale. You can expect to spend anywhere from a few hundred to thousands, based on your company's goals.
How do I choose the right digital marketing agency for my business?
It's important to know your objectives before you start looking for a digital marketing agency. Next, narrow down your search by considering the agency's specialization, services, pricing, experience, and reputation. Ask for case studies and references from their previous clients. All these factors will help you make an informed decision.
How do digital marketing agencies measure success?
Digital marketing agencies use performance metrics and KPIs to measure the success of their campaigns. These metrics differ based on the service, such as engagement rates for social media marketing or click-through rates for PPC marketing.
What are the benefits of hiring a digital marketing agency?
A digital marketing agency takes a lot of load off your shoulders by handling all your marketing efforts. They provide expertise and resources that your in-house team may not have. For larger businesses with complex marketing needs, an agency can save a ton of time, while for smaller businesses, it helps them focus on core business activities.
Is a digital marketing agency better than in-house marketing?
The decision depends on your business requirements. If you have an expert in-house team that you can afford, then it may be a good option. However, if you're short on resources or need specialized expertise, a digital marketing agency would be a better choice.
Can digital marketing agencies help with paid advertising campaigns?
Yes, digital marketing agencies offer services like pay-per-click (PPC) advertising and social media advertising. However, you should inquire about their experience and success rate in managing paid campaigns before hiring them.
What tools and technologies do digital marketing agencies use?
Digital marketing agencies use dedicated tools for all services they provide. They might use these platforms to manage, schedule, analyze, automate, or report their campaigns.
Do digital marketing agencies offer customizable service packages?
Many digital marketing agencies provide customizable service packages to fit the specific needs and budgets of businesses. Discuss your requirements with an agency beforehand for the best experience.
